HAL Id: hal-02888432
https://hal.archives-ouvertes.fr/hal-02888432
Submitted on 18 Feb 2021
HAL is a multi-disciplinary open access
archive for the deposit and dissemination of
sci-entific research documents, whether they are
pub-lished or not. The documents may come from
teaching and research institutions in France or
L’archive ouverte pluridisciplinaire HAL, est
destinée au dépôt et à la diffusion de documents
scientifiques de niveau recherche, publiés ou non,
émanant des établissements d’enseignement et de
recherche français ou étrangers, des laboratoires
MORSE: mesoscale ocean radar signature experiments
Luc Leviandier, W. Alpers, E. Barthelemy, P. Brandt, P.V. Brennan, Glodina
Connan, A. C. Edwards, René Garello, Josep A. Rodenas Navas, H. Griffiths,
et al.
To cite this version:
Luc Leviandier, W. Alpers, E. Barthelemy, P. Brandt, P.V. Brennan, et al.. MORSE: mesoscale
ocean radar signature experiments. OCEANS’98 conference proceedings, Sep 1998, Nice, France.
pp.879-889, �10.1109/OCEANS.1998.724365�. �hal-02888432�
MORSE:
MESOSCALE OCEAN RADAR SIGNATURE EXPERIMENTS
Luc Leviandier1, W. Alpers2, E. Barthelemy
3
,
P.Brandt2,
P.Brennan
4
, G. Connan
4
, A.C. Edwards
5
,
R. Garello
6
,
J.Rodenas
6
,
H.Griffiths
4
,
D.Renouard
3
, A. Rubino2,
J.O.Thomas
5
,
K.Woodbridge
4
Abstract: The MORSE project is devoted to furthering the understanding of the imaging of the ocean surface by Synthetic Aperture Radar (SAR) in the presence of internal waves. The research is being undertaken by a Consortium of four University and two commercial partners under the MAST III
initiative of the CEC, Brussels. Work on the 3-year project started on 1st February 1996. A tank experiment is undertaken using the European (Coriolis) facility at the Joseph Fourier University, Grenoble. The tank water surface will be imaged by a new W-band radar built by the Department of Electronic and Electrical Engineering, University College, London. The images will be compared and contrasted with SAR ocean imagery from satellites such as ERS-1 and 2 or Radarsat (and possibly airborne acquisition in band X).
There is still much uncertainty relating to how one might extract useful information from such SAR imagery of the ocean surface. Not least of the remaining problems is how the ocean surface is actually imaged at the various wavelengths used by the radars, and how that imaging process depends on polarisation, angle of incidence, height above the ocean, speed of motion of the viewing aperture with respect to the ocean surface etc. Of particular concern is our understanding of the dependency of the imaging process on the radar wavelength at lengths in the one centimetre range. To this end, the W-band radar is to be built. Operating at a wavelength of 3mm, it will probe the tank water surface at capillary wavelengths, a region in which very little, if any, SAR imagery is available and in which the capillary waves are known to be considerably steep. Comparison of a variety of images, radars, image formation mechanisms and image modelling results are to be made, especially in those situations which involve the straining of the tank and ocean surface by currents, with particular emphasis on currents induced by internal waves. Another aspect of the problem is that although internal waves show up extremely well on SAR imagery, very little work has been done as to how this surface information may be used to probe the depths at which the internal waves are actually generated.
I. INTRODUCTION
It is now well established that satellite-borne SAR (synthetic aperture radar) is a powerfull mean to image those ocean
surface phenomena like swells or surface slicks that modify its roughness. Besides, internal dynamics of the ocean (internal waves and tides, mesoscale oceanographic features) interacts with its surface roughness through associated surface currents. Among these, long internal waves generated by tidal flow over the slope and propagating on the continental shelf are very energetic and have a considerable oceanographic and economic impact in the coastal zones. So local or global wave information is needed by a wide range of users in various activities like off-shore drilling and mining, ship routing, fisheries and aquaculture, environmental monitoring, acoustic communication, acoustic detection or coastal engineering in addition to physical oceanography itself.
Nevertheless, at the present time, radar imagery is not widely used by the potential users community. This is due to the lack
• of sufficiently reliable models able to retrieve quantitative results on the 3D structure of the hydrodynamic processes,
• of user-friendly software tools able to automatically process the images, releasing the user from a complex "manual" interpretation task.
The objective of the project is then to furthering the understanding of the physical processes involved in radar signatures of internal waves in the ocean. Tools are developped that will contribute to fill the gap between availability of images and routine use of them.
MORSE is a multidisciplinary approach in the above mentionned direction. It combines:
• Laboratory experiments using a dedicated small W-band (3 mm wavelength) radar imaging surface wave fields produced in laboratory tank and flume in Grenoble. • Theoretical research aimed at assessing and developping
a three scale hydrodynamic model to improve radar backscattering predictions.
1 TMS: Thomson Marconi Sonar,
7-9
rue des Mathurin$,92221
Bagneux cedex, France2 IfM: Institut fur Meereskunde, Universitat Hamburg
3 LEG!: Laboratoire des Ecoulements geophysiques et industriels
• Development of methods for the extraction of ocean
surface characteristics at high spatial resolution and for the resolution of the inverse problem consisting of retrieving the internal wave fields from surface information.
The project is structured into four inter-linked technical and scientific parcels, namely:
• the development of image processing algorithms for
automatic extraction of surface wave parameters from radar images (together with their implementation and testing on ERS7-l and 2 imagery).
• Experimental and theoretical research on basic non
linear hydrodynamic interactions between internal waves and surface gravity waves/capillary waves.
• The laboratory W-band SAR design, construction and
test for tank experiments.
• Research on radar backscatter modeling (including
modelling, especially for C-band, and inversion). The following sections of this paper outline characteristic results obtained in these areas.
With regards to software products, three of the above listed areas, the two first and the last one will result in precommercial software packages: WASP8, SWARM9, and RADSIG10• These are presented in the corresponding sections. They constitute the elements of a pre-competitive global tool for automatic extraction of information on ocean hydrological and dynamical conditions from radar images. As part of the data management plan of the project a MORSE Web sitell has been set up at OCS. This web site has been building up gradually and now contains general information regarding MORSE activities, some ERS-1 imagery of internal waves, and samples of data from the experiments carried out in the flume tank and Coriolis tank by LEGI scientists. Interested users may download and analyse some of this sample data from the web site before requesting complete data sets from LEGI (please visit the web site for further information).
The MORSE consortium comprises four university group (UCL, IfM, ENSTB, LEGI) and two commercial companies (OCS, TMS)
7
ERS: European Remote-sensing Satellite
8W ASP: WAves parameter extraction Software Package 9
SW ARM: Surface W Aves and Radar signature Modelling software package
10RADSIG: RADar SIGnatures software package
11URL of the MORSE Web Site: http://www.compulink.co.uk/-ocs/morse
II. OCEAN SURF ACE PARAMETERS EXTRACTION FROM IMAGES
The objective of this part of the project is to provide software tools for automatic extraction of wave parameters at high spatial resolution from radar images. Image processing algorithms have been provided by ENSTB: periodogram, auto-regressive (AR), Auto-regressive moving average (ARMA), and maximum entropy methods. These methods, presently included in the WASP package described below, as well as a Time-frequency one, the SPWVR (smoothed pseudo Wigner-Ville representation) have been presented elsewhere (see for exemple (MORSE, 1997)). The second part of this section is devoted to another approach for detection and location of internal waves using wavelets.
A) WASP
WASP is the practical wing of the overall software approach and is based on past OCS experience and ENS TB' s state-of the-art knowledge of wave parameter extraction. WASP incorporates an image handling segment (images readable from CD-Rom, tape or hard disk) which includes a bespoke (and simple) macro-language to enable users to define any new image data structures (within reason) so that such images may be read in for further processing. This should future-proof the system to some extent Sampling, clipping, selection, and sub-image export and storage operations are allowed. An image catalogue/index system is being included in order to supply a complete image/sub image/process audit. In the next segment, various high spatial-resolution parameter extraction algorithms (supplied by ENSTB) may be applied to sub-images to obtain a map of dominant and sub-dominant wavevectors over the image. Numerical data may be exported. The numerical data may be used to generate an image-overlay curvi-linear coordinate system. A third component of the system will enable 'transects' (grey level profiles along specified paths) to be obtained and stored.
B) Detection and Location of Internal Wave from SAR Images using wavelets
ENSTB is currently developing a prototype system for automatic detection, verification, assesment and characterisation of internal waves from satellite images. The long-range objective of this work is to develop image and signal processing algorithms that would allow a computer to produce analysis product as given by human analyst given satellite imagery. This is a difficult image analysis and understanding problem due to a lack of precise mathematical descriptions of the ocean features, coupled with the time-varying nature of these features and the
compilation of frequent partial obscuration by cloud cover. The total automation of this task is not presently feasible, but efforts toward that end will result in many tools that the analyst can use to reduce labor requirements and improve the quality and consistency of the analysis. Results so far indicate that it should be possible to reach this goal (R6denas et al., 1997).
Here, we present a case study for the detection and location of internal wave patterns from high-resolution SAR images collected either by the European satellites ERS-1/2 or the Canadian RADARSA T over the Strait of Gibraltar or the Andaman Sea.
I) Automatic Internal Wave Detection and Location In Fig. I, the main modules of the internal wave detector and location system are shown. Our strategy is to detect all possible internal waves, and then locate each individual internal wave packet. Methods for mesoscale feature extraction from SAR images often apply some kind of filtering as a first step. Therefore, the first step in our system involves averaging the original SAR image, 8000 ;x 8000 pixels in size, using a 8 x 8 pixel nonoverlapping window. This produces an image 1/8 the size of the original, thus reducing subsequent processing times. The image also exhibits substancially reduced speckle noise.
In this non-supervised internal wave detection approach, we begin by separating land from sea in order to avoid false alarms in the detection process. Extraction of the shoreline in SAR images is a difficult task to perform using simple image processing operations such as grey-value thresholding, due to the presence of speckle and because the signal returned from the sea surface may be similar to that from the land. Thus, an automatic method for detecting the shoreline accurately and efficiently from SAR images is also introduced in the system. It would be possible to replace the coastline detection step by a manual delineation of the coastline obtained by digitising a map. However, changes that have evolved since the map was produced, such as small sandbanks near the coastline, may then be missed. Then, the image is wavelet transformed with various scales, based on the Wavelet Transform Modulus Maxima (WTMM) method. The wavelet transform gives spectral decomposition via the scale concept. By decomposing signals into elementary building blocks that are well localised both in space and scale, the wavelet transform can characterise the local regularity of signals, such as internal waves, via the study of the wavelet local modulus maxima across decomposition scales. Internal waves features are detected at multiple scales and characterised by their positions and magnitude. Then, a method for internal wave feature enhancement, based on an· edge linking algorithm, is required in order to link these features. At this stage, we also discard significant local maxima belonging to the land class
by means of the sea-land mask obtained from the coastline detection method. The remaining features are significant features of the important structures in the SAR image, e.g. internal waves, oil slicks, eddies, natural films, etc. Once we have detected the significant features in the SAR image, some a priori oceanographic knowledge usually is required on the geometric shape and size of the internal wave signatures and look-alikes for the identification and extraction of internal wave features. For this purpose, we use the phase information given by the wavelet maxima for all the significant detected features from the SAR image. Finally, a clustering algorithm, based on the neighboring features, is applied for internal wave packet location in the SAR image.
2) Results and Discussion
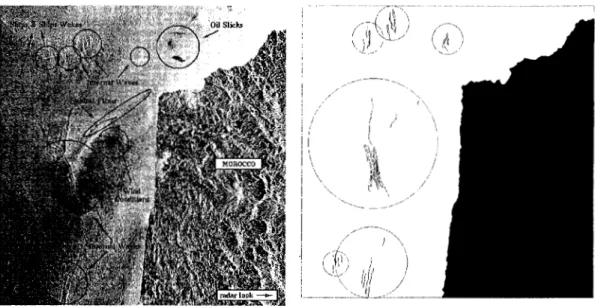
In this sub-section, we present several results of applying the proposed method for internal wave detection and location to two SAR images containing inernal wave patterns. The first SAR image to be analysed is show in Fig. 2(a). This is a 3-look ERS-1 SAR image from the Strait of Gibraltar (Spain), 8000 x 8000 pixels in size, with a pixel spacing of 12.5 m x 12.5 m, covering an area of approximately 100 km x 100 km and acquired on September 10, 1993, is used as first test image. The image has been displayed using histogram equalisation, to reduce loss of contrast in the reproduction process. This image shows roughness patterns associated with a short wavelength soliton-like internal wave train propagating eastwards into the Strait. It also shows other oceanic processes as for instance : possible oil slicks, ship and ship wakes, natural films, and dark spots due to wind conditions. In the image, these several possible internal wave look-alikes are also underlined. The proposed method for internal wave detection and location has then been tested on this SAR image. From Fig. 2(b ), it can be seen that internal wave features are well detected and located against background noise or other internal wave look-alike phenomena. Mainly six internal wave packets are detected, and located in the SAR image. From the observation of the wavelengths and crests of the detected internal wave packets, we can estimate that the largest packets are propagating westwards, since the spacing between waves increases away from the leading edge, as to be expected in dispersive waves. The image also shows the detected coastline from sea-land classification. Fig. 3(a) shows a RADARSAT SAR image from the Andaman Sea which was acquired on May 4, 1996, covering an area of 300 km x 900 km. This image shows the interactions between several internal soliton packets propagating westwards in the Andaman Sea. The attractive of this image remains in its difficulty to well detect internal wave features due to the high amount of oceanic information in the sea surface. In the image, we can observe
ERS-1/lSARPRl� Mean.Filter Gra<lientFilterand Threoholding Teclmiqile• --�----. Sea-land dassifkation D)' CGastJine detection 2-DW-Trrutsf°"" Local Modulwi Maxima
Fig. 1: Stages of the internal wave detection and location system several packets of internal solitons together with radar signatures of possible tropical rain cells and dark spots due to wind conditions. The fact of having several islands close to the coastline introduces a problem in the detection system. Fig. 3(b) show the results obtained from the application of the internal wave detection method. Most of the internal wave features have been detected although the difficulty due to noise, dark spots, and tropical rain cells in the image. It can be observed that the detected internal wave crests have their origin in the interaction with the shallow bottom topography of the shelf, which coincides with the estimations in the Andaman Sea given in (Alpers et al.,
1997).
3)Perspectives
An automatic method for internal wave detection and location has been applied to two satellite SAR images, and the feasibility of this technique for feature extraction has been demonstrated. The presented coastline detection method is accurate enough for the application on the internal wave detection problem. The wavelet transfonn in its multiscale edge detection version has been seen to be an excellent method for internal wave feature extraction. Several SAR images from two of the main world's places in generation of internal waves in the sea surface have been studied. Internal wave structures are well detected and located against background noise by means of local modulus maxima methods across scales. Internal wave packets are quite well distinguished against internal wave Jook-alikes using an a priori oceanographic knowledge of the internal wave geometry shape and size.
Our future research directions will be to introduce a next stage in the internal wave detection system for the internal wave characterisation problem based on the Hough and Radon transforms. The current work here serves as a motivation and explanation for the ongoing work on the understanding of internal waves from satellite data.
III. UNDERSTANDING OCEAN WA VE INTERACTIONS
This part of the project is devoted to better understanding of non linear interactions between long gravity waves and surface gravity/capillarity waves both on experimental and theoretical grounds.
For this purpose, tank experiments have been conducted and interpreted by LEGI, lfM bas improved its numerical hydrodynamical model and OCS has developped a software package.
A) Internal solitary wave refraction by a step shelf
Experiments are conducted in the 13 m diameter rotating tank equipped with a rectilinear shelf and an internal solitary wave generator. The shelf is 8 m long, 2 m wide and 0.7 m high; a 0.5 m wide Cos2-shaped profile links the shelf to the flat bottom of the tank The internal solitary wave generator is 5 m long box, one side of which is a dam. Thus it is possible to have a thicker upper layer in the box. By lifting the dan1, the light water behind the dam is released, generating a wave train which propagates downstream. We set the difference in the upper layer thickness across the dam so that, in non-rotating fluid, there is only one KdV solitary wave generated, followed by a train of dispersive waves. The internal wave generator can be moved so as to change the angle of the incident wave with respect to the shelf (30°
and 60° in this set of experiments). The tank is filled with a two-layer system of fresh and salted water. The upper and lower layer thicknesses are fixed for all experiments and equal to 3 cm and 77 cm in the deeper part of the tank and the relative density difference between the upper and lower layer is 0( l % ). The interface height variations with time are recorded by ultrasonic interface followers. The accuracy of the probes is ± I mm. Two of the probes are fixed along the axis of the internal wave generator and close to the slope, in the deep water, whereas the other 19 probes are along a rod which is moved between each run. The measurement field is thus 3.5 m along shelf and 2.9 m across shelf (1.5 m over
the shelf and 1.4 m over slope and deep water). We check that the waves recorded at the fixed probes are identical in amplitude and celerity for all runs. Thus, for given experimental conditions, we can normalize all records by
· the maximum amplitude recorded at the first probe.
Experiments are done first without rotation, then at two different rotation rates, f= 0.0314 s·1 and 0.0628 s ·1•
Fig. 2: Internal wave feature detection. (a) ERS-1 SAR image from the Strait of Gibraltar which was acquired on September IO, 1993, covering an area of 100 km x JOO km. It shows several internal wave packets together with other oceanic features. (b) Detected internal waves features by the proposed method.
\
)
Fig. 3: Internal wave feature detection. {a) RADARSAT SAR image from the Andaman Sea which was acquired on May 4, 1996, covering an area of 300 km x 900 km. {b) Detected internal waves features by the proposed method.
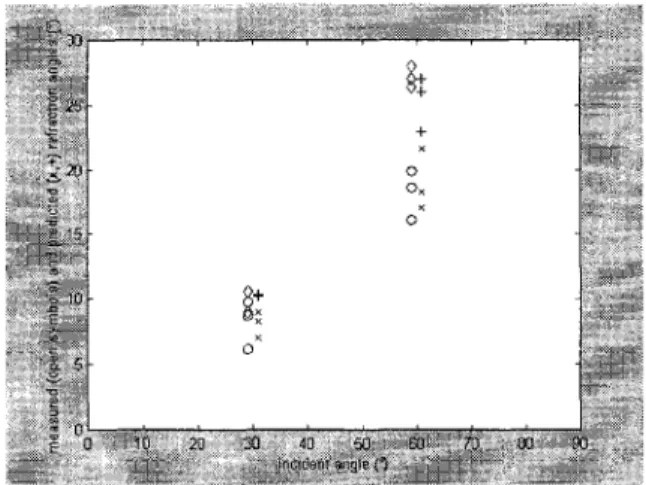
Top views of the measurement field at successive times allow to compute the refraction angle between the incident and the transmitted wave over the shelf. A linear theory shows that the transmitted wave angle is linked to the incident wave angle by a relation similar to Snell's law for surface waves (Pinettes et al., 1995). When the amplitude of the incident solitary wave is small, so that their celerity is very close to the critical phase speed, then we verify that the measured incident and transmitted wave angles are in agreement with the angles computed from Snell's law, using the critical phase speeds in the deep and shallow parts of the tank. However, when the solitary wave amplitude is large and the celerity significantly different from the critical phase speed, then the transmitted angle is smaller than predicted by the linear theory. The discrepancy between the predicted and the measured transmitted angle increases with increasing wave amplitude. We check that Snell's law is still valid granted that the (linear) critical phase speeds are replaced by the actual (nonlinear) celerities measured over the deep and shallow waters respectively. Then it appears that nonlinearity accounts for most of the discrepancy between the linear approximation and the measurements (fig. 4). This result is new, to our knowledge. Rotation has an influence
Fig. 4: Refraction angle as function of the incident angle. Open symbols (o and 0) correspond to the measured angles for two different initial conditions and the x· and + to the angles computed from the actual nonlinear celerities.
upon the amplitude of the incident wave, which decreases when rotation increases, and upon the waves' celerity which
tends to increase when rotation increases. We check that,
with or without rotation, there is a maximum of wave amplitude, located over the slope. It correponds to the local perturbation which is necessary to link the incident and the transmitted waves.
BJ Solitary free surface wave interaction with high frequency free surface waves.
The experiments are conducted in the 36 m long glass flume equiped with 2 different wave makers. At one end solitary wave are generated by a piston wave maker with highly efficient law of motions prescribed by computer program. The high frequency waves (frequencies between 1 Hz and 4 Hz, amplitudes approximately of 0.5 cm) are produced by a wedge wave maker driven sinusoidally by an electrical motor. The interactions are either strong (both wave trains travelling in the same direction) or weak (both wave trains travelling in the opposite direction). The main phenomenon is the phase shifting between the short wave train before interaction and the wave train after interaction.
The phase shift produced by the interaction between a surface solitary wave and a short surface wave can be analyzed using very simple arguments. We recall that a fluid particle affected by a solitary wave travelling at constant speed is dispaced horizontally by a given length l whcih therefore induces net mass flux associated to such waves. During the interaction with a short wave both motion combine. As a first approximation this combination may be regarded as linear. In consequence the short surface wave profile is shifted. The phase shift t.rp is the measure of this displacement between the wave train before and the wave train after the passage of the solitary wave. An approximate expression is thus:
t.rp =
�
khoIT
v3
vhri
where h0 is the water depth, k the short surface wave number and° A solitary wave amplitude. Note that Arp is independant of the short wave frequency. Nevertheless experiments suggest a slight increasing departure. from this law with decreasing frequency (see MORSE, 1997). CJ Interfacial solitary wave interaction with high frequency free surface waves.
This type of interaction is physically very close to the ones encountered in Ocean. Oceanic long nonlinear internal waves of characteristic length L of about 1 km are advantageously reproduced with solitary waves. On the other hand oceanic swells of wavelength
A
between 200 and 400 m are in our set-up produced as high frequency waves. The ratio of horizontal wave scalesA/
L is of order0.5 in both the experiments and the ocean.
For this topic the experiments are also conducted in the glass flume of LEGI. However 15 m of the total length was isolated and filled with brine and fresh water on the top. This produces an interface of finite thickness (of order 2cm
for a fractionnal jump in density of I%). The experiments are instrumented with two kinds of probes. Ultrasonic probes measure the interface displacement and capacitive probes measure free surface displacement. The wave generators are on one hand the wedge wave maker described above and an internal wave generator of the type used by Michallet & Barthelemy (1997, Exp. in Fluids, 22, pp 380-386 ). The wave interaction is measured with an array of 6 probes of each type. Both strong interactions (both wave trains travelling in the same directions) and weak interactions (waves travelling in the opposite directions) are performed. Experimental records consist of free surface and interface displacements against time at 6 locations in the flume 20 cm apart. For this set of experiments phase shifts were also expected. The weak velocity field associated to internal solitary waves compared with surface ones produces phase shifts too small to be measured with sufficient accuracy. However surface wave modulations are easily noticed. Strong interactions show that the surface wave is modulated with a decrease in amplitude as it interacts with the internal wave during strong interactions while the contrary is measured for weak interactions. This seems to agree with wave refraction on slowly varying currents theory as reported by Mei (1992, The Applied Dynamics of Ocean Surface Waves, World Scinetfic, p107). This experimental study should be supplemented in a near future by analytical modelling based on refraction-like 20 theories.
D) Numerical hydrodynamical modelling
The simulation of radar signatures of oceanic internal waves requires the knowledge of several physical mechanisms affecting the radar signal modulation. Among these are physical processes related to the internal wave dynamics itself, to its interaction with the ocean surface, and to the interaction between the sea surface and the electromagnetic radar waves, which constitutes the radar imaging of the ocean surface. At ItM an attempt is being made to describe all these physical processes by a set of different numerical models (the third one will be consideredin the last section): 1) A state-of-the-art internal wave model has recently been developed at IfM. This model, which has been applied to the simulation of the tidally induced dynamics in the straits of Gibraltar and Messina in the Mediterranean Sea, is capable of describing the generation and propagation of internal bores and their disintegration into trains of internal solitary waves (Brandt et al., 1997). Moreover, it allows for the numerical computation of realistic surface current fields associated with the internal wave dynamics.
2) The variable surface current fields calculated by the internal wave model are used as input data for the wave current interaction model of IfM. The wave current interaction model consists of a fast algorithm for the
integration of the action balance equation according to weak hydrodynamic interaction theory. The existing software allows the employment of different source functions and parameterizations of the equilibrium waveheight spectrum and the relaxation rate. It can handle fully two-dimensional surface current fields as well as time-dependent surface currents. Also events like blocking and trapping of wave packets at certain positions or propagation of waves through shear currents can be handled without numerical problems. E) SWARM
SWARM is the theoretical/modelling wing of the overall precommercial software and is based on past OCS experience and IfM's state-of-the-art knowledge of radar signature formation. (its scope goes beyond the hydrodynamical processes dealt with in this part and includes radar response).
Its purpose is to generate numerical models representing ocean surface wave spectra at a number of surface spatial points throughout a straining current system. At the moment only 1-0 steady-state current systems are allowed (satisfactory for the surface distribution of current in internal tides, internal wave trains, swell waves, flow over bathymetry etc). However, the user has control over the distribution of wavevectors in the basic wave spectrum, and the distribution of spatial points. The physics of wave refraction is used to determine wave paths, with the dispersion relation for deep water gravity/capillary waves being employed. The energy content of each wavevector is determined by the physics of wave action, with a variety of wind input and wave breaking terms to be made available (for example Romeiser et al., 1997). Because of the number of parameters involved, it is possible to generate many wave spectra models for a given current distribution, e.g., just consider the multiplicity of models that may be generated using different wind speeds and wind directions. The number of radar signatures that may be predicted (radar wavelength, incidence angle, polarisation, imaging mechanism) becomes prodigious. A database of computed signatures, called a 'features data base', is therefore set up using the same cataloguing system as WASP.
IV. LABORATORY SAR DEVELOPMENT A) Radar construction
The aim of this part of the MORSE project is to design, construct and test a high resolution W-band polarimetric imaging radar. The radar is designed for a resolution of approximately 6 cm in range, requiring a sweep bandwidth of 3 GHz, and 6 mm in azimuth. The maximum range is
very small (7 m) and so the transmit power requirement is just I 0 mW with antenna gains of 15 dBi. The VCO sweep
bandwidth is 3 GHz, the pulse repetition frequency 6 25 Hz and the image is formed in 1 second, during which time it is assumed that there is little movement within the imaged area. Antennas of 15 dBi gain should be suitable for these laboratory tank measurements, giving a SIN ratio of 20 dB or better across the image. Because of the very short range requirement, the IF frequency range is very low (1 OOs of kHz) and so may be sampled directly.
The FMCW technique is preferred to a pulsed radar for such high resolution at relatively short ranges. The design of the radar is simplified by using separate transmit and receive antennas, and this has the additional benefit of providing a polarimetric capability supporting HH, VY and HY modes though, of course, these are obtained with successive passes of the radar rather than simultaneously. To obtain azimuthal resolution of a similar order to the range resolution requires the use of aperture synthesis techniques with the radar moving along a rail. Usually the motion would be linear, but in this case a circular path is taken which somewhat complicates the azimuth processing. Aperture synthesis has been shown to be compatible with the FMCW technique (Griffiths, 198 8) and a practical radar of this kind has in fact already been built and demonstrated by UCL at lower frequencies.
The beamwidth of the transmit and receive antennas should be sufficiently broad to provide full coverage of the swath in the vertical plane. In the horizontal plane the maximum achievable azimuth resolution is half the azimuth dimension of the antenna. For this application, horn-type antennas are used with apertures of approximately 6 mm x 4 mm and with beamwidths of approximately 35° and gains of approximately 15dBi. This gives a maximum achievable azimuth resolution of 3 mm, though the particular geometry used means that this resolution is not realised, however an azimuth resolution superior to the range resolution is easy to achieve.
The radar velocity is 1 m/s requiring a minimum theoretical PRF of 333 Hz though again because of the unusual geometry a somewhat higher value is required to suppress the aliased doppler beams. VCO linearity is important, and is managed by standard calibration techniques in which the VCO frequency-against-voltage characteristic is measured and the required voltage-against-time characteristic derived and stored in digital form in RAM. Motion errors, which become significant at 0.8 mm (a quarter of a wavelength), are likely to be a more challenging problem, especially in, field trials where autofocus processing will certainly be required. It is planned to use corner reflectors in order to determine the exact path of the radar and correctly focus the aperture. A summary of the principal radar parameters is given in table l.
radar centre frequency: 94 GHz sweep bandwidth 3 GHz PRF 6 25 Hz imaging time 1 s transmit power l OmW radar velocity 1 m/s size of antennas 6 mm x4 mm gain of antennas 15 dBi range resolution 6 cm azimuth resolution 1.5 cm operating range 7m SIN ratio >20 dB
Table 1. Principal radar parameters
BJ First trials
During the first 1 2 months of the contract the radar design was established and the unit was successfully constructed at UCL. The VCO linearity was measured and an EPROM was programmed with the necessary calibration at ENSTBr. Initial measurements at UCL confirmed that the radar was working as expected although there appeared to be excessive mixer noise. Subsequent trials during the next 6 months at LEGI revealed that sensitivity was indeed below expectations due to the low-frequency mixer noise which is a fundamental weakness of the homodyne radar achitecture employed in the design. Subsequently, efforts have been made to reduce the mixer noise and its impact by increasing the PRF (by a factor of 4) which increases the IF frequencies and means that the mixer operates in a region which suffers less from low-frequency noise. The increased PRF results in reduced SIN ratio from the azimuth processing, but this can be restored simply by coherently averaging 4 adjacent looks (or, indeed more than 4 if a further improvement is required at the expense of azimuth resolution). These improvements are currently being finalised, after which it is planned to undertake further trials in both the stationary flume tank and the Coriolis turntable at LEGI.
V. RADAR BACKSCATTER MODELLING The objective of this part is on one hand to further develop models for radar signatures generation, and on the other hand to address the inverse problem. This results in basic research as well as in software developpement.
A) Imaging theory
The output of the model described in section 3.4, a two dimensional modulated wave spectrum for each grid point,
is fed into the advanced composite surface scattering model of ItM for the numerical computation of radar signatures. This model is based on the standard expression of Bragg scattering theory, but it includes a number of second-order terms of the normalized radar backscattering cross section (NRCS) of the sea surface, which are obtained from a Taylor expansion of the NRCS with respect to the surface slopes parallel and normal to the radar look direction. The second-order terms of the NRCS account for the contribution of waves which are long compared to the short Bragg waves (Romeiser and Alpers, 1997; Romeiser et al., 1997). For each radar image according to the composite surface scattering model, an additional image is generated for comparison, which represents the result of a simple Bragg model without higher-order terms.
For the comparison between simulated and measured radar signatures of internal waves we used ERS 112 SAR images acquired over the straits of Gibraltar and Messina. It turned out that only very few of the available SAR images of internal waves are suited for a complete quantitative comparison with model results. This results from the fact that the signatures of internal waves are often noisy and two-dimensional in a way which is not accounted for in the internal wave model, or they are camouflaged by superimposed signatures of fronts, atmospheric features, or surface films. While the locations of the internal solitary waves does not seem to be affected strongly by such phenomena, the modulation depth of the NRCS can be affected very much. The analysis of internal wave signatures on ERS SAR images acquired over the Strait of Messina shows that the location of the internal solitary waves can be used to infer characteristics of the interior ocean. In fact, Brandt et al. (1997) show by using the internal wave model of IfM that the distance between the first two internal solitary waves of a wave train can be related, at least qualitatively, to the depth of the thermocline. Here, we want to focus on the possibility to gain information about the interior ocean from an analysis of the measured modulation depth of the NRCS over internal waves.
For first simulation runs an ERS 2 SAR image was selected, which shows signatures of an internal wave train near the Strait of Gibraltar. The signatures are well visible and have a regular shape. A comparison of the simulated surface current field with the observed radar signatures shows reasonable agreement between the measured and simulated locations of internal solitary waves. The wind speed at the station on the sh�re at the time of acquisition of the image was specified to be 6.1 m/s with a direction towards -15° with respect to our x-axis (which denotes the direction of the current as well as the azimuthal radar look direction). Fig. 6a shows the corresponding simulated NRCS profile (marked as 'l '), together with the measured one as obtained from the ERS 2 SAR image (marked as 'ERS'). In order to
demonstrate that the simulated radar signatures depend significantly on the choice of the wind speed and direction, the figure includes also results for a wind direction rotated by 90° (line '2') and for a reduced wind speed of 3.0 mis (line '3'). In order to demonstrate the effect of the second order terms of the NRCS in the composite surface scattering model, Fig. 6b shows model results which would be obtained from a simple Bragg model without higher-order terms.
a)
b)
0.8 �---, 0.7 0.6 [/] 0.5�
0.4 -;z: 0.3 0.2 0.1 /,/
o.03'--o��---'---'---�3'=-5---'---'---'-�--'--'----'---�45 1.5 �---,�8:�1-
"I\
I
� g-�-
\
---· 3�0���� 35- ---�40��� ---'---'45
Distance From Sill (E.ast) [km]
0.8 �---, 0.7 0.6
�
0.5 i:s:::: 0.4 . ;z: 0.3 -0.2 --: •.. 0.1 E 0·03'--o-'--'--'--�3�5---'---L--'-�40�__.--"-� ___,45��n
'1\
u�J
0 370----�35-=---'--'-�""-7.40=-'-����45Distance From Sill (East) [km]
Fig. 6: Simulated surface current (bottom) and radar signatures for a scenario corresponding to an existing ERS 2 SAR image of internal waves near the Strait of Gibraltar. 'ERS' - NRCS as obtained from the ERS 2 SAR image, '1' - NRCS as obtained from the model for the nominal wind speed (6.1 m/s) and direction (-15° with respect to the x axis), '2' -NRCS as obtained from the model for a wind direction rotated by 90°, '3' -NRCS as obtained from the model for a reduced wind speed of 3.0 mis; (a) full composite surface scattering model, (b) Bragg model without higher-order terms. The azimuthal radar look direction is equal to the x-direction.
Although the simulated and measured variations of the NRCS agree quite well without any dedicated tuning, the absolute (mean) level is clearly overestimated by the model in case 'I'. This behavior is already known from other simulated ERS SAR images and may result from the relatively steep incidence angle of 23 °, which is close to the limits of models based on Bragg scattering theory. However, our results for various wind speed vectors show that the absolute NRCS as well as the modulation depth predicted by
the model depends clearly on the wind speed and direction, which is often not well known. We conclude from this that, even if we had a perfect imaging model, not only the complex structures in typical radar images but also the uncertainties of the available wind information would make it difficult to derive information on the surface currents of internal waves just from a comparison between measured and simulated modulation depths of the NRCS.
B) RADSIG
RADSIG combines WASP and SWARM and introduces a third component, MATCH. From WASP the user obtains an 'observed' signature (transect) from a desired and processed image; from S WARM the user has a data base of computed signatures made according to his/her intelligent input specification. By specifying/limiting parameters, the user enables MATCH to search the data base for the 'best fit' model that most closely resembles the observed signature. The 'inversion' process is the statement that the parameters of the observed signature are then those of the best-matched computed model. This inversion procedure has been followed based on our past experience and our knowledge of the complexity of the physics involved, e.g., internal hydrodynamics coupled with surface hydrodynamics and environmental conditions, coupled with electrodynamical backscattering from a near-random rough surface, and SAR technology. In brief, there is NO simple inversion technique and one is forced to the model-matching route. The algorithm presently intended for use in MATCH is based on matching the Fourier content of the observed signatures with the Fourier content of the computed signatures. This has the advantage that the Fourier data for the computed signatures may be computed but once and stored along side that of the 'physical' data. Preliminary studies of this physically motivated approach suggest that the method is quick, captures most of the essential information, and also restricts the number of 'matching' data base signatures to either one or a few, where the few may then be interrogated by the user. Most usefully, a user may 'customize' the feature data base so that it is representative of conditions that may be met with on a regional and seasonal basis, e.g., Straits of Gibraltar in September say.
C) Internal wave field reconstruction methodology
This part of the project is directly devoted to addressing the inverse problem of retrieving information on the water column from the manifestation of internal waves on radar images and is handled at TMS. This is a difficult inverse problem since highly non-linear transfer function are involved. More precisely, the corresponding forward problem consists in predicting radar signatures from some
parameters describing the volume of the ocean. This forward problem decomposes into three successsive ones: The first one is the prediction of the surface current associated with the internal wave. The governing parameter is the density profile, especially the picnocline deph and density contrast. Assuming some external excitation, namely the tidal wave, the transfer function is given by a propagation model for the internal wave.
The second one consists in evaluating the perturbed wave spectra for a given (straining) surface current, using weak hydrodynamic interaction theory. The first stage of the SW ARM software is dedicated to this task.
The third one is the calculation of radar backscattering cross sections for a given surface wave spectrum. This can be done with various models ranging from simple Bragg scattering to advanced composite surface model as developped by IfM (see section 5.1 and 3.5).
One can search to solve the global inverse problem "directly" using a global forward model. It seems more realistic to adress successively the above mentionned problems, or at least two distinct ones, namely the first one and the other two together . This is made possible since they are independent in the sense that the output of one problem is the input of the following one. There are some advantages to proceed in this way. It is likely to save computer time with regards to the global method and allows to keep physical insight on the different physical processes involved. On the other hand, the method presents the drawback of relaxing some constraints on the solutions. In fact this is not a drawback if the model constraining the solution is not so reliable.
This way to proceed has then been chosen for first investigation of the inverse problem.
The main characteristic/difficulty of the inverse problem associated to the first forward problem is the multiplicity of models describing internal waves propagation either linear (modes, rays) or non-linear (Korteweg-De Vries, Benjamin Ono, Joseph), some of wich only qualitatively match the experimental data. This leads to a non standardly posed inverse problem. We have focussed on non-linear waves propagating far from their generation place.
The main feature of the second forward problem is the large amount of computer time required to perform the calculation of perturbed surface wave spectra, especially when two-dimensionnal spectrum are taken into account. This precludes the use of global optimization schemes suitable for hihly non-linear inversion. At least as a first step, we limit our investigations to one dimensionnal spectra. The third forward problem, taken alone, would lead to an inverse problem that needs, to be solved, some minimization constraint.
The development of works related to the inverse problem will be an important issue of the third year of the project.
VI. CONCLUSIONS
Substancial progress have been achieved towards the MORSE objective to better understand the physical processes involved in radar signatures of oceanic internal waves:
On the experimental ground, nonlinear waves interaction experiments have been conducted and interpreted. For the refraction of internal solitary wave by a step shelf, a Snell's law is valid granted that nonlinear celerities are taken into account. In the case of long surface wave - short surface wave interaction, a phase shift of the short wave has been measured and shown to behave like predicted by an analytical model. Regarding SAR image processing, besides classical algorithms for parameters extraction, an automatic method for internal wave detection and location using wavelet transform has been successfully applied to images from two important areas for internal waves generation.
The project dedicated high resolution W-band radar has been designed, constructed and tested. First measurements show that the radar is working as expected but with an excessive mixer noise. Improvements are being finalised.
On the numerical modelling ground, an improved model for computing two-dimensional perturbed wave spectra has been developped. Once associated to a composite surface model for backcatter, it leads to the computation of radar signatures. The influence on these signatures of wind speed and direction, often badly known parameters, has been emphasised.
Three user-friendly precommercial software packages are produced during the project, version 1 of the first two being completed: WASP for extraction of wave parameters from SAR images, SWARM for radar signatures generation, and RADSIG for matching observed signatures with computed ones.
ACKNOWLEDGEMENTS
The Morse consortium gratefully acknowledges the CEC MAST Program for its support for this project under contract MAS3-CT-95-0027 (DG XII). The ENSTB group would like to thank the Centre for Remote Sensing and Processing, CRISP, National University of Singapore, for providing a WWW Catalogue Browse whence to obtain the RASARSA T SAR images from the Andaman Sea.
REFERENCES
Alpers, W., H. Wang-Chen, and L. Hock, "Observation of internal waves in the Andaman Sea", IEEE Proceedings of IGARSS'97, 2-9 August, Singapore, 1518-1520, 1997.
Brandt, P.; A. Rubino, W. Alpers, and J. 0. Backhaus, Internal waves in the Strait of Messina studied by a numerical model and synthetic aperture radar images from the ERS 1/2 satellites. Journal of Physical
Oceanography, 27. 648-663. 1997.
Griffiths, H.D., 'Synthetic aperture processing for full-deramp radar altimeters', Electronics Letters 24 (7), 371-373, 1988.
MORSE, CEC, Contract MAS3-CT95-0027. First Year Annual Report, 1997
Pinettes et al., Fluid. Dyn. Res. 16 ,217-235, 1995
R6denas, J. A., and R. Garello, "Wavelet analysis in SAR ocean image profiles for internal wave detection and wavelength estimation", IEEE Trans. On Geoscience and Remote Sensing 35 (4), 933-945, 1997. Romeiser, R., and W. Alpers, An improved composite surface model for the radar backscattering cross section of the ocean surface, 2. Model response to surface roughness variations and radar imaging of underwater bottom topography. Journal of Geophysical Research, 102, 25 251-25 267, 1997.
Romeiser, R., W. Alpers, and V. Wismann, An improved composite surface model for the radar backscattering cross section of the ocean surface, I. Theory of the model and optimization/validation by scatterometer data. Journal of Geophysical Research, 102, 25 237-25 250, 1997.