POLYTECHNIQUE MONTRÉAL
affiliée à l’Université de Montréal
Imaging cerebral oxygenation alterations in an Alzheimer
mouse model
XUECONG LU
Institut de génie biomédical
Thèse présentée en vue de l’obtention du diplôme de Philosophiæ Doctor Génie biomédical
Juin 2019
POLYTECHNIQUE MONTRÉAL
affiliée à l’Université de Montréal
Cette thèse intitulée :
Imaging cerebral oxygenation alterations in an Alzheimer
mouse model
présentée par Xuecong LU
en vue de l’obtention du diplôme de Philosophiae Doctor a été dûment acceptée par le jury d’examen constitué de :
Farida CHERIET, présidente
Frédéric LESAGE, membre et directeur de recherche Christos BOUTOPOULOS, membre
DEDICATION
ACKNOWLEDGEMENTS
First and foremost I would like to express my sincere thanks to my doctoral supervisor, Professor Frédéric Lesage, for supervising and guiding me as a Ph. D. student in his research group. His immense knowledge and expertise in my research project have contributed tremendously to the completion of this thesis. Discussion with Prof. Lesage is always enjoyable and encouraging, thanks to his kindness, patience, confidence, and profound knowledge in biomedical brain imaging. Whenever I have difficulty in formulating my ideas, conducting experiments, or article writing, Prof. Lesage would always be there to offer me valuable advice and help me solve these problems during my study. Without his support and great assistance, my research project would not be completed, and this thesis would not be finished. I owe a debt of gratitude to his sustained assistance, patient guidance, and charming personality during my study here and in the rest of my life.
I also would like to express my gratitude all staff from the Montreal Heart Institute animal facility, especially Marc-Antoine Gillis and Natacha Duquette, who were kind mentors and tought me necessary experimental skills. They also assisted me with animal preparation and experiments, thus facilitating my data collection for this thesis.
I would like to sincerely thank Dr. Philippe Pouliot who gave me great comments and advice during my study. This thesis also benefits from his in-depth knowledge in MRI imaging, and I very much appreciate Dr. Philippe Pouliot’s kind support to data collection and analysis in my projects.
I am also thankful for the coauthors of my papers: Yuankang Lu, Rafat Damseh, Mohammad Moeini, Baoqiang Li, Samuel Bélanger, Olivia de Montgolfier, Éric Thorin, Philippe Pouliot, and Sava Sakadžić, who have greatly assisted me in my doctoral study and improved the overall quality of the papers. I am grateful to know all the members at the LIOM lab at Polytechnique of Montreal: Hanieh Mohammadi, Parikshat Sirpal, Cong Zhang, Ke Peng,
Mehran Sharafi, Alexandre Castonguay, Clément Bonnéry, Michèle Desjardins, Edgar Guevara, Samuel Bélanger, Mahnoush Amiri, Maxime Abran, Joël Lefebvre, Yuankang Lu, Ghada Jerbi, Maryam Tabatabaei, Rafat Damseh, Pier-Luc Tardif, Luis Akakpo, Azadeh Naderian, Mohammad Moeini, and Baoqiang Li. It is great to know these nice people who bring fun to my study and life.
I would like to express my endless thankfulness to my family members who always support and encourage me. Whatever challenges I meet during my study, you always have confidence in me and give me constant assistance. I am gratefully that you share all my happiness and sorrow all the time with me in my study and in the rest of my life.
Finally, I would like to wholeheartedly express my appreciation and gratitude to my doctoral supervisor, Prof. Frédéric Lesage, for his enormous assistance and generous support during my doctoral study and life. His patient guidance and direction in my research projects have always sparked my interests in this field and will benefit my future research career.
RÉSUMÉ
Cette thèse a pour objectif d'explorer l'oxygénation cérébrale en exploitant un système de microscopie à deux photons combiné à un colorant phosphorescent sensible à la pression d’oxygène, le PO2. La combinaison du colorant phosphorescent au système à deux photons
permet une mesure de l’oxygène avec une excellente résolution spatiale et temporelle, facilitant la recherche de sur l’oxygénation des tissus, en particulier dans les situations pathologiques. À cette fin, la microscopie laser à deux photons a d'abord été associée au colorant phosphorescent, tandis que d'autres techniques d'imagerie, y compris l'imagerie optique de signaux intrinsèques (ISOI), l'imagerie par résonance magnétique (IRM) et la tomographie par cohérence optique ont pu fournir des informations complémentaires dans les études qui ont été faites. Nos travaux ont visé l’étude de modèles murins de la maladie d’Azheimer (AD) pour explorer les altérations de l’oxygénation cérébrale dans ces modèles. Les résultats accumulés ont fait l’objet de publications qui ont été soumises à trois revues avec comité de lecture.
Dans le premier travail, nous avons cherché à examiner 1) si l'oxygénation du cerveau est compromise par l'apparition de la maladie d'Alzheimer et 2) comment l'exercice physique volontaire module l'influence de la maladie d'Alzheimer sur l'oxygénation du cerveau. Bien que les contributions vasculaires à la démence et à la maladie d’Alzheimer soient de plus en plus reconnues, la perturbation potentielle de l'oxygénation du cerveau associée à la maladie et le fait que les stratégies de prévention visant à maintenir l'oxygénation des tissus soient bénéfiques ont des causes qui restent largement inconnues. Nos résultats montrent que la pression partielle d’oxygène du tissu cérébral (PO2) a diminué avec l'apparition de la maladie
d'Alzheimer. Cette réduction de la PO2 était associée à la présence de petites zones spatiales
presque hypoxiques, à une fraction accrue d'extraction d'oxygène et à une réduction du débit sanguin, observations qui ont toutes été annulées par l'exercice. L'Alzheimer et l'âge ont également accru l'hétérogénéité spatiale de l'oxygénation du tissu cérébral, qui fut par ailleurs
normalisée par l'exercice. Une coloration ex vivo du tissu cérébral a également montré moins de dépôts d'amyloïde-β (Aβ) dans le groupe d'exercice. Enfin, nous avons observé des corrélations entre la distance de course volontaire et l'oxygénation des tissus cérébraux / le flux sanguin, suggérant une relation dose-réponse de l'exercice sur le cerveau.
Le deuxième article avait pour objectif de caractériser, dans une seconde cohorte de souris, les modifications de l'hémodynamique capillaire avec l’Alzheimer et le rôle modulateur de l’exercice, étant donné le rôle fondamental des capillaires dans le transport de l'oxygène vers les tissus et les bénéfices proposés de l’exercices pour la maladie d’Alzheimer. Nous avons constaté des altérations hémodynamiques et une densité vasculaire plus faible chez la souris Alzheimer, inversées par l'exercice. Nous avons en outre observé que les propriétés des capillaires étaient dépendantes de l'ordre des branches et que la stimulation évoquait des changements atténués par l’Alzheimer mais augmentés par l'exercice. Notre étude fournit de nouvelles informations sur les perturbations de la microcirculation cérébrale avec la maladie et sur le rôle modulateur de l'exercice volontaire sur ces altérations.
Le dernier article avait pour objectif d’explorer les modifications de l’oxygénation des tissus évoquées par un stimulus dans le même modèle animal, et d’explorer plus avant les facteurs modulateurs, notamment l’exercice et l’hypertension, responsables de ces modifications. La microscopie à deux photons in vivo a été utilisée pour étudier les modifications locales de l'oxygénation du tissu cérébral avec la maladie et sa modulation par l'exercice et l'hypertension chez la souris transgénique suivant une stimulation des moustaches. Nous avons observé une décroissance plus rapide de la PO2 tissulaire entourant les artérioles et une plus grande
hétérogénéité de la PO2 dans le groupe de pathologies doubles (AD et hypertension). Nos
résultats ont également montré une valeur de base inférieure de la PO2 dans le groupe AD,
exacerbée par l'hypertension artérielle alors qu'elle était inversée par l’exercice.
Globalement, ces études suggèrent que l’oxygénation cérébrale compromise est un indicateur de l’apparition de l’Alzheimer, avec l’apparition de mécanismes délétères potentiels associés à l’hypoxie. L'exercice volontaire a amélioré le processus d'oxygénation neurovasculaire, offrant
potentiellement un moyen de retarder ces changements dans la maladie, alors que des maladies vasculaires telles que l'hypertension pourraient exacerber la perturbation de l'oxygénation.
ABSTRACT
This thesis aims to explore the cerebral oxygenation by eploiting two photon microscopywith a phosphorescence PO2 sensitive dye. Combining the phosphorescence dye to the two-photon
system enables better spatial and temporal resolution compared to other oxygen measurement methods (e.g., mass spectroscopy and polarography), facilitating the investigation of oxygenation in tissues especially in pathological situations. Toward this end, two-photon laser microscopy was combined with the phosphorescence dye first, while other imaging techniques, including intrinsic signal optical imaging (ISOI), magnetic resonance imaging (MRI), and optical coherence tomography (OCT) were also used to provide complementary information (e.g., changes of oxygenated hemoglobin, blood perfusion, and blood flow). All imaging methods were used to investigate a mouse model of Azheimer’s disease (AD) to explore the oxygenation alterations in the brain. Results from these studies have been submitted to three peer-reviewed journals.
In the first endeavor, we aimed to examine 1) whether brain oxygenation is compromised by the onset of AD and 2) how voluntary exercise modulates the influence of AD on brain oxygenation. While vascular contributions to dementia and AD are increasingly recognized, the potential brain oxygenation disruption associated with AD and whether preventive strategies to maintain tissue oxygenation are beneficial remain largely unknown. Our results show that cerebral tissue oxygen partial pressure (PO2) decreased with the onset of AD. Reduced PO2 was associated with the presence of small near-hypoxic areas, an increased oxygen extraction fraction, and reduced blood flow. The observations were all reverted by exercise. AD and age also increased the spatial heterogeneity of brain tissue oxygenation, which was homogenized by exercise. Immunohistological staining also showed fewer amyloid-β (Aβ) deposits in the exercise group. Finally, we observed correlations between voluntary running distance and cerebral tissue oxygenation/blood flow, suggesting a dose-response relationship of exercise on the brain.
The second article aimed to characterize the changes in capillary hemodynamics with AD and the modulating role of exercise, given the fundamental role of capillaries in the oxygen transport to tissue and the propoosed benefits of exercise to AD. We found hemodynamic alterations and lower vascular density with AD, reversed by exercise. We further observed that capillary properties were branch order dependent and that stimulation evoked changes were attenuated with AD but increased by exercise. Our study provides novel insights into cerebral microcirculatory disturbances with AD and the modulating role of voluntary exercise on these alterations.
The last paper aimed to explore the stimulus-evoked tissue oxygenation changes in the model of AD and further explore modulating factors, including exercise and hypertension, for these changes. In vivo two-photon phosphorescence lifetime microscopy was used to investigate local changes of brain tissue oxygenation with AD and its modulation by exercise and hypertension in the transgenic AD mice under whisker stimulation. We observed faster decay of tissue PO2 surrounding arterioles and more PO2 heterogeneity in the group of dual
pathology (both AD and hypertension). Our results also showed lower baseline tissue PO2 value in the AD group, exacerbated by hypertension but reversed by exercise.
Overall, this these studies suggest that compromised brain oxygenation is an indicator of the onset of AD, with the emergence of potential deleterious mechanisms associated with hypoxia. Voluntary exercise enhanced the neurovascular oxygenation process, potentially offering a means to delay these changes in AD, whereas vascular disease such as hypertension could exacerbate the oxygenation disruption in AD.
TABLE OF CONTENTS
DEDICATION ... iii ACKNOWLEDGEMENTS ... iv RÉSUMÉ ... vi ABSTRACT ... ix TABLE OF CONTENTS ... xi LIST OF TABLES ... xvLIST OF FIGURES ... xvi
LIST OF SYMBOLS AND ABBREVIATIONS ... xxiii
CHAPTER 1 INTRODUCTION ... 1
1.1 Overview ... 1
1.2 Organization of the thesis by objectives ... 2
CHAPTER 2 LITERATURE REVIEW ... 6
2.1 Alzheimer’s pathology ... 6
2.2 Neurovascular coupling dysfunction in AD ... 7
2.2.1 Neurovascular coupling ... 7
2.2.2 Neurovascular uncoupling in AD ... 9
2.3 Compromised cerebral tissue oxygenation ...12
2.3.1 Mechanisms of oxygen supply ...12
2.3.2 Compromised CBF and cerebral tissue oxygenation with AD ...13
CHAPTER 3 METHODOLOGY REVIEW FOR PO2 MEASUREMENTS ... 16
3.1 Mass spectroscopy ...16
3.2 Polarography ...18
3.3 Electron Parametric Resonance (EPR) oximetry ...19
3.4 Two-photon phosphorescence optical method ...22
3.4.1 Oxygen-dependent quenching of phosphorescence ...22
3.4.2 Two-photon enhanced phosphorescent probe...24
3.4.3 Advantages of two-photon phosphorescence imaging ...27 CHAPTER 4 ARTICLE 1: VOLUNTARY EXERCISE INCREASES BRAIN TISSUE OXYGENATION AND SPATIALLY HOMOGENIZES OXYGEN DELIVERY IN A MOUSE MODEL OF ALZHEIMER’S
DISEASE ... 29
4.1 Abstract ...29
4.2 Key words ...30
4.3 Introduction ...31
4.4 Methods ...33
4.4.1 Function and property of the PtP-C343 probe...33
4.4.2 Experimental groups. ...33
4.4.3 Experimental preparation. ...34
4.4.4 Two-photon imaging. ...35
4.4.5 OCT setup. ...35
4.4.6 Blood flow quantification with OCT. ...36
4.4.7 Cerebral tissue PO2 measures. ...37
4.4.8 Thioflavin-S staining. ...38
4.5 Results ...38
4.5.1 Cerebral tissue PO2 decreased with AD and was modulated by exercise ...39
4.5.2 Brain tissue hypoxic potential was increased with AD and reduced by exercise ...43
4.5.3 AD was associated with lower oxygen input and higher oxygen extraction fraction, reversed by exercise. ...44
4.5.4 Changes in non-capillary blood flow with AD and exercise ...46
4.5.5 Running distance correlates with brain oxygenation and blood flow ...49
4.6 Discussion ...50
4.6.1 Hypoxic micro-pockets and AD ...52
4.6.2 The link between voluntary exercise and Aβ protein in AD ...52
4.6.3 The dose-response relationship between running distance and cerebral tissue oxygenation/blood flow ...53
4.6.4 Awake imaging of cerebral oxygenation ...53
4.7 Conclusion ...54
4.8 Acknowledgement...54
4.9 References ...55
4.10 Suplements ...63
CHAPTER 5 ARTICLE 2: CHANGES IN CAPILLARY HEMODYNAMICS AND ITS MODULATION BY EXERCISE IN THE APP-PS1 ALZHEIMER MOUSE MODEL ... 64
5.1 Abstract ...65 5.2 Keywords ...66 5.3 Introduction ...67 5.4 Methods ...68 5.4.1 Animal groups ...68 5.4.2 Two-photon imaging ...69
5.4.4 Magnetic resonance imaging (MRI) ...71
5.4.5 Intrinsic signal optical imaging (ISOI) ...72
5.5 Results ...72
5.5.1 Capillary RBC flow is altered by AD and modulated by exercise ...72
5.5.2 Capillary RBC properties are branch order dependent. ...74
5.5.3 High temporal fluctuations of capillary RBC velocity and flux were more frequent with AD. ...77
5.5.4 Higher vascular density peak value and lower average vascular density in the AD group. .78 5.5.5 AD reduced brain perfusion and task-related changes, with the latter modulated by exercise ...80
5.6 Discussion ...81
5.6.1 Capillary flow property changes to AD and exercise ...82
5.6.2 Vascular morphology alterations in AD ...83
5.6.3 Reduced cerebral perfusion and functional responses in AD ...84
5.7 Conclusion ...85
5.8 Acknowledgments ...86
5.9 References ...86
CHAPTER 6 ARTICLE 3: HYPERTENSION ACCELERATES CEREBRAL TISSUE PO2 DISRUPTION IN ALZHEIMER’S DISEASE ... 94 6.1 Abstract ...95 6.2 Keywords ...96 6.3 Introduction ...97 6.4 Methods ...98 6.4.1 Animal preparation ...98 6.4.2 Awake imaging ...99 6.4.3 Whisker stimulation ...100 6.4.4 PtP-C343 probe ...100
6.4.5 Two-photon phosphorescence lifetime imaging of tissue PO2 response to stimulation ..100
6.4.6 Statistical analysis ...101
6.5 Results ...101
6.5.1 Hypertension leads to faster PO2 decay from arterioles with distance ...101
6.5.2 The temporal tissue PO2 response to stimulation had a larger undershoot in AD ...104
6.6 Discussion ...106
6.7 Conclusion ...107
6.8 Acknowledgement...108
6.9 References ...109
CHAPTER 7 GENERAL DISCUSSION ... 114
7.1 Objective 1 ...114
7.3 Objective 3 ...116
7.4 Limitations and future studies ...116
CHAPTER 8 CONCLUSION... 119
LIST OF TABLES
LIST OF FIGURES
Figure 2-1 Representation of microvascular unit showing vascular and cellular elements
regulating CBF (Kisler et al., 2017a). ... 9
Figure 2-2 Neurovascular uncoupling in AD: two hit mechanism (Kisler et al., 2017a)... 11
Figure 3-1 Design of Teflon membrane and cannula. ... 16
Figure 3-2. A sample design of spectrometer (Reusch, 2013). ... 17
Figure 3-3 An explanation of the Clark sensor (YSI, 2009). ... 19
Figure 3-4. The calibration curve based on linewidth as a function of the PO2 (Adapted from the review (Gallez et al., 2004))... 20
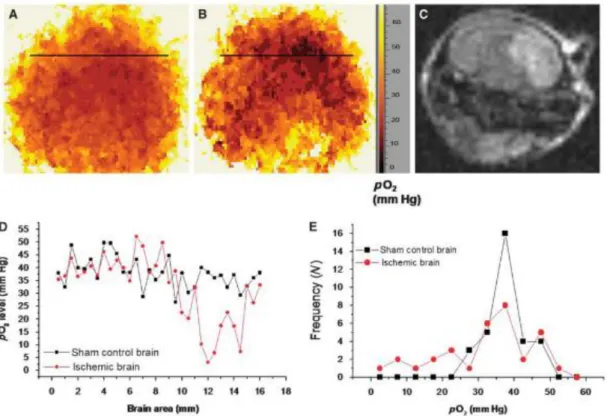
Figure 3-5 PO2 distribution in ischemic mouse brain recorded by EPR 2D spectral-spatial linewidth imaging (Shen et al., 2009). A) PO2 map in the sham control mouse head, B), PO2 map in the same mouse after ischemia, C) MR diffusion image in the mouse after ischemia. D) Representative spatial profiles of PO2 in both groups. The PO2 values were recorded along the black lines in A and B. E) Frequency of PO2 values in the sham control head and the ischemic head... 21
Figure 3-6. Perrin-Jablonski diagram (Quaranta et al., 2012). ... 23
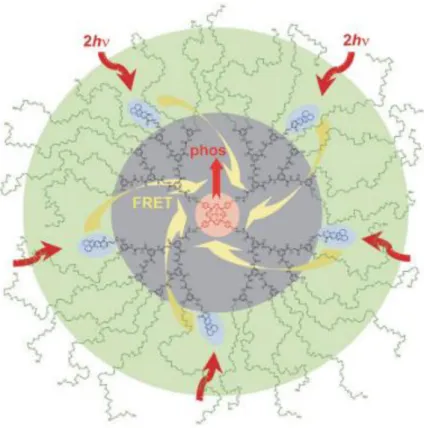
Figure 3-7. An example of calibration plot of PtP-C343 for conversion of phosphorescence lifetimes into PO2 values with the system and environment specified (Adapted from the supplementary materials of (Sakadži et al., 2010)). ... 24 Figure 3-8. Two-photon enhanced oxygen probe PTP-C343 that consists of the Pt
meso-tetraarylporphyrin core (PtP, in pink), the coumarin-343 units (C343, in blue), the peripheral oligoethyleneglycol residues (POR, in green), and the polyarylglycine dendrimer (PD, in black). The C343 is excited as the antenna through the two-photon absorption and then transmits the energy to the PtP core (in pink) through Fluorescent resonance energy transfer (FRET). After receiving energy from the C343, the core emits phosphorescent photons (Finikova et al.,
2008). ... 26 Figure 3-9. The quenching parameters (𝐾𝑄, 𝜏0) obtained at different temperatures (Zhang,
Cong et al., 2015). The probe was dissolved in solution with pH 7.23. ... 27 Figure 4-1. Two-photon system setup and measurements. (a) A schematic diagram of
fluorescent and phosphorescent two-channel two-photon system. (b) Imaging was performed in the animals’ cranial window under awake conditions. The mice could walk freely using a custom-built treadmill wheel with their head restrained by a titanium bar. The scale bar is 1 mm. (c) An example of tissue PO2 grid
measurements over a 200*200 μm region were obtained by phosphorescence lifetime microscopy, exhibiting clear tissue PO2 gradient around penetrating
arterioles. The color bar shows the PO2 values in mmHg. The scale bar is 100 μm.
(d) En face maximum intensity projection of six adjacent three-dimensional (3D) fluorescent angiograms through the depth of 50-350μm. The scale bar is 200 μm. (e) Examples of cerebral vascular morphology and tissue PO2 grid measurements at
different depths. Multiple planes were considered to build up a 3D PO2 map. Top
views of the two stacks show diving arterioles with positions marked with red dots lines. The scale bar is 100 μm. . ... 39 Figure 4-2. An example of vascular angiogram with arterioles (A, red) and venules (V, blue).
The scale bar is 100 μm. (b) Left: the PO2 grid measurement for the area in the red
frame; Right: contour plot for the left image. The scale bar is 50 μm. (c) The variation of average tissue PO2 with distance from the vessel wall in different
experimental groups. (d) Average tissue PO2 in different experimental groups (WT3:
n=20391, AD3: n=18038, WT6: n=26124, AD6: n=22171, AD6&EX: n=22272 sampled points). The box represents interquartile range, the central line indicates the median and the whiskers extend to the most extreme data points; the outliers are plotted individually using the '+' symbol. Statistical significance was computed using ANOVA followed by Tukey HSD post hoc tests, comparisons to AD6 shown.
***: p < 0.001. The principle of box plot and significance level also apply to figures in the rest of the paper. (e) Heterogeneity of tissue PO2 in all experimental
groups (calculated as standard deviation of PO2/mean) (WT3: n=20391, AD3:
n=18038, WT6: n=26124, AD6: n=22171, AD6&EX: n=22272 sampled points). ... 41 Figure 4-3. (a) Staining of Aβ plaques in the cortex area in mice groups of AD3, AD6,
and AD6&EX with magnified images in solid white frames representing the left and right parts of the areas in white dashed frames in three different groups. The scale bar is 5 mm. (b) Box plot of Aβ plaques in the cortex, quantified by the total number of Aβ plaques divided by the area of imaging (mm2). Aβ increased with age but
decreased with exercise in the AD groups (AD3: n = 17, AD6: n = 17; AD6&EX: n = 22 sampled slices). ... 42 Figure 4-4. Near-hypoxic domains in the AD6 group and the modulation of voluntary
exercise. (a) (Right) Two representative near-hypoxic domains observed in the AD6 group (marked with red dots lines). The scale bar is 100 μm. (Left) The corresponding PO2 3D grid measurement over a 200* 200 μm region at two
different depths (120 μm and 220 μm) and the zoomed near-hypoxic domains (marked with yellow dots lines). The scale bar is 50 μm. (b) Frequency of PO2 value
distribution for each group. (c) Frequency of PO2 values lower than 10 mmHg in
each group. The proportion of near-hypoxic points increased sharply with AD. (d) Frequency of PO2 values lower than 15 mmHg in each group. ... 44
Figure 4-5. Oxygen supply and consumption in different groups. (a) Arterioles wall PO2
(WT3: n= 30, AD3: n= 26, WT6: n= 36, AD6: n = 32, AD6&EX, n = 40 vessels) in each group. (b) Venules wall PO2 (WT3, n= 30; AD3, n= 26; WT6, n= 36; AD6, n =
32; AD6&EX, n = 40 vessels) in each group. Wall PO2 were calculated by the
average of PO2 values within a distance of 10 μm from the arteriole or venule wall.
averaged arteriolar and venular SO2 values, which were converted from vascular
wall PO2 values using Hill’s equation. ... 46
Figure 4-6. Non-capillary blood flow. (a) En face maximum intensity projection of a 3D OCT velocity volume at the depth of 50-100 μm. The top 50 μm volumes were removed to exclude the surface vessels. Positive velocity (red) represents arterioles and negative velocity (blue) represents venules. (b) For each animal, total cerebral blood flows were averaged through the depth of 50-100 μm to obtain the mean total flow near the cortical surface, as an estimate of regional CBF (WT3:n=11, AD3: n=11, WT6: n=11, AD6: n=11, AD6&EX: n=11 c-scan volumes). ... 48 Figure 4-7. Tissue oxygenation and their relationships with running distance. (a, b, c) Strong
correlations between running distance and near arterioles/near venules/capillary bed PO2 values in the AD6&EX group (n=7 mice). The running distance was averaged
over 90 days. (d) Spatial heterogeneity of PO2 in the capillary bed was negatively
associated with the running distance in the AD6&EX group. (e) and (f) show the correlation between the mean flow and the running distance for arterioles and venules, respectively (n=7 mice). ... 50 Figure 4-8. Tissue PO2 in different regions. ... 63 Figure 5-1. Capillary RBC flow characteristics in different groups. (a) Capillary
diameter, RBC velocity, flux and hematocrit in different experimental groups (460, 508, and 562 capillaries measured in the AD6, AD6&EX and WT6 groups, respectively). (b) Coefficient of variation (CV) shown for all capillary parameters (460, 508, and 562 capillaries measured in the AD6, AD6&EX and WT6 groups, respectively). The CV in each capillary was computed based on multiple frames recorded each 0.25s within a 5-second time window. Thus CV represents the temporal variations of each property within a capillary. CV was computed by standard deviation devided by mean. Statistical significance was computed using ANOVA followed by Tukey HSD post hoc test. + : p< 0.1, *: p < 0.05, **: p < 0.01,
***, p < 0.001. Data are expressed as mean ± s.e.m. . This significance level also applies for the figures below. ... 74 Figure 5-2. Capillary property changes with branching orders. (a) Left : a maximum
intensity projection image of the angiogram; Second from the left: an en face slice at the depth of ~100 µm. The red square indicates the area used to calculate branching orders from arterioles, and the blue square indicates the area used to calculate branching orders from venules. Third from left: the enlarged artery region with diving arteriole, precapillary arteriole, and capillaries labelled with branching orders. Fourth from left : the enlarged vein region with surfacing venule and postcapillary venule, labelled with the branching orders. (b) The changes of capillary diameter/velocity/flux/hematocrit as a function of branching order (460, 508, and 562 capillaries measured in the AD6, AD6&EX and WT6 groups, respectively). (c) diameter/velocity/flux/hematocrit differences among the first three branching orders in different groups (460, 508, and 562 capillaries measured in the AD6, AD6&EX and WT6 groups, respectively). ... 76 Figure 5-3. High temporal capillary fluctuations of RBC velocity and RBC flux. (a)
Imaging snapshots of the RBC trajectory showing high fluctuations of RBC flux in a capillary with 0.25 second as interval during a 5-second recording window. The flux was calculated based on the average value of flux from longitudinal and perpendicular scans. (b) Longitudinal equivalent, RBC velocity was calculated from the angle of dark streaks in a specific frame of recording. (c) The percentage of capillaries with high temporal fluctuations of RBC velocity in all groups. The “isoutlier” method in MATLAB was applied to detect outliers with a standard deviation of RBC velocity exceeding three standard deviations from the mean. (d) Same for RBC flux... 78 Figure 5-4. Vascular distribution in different experimental groups and different depths.
density. Left: MIP image with depths ranging from 100 to 550 µm under the brain surface with 5 µm steps. Right: an example of a binary segmentation of a single en face slice after removing the large horizontal vessels at the depth of 120 um (scale bar : 100 µm). (b) Average vascular density in different experimental groups as a function of depth from 100 to 550 µm under brain surface (14 angiograms in each group). (c) Estimated vascular density (volume%). Results are presented as box plot with the median value (red line). ... 79 Figure 5-5. (a-b). MRI scans with coronal and axial views of the cortex. (c)
Quantification of cerebral perfusion (ml/g/min) by MRI. (d) Averaged temporal response of oxy-hemoglobin (HBO) for all groups with 5-second stimulation (blue background). (e) Temporal dynamics of total hemoglobin (HBT) response to whisker stimulation. Stimulation lasted for 5 seconds, followed with 15-second rest. (f) Averaged results for change of HBO (Δ[HBO](t)) and change of HBR (Δ[HBR](t)) over all mice (28, 24, 30 stimulation curves for the AD6, the AD6&EX, and the WT6, respectively). ... 81 Figure 6-1. Tissue PO2 decay from arterioles was measured during rest and stimulation (0
– 5 second) for all groups: WT6: wild-type (n=12 arterioles), WTH6: hypertensive WT (n=14 arterioles), AD6: APP-PS1 (n=16 arterioles), ADH6: APP-PS1 with hypertension (n=17 arterioles), ADE6: APP-PS1 with exercise (n=17 arterioles). a) Left panel: an example of the brain area (the yellow circle) where tissue PO2 was
measured. Middle panel: corresponding zoomed vasculature image of the area. Right panel: an example of line point measurements from an arteriole (up to 100 μm from the arteriole). The color of the points denotes different levels of tissue PO2. b)
Arteriole wall PO2 at rest for each group, estimated by points located within 10 μm
from the arterioles during the rest period. c) Tissue PO2 decay vs distance (20-90
μm) normalized to wall-PO2. d) PO2 decay during rest, estimated as (tissue PO2 with
PO2 between stimulation and rest as a function of distance (20-90 μm) from arterioles.
... 103 Figure 6-2. Tissue PO2 response to stimulation for all groups. a) An example of a single
time course of PO2 change during stimulation. The blue area represents the 5-second
stimulation window. b) The time course of averaged tissue PO2 for each
experimental group. c) The time course of Δ PO2 (PO2 – baseline PO2)for each
group. d) Stimulation response magnitude for all groups, estimated as average response through 0-5 second from the stimulation onset. e) Absolute value of the post-stimulation dynamics estimated by points located 10-25 second from the stimulation onset. ... 105
LIST OF SYMBOLS AND ABBREVIATIONS
AD Alzheimer’s disease
MRI Magnetic resonance imaging IOSI Intrinsic optical signal imaging OCT Optical Coherence Tomography RBC Red blood cells
CBF Cerebral blood flow VSMC Vascular smooth muscle cell BBB Blood brain barrier
PO2 Partial pressure of oxygen
Δ[HBO](t) Changes in oxy-hemoglobin concentration Δ[HBR](t) Changes in deoxy-hemoglobin concentration Δ[HBT](t) Changes in total hemoglobin concentration Aβ Beta-amyloid
EPR Electron parametric resonance
CHAPTER 1 INTRODUCTION
1.1 Overview
Alzheimer’s disease (AD) is a chronic neurodegenerative disease whose symptoms slowly occur and gradually worsen over time (Gaugler et al., 2018). According to a recent report (“Latest information and statistics,” 2018), half a million Canadians live with AD-related dementia, and this number is expected to get doubled in the next ten years. Since AD brings significant burden to patients, their family members and caregivers, and the national health care system, understanding the mechanism of AD progression and potential treatment to delay or even cure AD patients is of great interest to healthcare practitioners and researchers. From a neurovascular perspective, AD can cause cerebral hypoperfusion and cerebrovascular disorders, which, in turn, impair normal neuron functioning and cognitive function (Grammas, 2011; Iadecola, 2017, 2010a, 2004; Sweeney et al., 2011). The reduced supply of oxygen to brain tissue may not support the metabolic and oxidative demand of neuron cells, leading to cognitive malfunction. Beyond deleterious consequences on cognition (Iadecola, 2010a), AD has been associated with changes in brain vascular characteristics including thickening of endothelial basement membranes, variable capillary diameters and reduced capillary density, and pericyte loss. In addition, cerebral blood flow (CBF) may become uncoupled with the underlying tissue metabolic needs, leading to homeostatic imbalance and brain dysfunction (Devor et al., 2011). Since oxygen supply is essential for normal functioning of the brain and CBF needs to be finely regulated to meet neural metabolic demand, cerebral oxygenation represents an important marker of healthy versus unhealthy aging. Therefore, alterations of brain tissue oxygenation can indicate the functioning of brain and shed light on the mechanisms of neurovascular diseases from the perspective of oxidative metabolism.
Combining a novel two-photon enhanced phosphorescent dye, PtP-C343, to the two-photon laser system enables better spatial and temporal resolution reaching depths of hundreds of
micrometers under the brain surface, facilitating the investigation of oxygenation in tissues especially in pathological situations. Therefore, two-photon laser microscopy was combined with the phosphorescence dye to quantify the cerebral oxygenation in neurovascular diseases, while other imaging techniques, including intrinsic signal optical imaging (ISOI), magnetic resonance imaging (MRI), and optical coherence tomography (OCT), were also used to provide complementary measurements.
1.2 Organization of the thesis by objectives
There are three objectives in this thesis, and each objective is associated with an article and relevant hypotheses.
Objective 1: Monitor the changes of brain tissue oxygenation in a mouse model of AD (APP-PS1) and explore the modulating effect of voluntary exercise on oxygenation.
Hypothesis 1-1: Brain tissue oxygenation is compromised by the onset of AD, expressed by attenuated tissue PO2, the presence of hypoxia, and heterogeneity of tissue PO2.
Hypothesis 1-2: Exercise modulates tissue oxygenation alterations in AD, thus alleviating oxidative stress.
Article 1: Lu X, Moeini M, Li B, de Montgolfier O, Lu Y, Bélanger S, Thorin E, Lesage F, Voluntary exercise increases brain tissue oxygenation and spatially homogenizes oxygen delivery in a mouse model of Alzheimer's Disease. Neurobiology of Aging, (Provisional acceptance).
Objective 2: Quantify the changes in capillary red-blood-cell (RBC) dynamics with AD and the modulation of exercise on cerebral capillaries to explore microvascular alterations in AD. Hypothesis 2-1: Capillary hemodynamic changes are associated with the presence of AD, expressed through capillary diameter, RBC flux, velocity, hematocrit variations, and the overall RBC flow.
dynamics.
Article 2: Lu X, Moeini M, Li B, Lu Y, Damseh R, Pouliot P, Thorin E, Lesage F, Changes in capillary hemodynamics and its modulation by exercise in the APP-PS1 Alzheimer mouse model. Frontiers in Neuroscience (First-round review).
Objective 3: Investigate the stimulus-evoked tissue oxygenation changes in a model of AD and further explore the modulating factors, including exercise and hypertension, for these changes.
Hypothesis 3-1: The stimulus-evoked tissue oxygenation changes differ between AD mice and control mice.
Hypothesis 3-2: Hypertension has modulating effects on the stimulus-evoked tissue oxygenation changes in AD.
Article 3: Lu X, Moeini M, Li B, Thorin E, Lesage F, Hypertension accelerates cerebral tissue PO2 disruption in Alzheimer’s disease during stimulation. Neuroscience Letters, Under review.
Beyond the above three peer-reviewed articles, my word directly, or through collaborations, led to other conference papers and co-authored journal articles published during the doctoral study. These publications resulted from my implication in performing experiments using two-photon microscopy or cerebral tissue oxygenation and are listed below for reference.
Moeini M, Lu X, Bélanger S, Picard F, Boas D, Kakkar A, Lesage F. Cerebral tissue pO2 response to stimulation is preserved with age in awake mice. Neuroscience letters. 2019, 699 (160-166).
Moeini M, Lu X, Avti PK, Damseh R, Bélanger S, Picard F, Boas D, Kakkar A, Lesage F. Compromised microvascular oxygen delivery increases brain tissue vulnerability with age. Scientific reports. 2018 May 29;8(1):8219.
tissue oxygenation is modulated by voluntary exercise in AD awake mice. Brain & Brain Pet 2019 Conference, July 2019, Japan.
Lu X, Moeini M, Li B, Lu Y, Damseh R, Pouliot P, Thorin E, Lesage F, Effect of exercise on capillary red blood cell dynamics in transgenic AD mice. Brain & Brain Pet 2019 Conference, July 2019, Japan.
Lu X, Moeini M, Li B, Zhang C, Sakadžić S, Lesage F. 3D brain oxygenation measurements in awake hypertensive mice using two photon phosphorescence lifetime imaging. InMultiphoton Microscopy in the Biomedical Sciences XVIII 2018 Feb 23 (Vol. 10498, p. 104981Y). International Society for Optics and Photonics. Lu X, Moeini M, Li B, Sakadžić S, Lesage F. Voluntary exercise confers protection
against age-related deficits in brain oxygenation in awake mice model of Alzheimer’s disease. InNeural Imaging and Sensing 2018 2018 Feb 12 (Vol. 10481, p. 104811G). International Society for Optics and Photonics.
Zhang C, Tabatabaei M, Bélanger S, Girouard H, Moeini M, Lu X, Lesage F. In vivo measurement of astrocytic endfoot Ca 2+ and parenchymal vessel responses during 4-AP induced epilepsy using two-photon fluorescence lifetime microscopy. InMultiphoton Microscopy in the Biomedical Sciences XVIII 2018 Feb 23 (Vol. 10498, p. 104980X). International Society for Optics and Photonics.
Zhang C, Tabatabaei M, Bélanger S, Girouard H, Moeini M, Lu X, Lesage F. Astrocytic endfoot Ca2+ correlates with parenchymal vessel responses during 4-AP induced epilepsy: An in vivo two-photon lifetime microscopy study. Journal of Cerebral Blood Flow & Metabolism. 2017 Feb;39(2):260-71.
Moeini M, Lu X, Tam T, Bélanger S, Kakkar A, Lesage F. Brain tissue oxygenation changes with age in awake mice. Cerebral Blood Flow and Metabolism. 37(57), 2017. Lu X, Li B, Moeini M, Lesage F. Simultaneous two-photon imaging of cerebral oxygenation and capillary blood flow in atherosclerotic mice. InNeural Imaging and Sensing 2017 Feb 8 (Vol. 10051, p. 100510O). International Society for Optics and
Photonics.
This thesis is structured as follows. The second chapter provides a literature review of brain function changes in pathology and the mechanisms by which such changes occur. The third chapter reviews various methods that can be sued to quantify brain oxygenation and elucidate the principles of the methods used in our studies and their advantages. The fourth, fifth, and sixth chapters present the articles submitted to peer-reviewed journals. The seventh chapter discusses these studies in general in the context of the objectives set, and the last chapter provides a brief conclusion over these studies.
CHAPTER 2 LITERATURE REVIEW
2.1 Alzheimer’s pathology
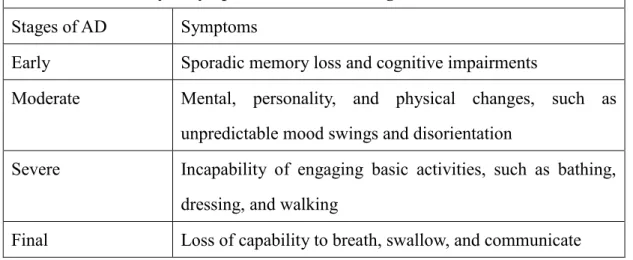
AD is characterized as a neurodegenerative disease and can lead to dementia whose symptoms include difficulties with memory, language, and other cognitive abilities for everyday activities (Gaugler et al., 2018). AD begins years before the dementia occurs, and people with AD experience various symptoms over different stages. In the early stage of AD, memory loss and cognitive impairments are sporadic, but becomes increasingly noticeable. However, most people are still capable to function independently. In the moderate stage, individuals experience more mental, personality, and physical changes, such as unpredictable mood swings and disorientation. In the severe stage, individuals depend on caregivers for basic activities of daily life, such as bathing, walking, and dressing. Eventually, their capacity to breathe, swallow, and verbally communicate is deteriorated, and AD is fatal in the final stage. Table 2.1-1 gives a summary of symptoms in different stages of AD. Currently, no effective treatment for AD exists, and much is yet to be explored about the early diagnosis of AD, and how AD could be treated or delayed for its progression (Gaugler et al., 2018).
Table 2-1. Summary of symptoms in different stages of AD.
Stages of AD Symptoms
Early Sporadic memory loss and cognitive impairments
Moderate Mental, personality, and physical changes, such as unpredictable mood swings and disorientation
Severe Incapability of engaging basic activities, such as bathing, dressing, and walking
AD leads to progressive cognitive decline and irreversible damage to brain (Bero et al., 2012; Wang et al., 2012). A healthy adult brain has around 100 billion neurons to transmit signals through the brain’s neuronal network (Gaugler et al., 2018). However, toxic molecules accumulate in AD brains: beta-amyloid plaques deposit outside neurons cells and abnormal proteins tau accumulate inside neurons in the cortical area (Mueggler et al., 2003), an energetically demanding component of the brain for advanced cognitive functioning (Sakadžić et al., 2014). Beta-amyloid plaques interfere with the neuronal communication, whereas abnormal tau proteins block the transportation of nutrients inside neurons (Gaugler et al., 2018), thus leading to neuronal injury and neurodegeneration.
Besides toxic molecules deposited in the cortex of the brain, cerebral blood flow (CBF), through which oxygen and glucose are delivered to neurons, is also found to be disrupted in the early stages of AD (Kisler et al., 2017a; Zlokovic, 2011). The blood flow changes may develop independently of those toxic molecules and precede neuronal dysfunction in AD that develops later (Kisler et al., 2017a), and thus CBF could serve as an early biomarker for AD. .Compromised CBF leads to disrupted supply to neuronal cells and limited clearance of toxic molecules deposited in the brain (Zlokovic, 2011). In the next section, CBF regulation and neurovascular dysfunction in AD is further discussed.
2.2 Neurovascular coupling dysfunction in AD
2.2.1 Neurovascular coupling
The tight interactions between neuronal activity and CBF control is characterized as neurovascular coupling (Iadecola, 2004; Kisler et al., 2017a). Under physiological conditions, the neurovascular coupling enables efficient supply of CBF to functioning brain areas and diffusion of nutrients and oxygen to neuronal cells distant from sourcing vessels (Iadecola, 2004). CBF is regulated by a coordinated vascular network from artery to vein. Within this vascular network, the cerebral arterioles and capillaries ensure supply of oxygen, glucose and
other nutrients to brain cells, while the venous network facilitates the clearance of waste from the tissue.
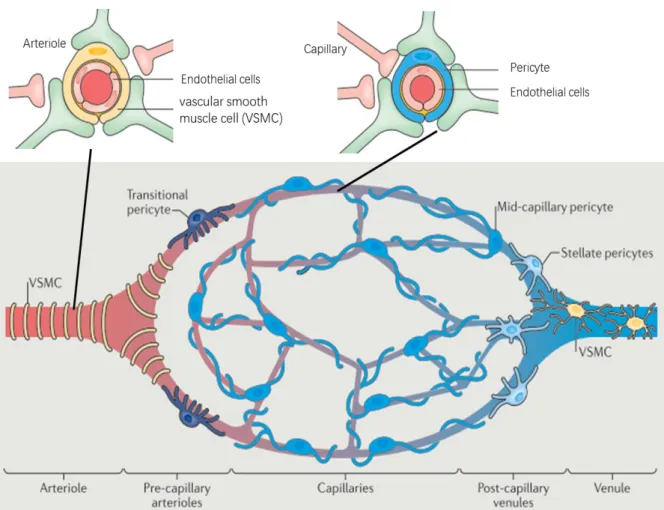
Figure 2-1 provides a representation of microvascular unit with cellular and vascular elements that regulate CBF. The arteriole consists of the endothelial cells and the vascular smooth muscle cell (VSMC). The capillary consists of the pericyte and the endothelial cells. The endothelial cells make up the inner layer of the vessel walls, layers of VSMCs ring the arteriole, and the pericyte is attached to capillaries. Neurons innervate VSMCs and pericytes to adjust the dilation of arterioles or capillaries for CBF regulation. There are different types of pericytes depending on their position in the vascular network: transitional pericytes, mid-capillary pericytes, and stellate pericytes. The capillaries branch off the arteriole, and can be labelled by their branching orders (Rungta et al., 2018), such as up-stream capillaries which directly derives from the arterioles and down-stream capillaries which transmit blood to venules. It is critical to label these different vascular compartments, as they may differ in the timing of their dilation during demand and the red blood cell (RBC) velocity to adjust the CBF (Hall et al., 2014; Rungta et al., 2018). Finally, blood returns from downstream capillaries to venules to remove metabolic end products from the neuron cells.
Figure 2-1 Representation of microvascular unit showing vascular and cellular elements regulating CBF (Kisler et al., 2017a).
2.2.2 Neurovascular uncoupling in AD
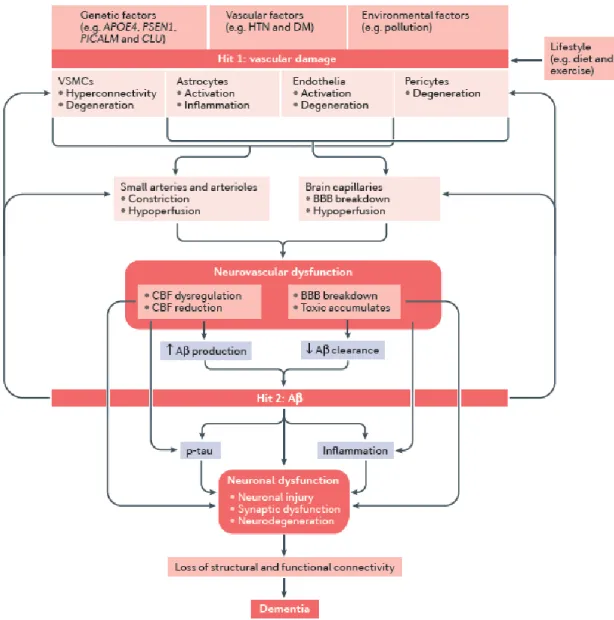
Prior studies documented that vascular damage and Aβ accumulation both contribute to the onset of AD and dementia (Iadecola, 2010b; Iturria-Medina et al., 2016; Kisler et al., 2017a; Sweeney et al., 2011; Zlokovic, 2011), as illustrated in figure 2-2. On the one hand, vascular damage of the brain has been estimated to contribute to major dementias, including 80% in AD (Hachinski, 2015; Toledo et al., 2013). Multiple risk factors influence vascular functioning, including genetics, vascular disease, and environment (Iadecola, 2013; Kisler et al., 2017a). Vascular damage can lead to neurovascular dysfunction due to constricted arterioles, hypoperfusion, and blood brain barrier (BBB) breakdown (Sweeney et al., 2011;
Zlokovic, 2011). For example, hypertension has been shown to accelerate the progression of AD (Cifuentes et al., 2015), and thus should be jointly considered in the AD pathology. Neurovascular dysfunction can directly lead to neuronal dysfunction due to CBF reduction and toxic accumulation. Additionally, neurovascular dysfunction also contributes to neuronal dysfunction through the mediation effect of Aβ accumulation. CBF dysregulation and impaired toxic clearance could facilitate the deposit of Aβ that is toxic to neuronal cells (Laurent et al., 2012). Vascular changes could even precede neuronal dysfunction and neurodegeneration that develops later on (Kisler et al., 2017a), thus offering a potential diagnostic target for identifying AD in early stages (Farkas andLuiten, 2001; Nielsen et al., 2017). Furthermore, lifestyle, such as exercise, has been found to modulate the influence of vascular damage on cognitive decline and dementia (Adlard et al., 2005; Cahill et al., 2017; Heyn et al., 2004; Larson et al., 2006; Radak et al., 2010; Wong-Goodrich et al., 2010). A biological mechanism associated with positive effects of exercise involves improved cerebral perfusion and CBF (Cahill et al., 2017; Dorr et al., 2017; R.L. et al., 1990).
On the other hand, Aβ accumulation can lead to neuronal deficit independently and synergistically influence neurons through vascular changes (Kisler et al., 2017a). The accumulation of the protein fragment Aβ outside neurons contribute to neuronal injury by disrupting the neuronal communications through synapses (Gaugler et al., 2018; Sweeney et al., 2011). The presence of toxic proteins activates the immune system to clear these toxic fragments as well as debris from dying neurons, leading to chronic inflammation to occur when the immune system cannot keep up with the toxins to be cleared (Nazem et al., 2015). In addition, Aβ accumulation at a low level could lead to an impairment of vascular responses (Kisler et al., 2017a). Previous study using transgenic mice expressing amyloid precursor protein (APP) Swedish mutation found that APP overexpression increased the susceptibility to cerebral ischemic damage due to the Aβ-induced disruption in the functioning of vascular endothelial cells (Zhang et al., 1997). Previous study also found that transgenic mice overexpressing APP and Aβ had a significant decrease in the increase of cerebral blood flow
in response to somatosensory activation, producing a deleterious mismatch between nutrients delivery and energy consumption by neurons (Niwa et al., 2000). CBF decrease was also found in transgenic mice expressing human apolipoprotein E which is a significant risk factor for developing AD (Alata et al., 2015). These studies suggest that Aβ deposition could further deteriorate vascular function and neurovascular coupling, whose dysfunction further facilitates Aβ accumulation and neuronal damage in the brain. Taken together, both pathways, including vascular damage and Aβ production can independently or synergistically lead to neuron damage, contributing to dementia.
2.3 Compromised cerebral tissue oxygenation
Although CBF gives essential information on how the brain functions in AD, cerebral tissue oxygenation offers extra information regarding the functioning of the brain, especially in pathological condition of AD due to the following reasons. Firstly, CBF regulation ensures sufficient supply of oxygen to tissue in normal condition, but the connection between CBF and oxygen supply to tissue could be compromised in AD (Kisler et al., 2017a, 2017b; Zlokovic, 2011). Hence, CBF alone may not directly reflect the tissue oxygenation state in AD. Secondly, brain neurons are highly dependent on oxygen to meet their oxidative metabolic demands (Chance, 1957; Chance et al., 1962), and thus the oxygenation level of cerebral tissue has been recommended as a biomarker in models of neurodegenerative diseases (Devor et al., 2011; Sakadžić et al., 2014). Thereby, the link between AD and cerebral tissue oxygenation is critical for our comprehension of the progression of neurovascular dysfunction and neurodegeneration in AD. In the following sections, the mechanism of oxygen supply from vasculature to tissues is discussed and the potential oxygenation changes in AD is provided.
2.3.1 Mechanisms of oxygen supply
Traditionally, it was believed that blood flow was largely regulated by arterioles on the pial surface of the brain (Nippert et al., 2018). However, recent studies document that penetrating arterioles supply 50% of the extracted oxygen at resting state (Sakadžić et al., 2014), which offer a secure margin to maintain brain function. Capillaries also play a crucial role in supplying oxygen to support neuronal activity (Hall et al., 2014; Kisler et al., 2017b; Santisakultarm et al., 2014; Stefanovic et al., 2008), since they are the vessels most proximal to neurons. Thus, this thesis focusses on the role of penetrating arterioles and capillaries on oxygen supply to neurons, due to their essential role in regulating CBF (Kisler et al., 2017b; Nippert et al., 2018; Sakadžić et al., 2014).
To transmit from blood to tissues, oxygen molecules firstly unbind from hemoglobin and diffuse from the red blood cells (RBC) to plasma, across the vascular wall, and finally into the tissues. Partial pressure of oxygen (PO2) represents the amount of oxygen gas and can
diffuse from blood to tissue. The intravascular and extravascular PO2 are the most basic
physiological parameters with great variability that may originate from dynamics in regional CBF and metabolic needs for different brain areas (Masamoto et al., 2003; Sakadži et al., 2010). Under normal physiological conditions, oxygen supply enabled by increased CBF exceeds the neuron cells’ metabolic demand, thus ensuring a large PO2 gradient for oxygen
diffusion to cells even furthest from capillaries (Attwell et al., 2010; Buxton, 2010; Lin et al., 2010).
Diffusion of oxygen to neuronal cells can be boosted with external stimulation for more computationally demanding neuronal activities (Beau M.Ances et al., 2001; Vazquez et al., 2010). During functional stimulation, tissue locations far from the vascular feeding source were also observed to have an overshoot in oxygenation (Devor et al., 2011). Low level of cerebral tissue PO2 may lead to hypoxia and affect the survival of neuronal cells far from
vascular sources (Moeini et al., 2019, 2018). During functional stimulation, the increased oxygen supply results from the increased CBF (Moeini et al., 2019), which creates large PO2
gradient for oxygen delivery. Because of the close relationship among PO2, CBF, and
neuronal activity (B.M.Ances et al., 2001), PO2 can serve as an effective marker in
neurodegenerative disease, such as AD, either to detect if a departure from normal PO2 occurs
in the disease model or to determine the efficiency and effectiveness of potential preventive therapies (Devor et al., 2011).
2.3.2 Compromised CBF and cerebral tissue oxygenation with AD
Previous research have documented neurovascular deficits in AD (Delafontaine-Martel et al., 2018; Gorelick et al., 2011; Kitaguchi et al., 2007; Montine et al., 2014; Snyder et al., 2014; Wardlaw et al., 2013). Findings in transgenic mice APPSwDI have shown that arterial
VSMCs exhibited an impaired ability to clear Aβ (Bell et al., 2009), thus leading to Aβ accumulation in the vascular walls and blocking the exchange of oxygen between blood and tissues. An earlier large population‑based study showed that cerebral hypoperfusion preceded and possibly contributed to onset of clinical dementia with transcranial Doppler (Ruitenberg et al., 2005). By contrast, individuals exhibiting higher CBF were less inclined to develop dementia and had larger brain areas (e.g., hippocampal & amygdala volumes) for cognitive functioning (Ruitenberg et al., 2005). Using pseudo-continuous arterial spin labeling MRI, previous studies also showed global CBF was lower in patients having moderate cognitive impairment, as compared to normal control (Michels et al., 2016). Collectively, these findings demonstrate that changes in CBF are an essential feature of AD and adding vascular changes into diagnosis of AD could further improve the accuracy of AD diagnosis in early stages. Due to the tight connection between CBF and tissue oxygenation (Devor et al., 2012; Moeini et al., 2018; Sakadžić et al., 2014), disturbance of CBF in AD may drop cerebral tissue PO2,
and disrupt the normal cerebral PO2 gradients between microvasculature and tissue, resulting
in lack of oxygen diffusion from microvasculature to the neuronal cells (Masamoto et al., 2003). Since neurons are highly sensitive to oxygen supply (Girouard andIadecola, 2006; Iadecola, 2004; Østergaard et al., 2013), slight variations in CBF may lead to hypoxia and neuron damage in regions with low tissue PO2. The spatial heterogeneity of tissue PO2 which
depends on CBF properties could thus be altered with factors such as aging and neurodegenerative diseases (Moeini et al., 2018). However, existing research mostly focus on the vascular changes in AD and neglect the importance of tissue oxygenation as a biomarker for AD. Tissue oxygenation is essential to understand and monitor the progression of AD, since 1) tissue oxygenation directly influence neuron survival due to the high demand for oxygen in neuronal cells (Devor et al., 2012; Kisler et al., 2017a; Moeini et al., 2018; Østergaard et al., 2013), 2) tissue oxygenation is both closely related by CBF regulation and neuronal activity (Iadecola, 2004; Kisler et al., 2017a). Due to the heterogeneity and dynamics of tissue PO2, new technology for in vivo measurement of PO2 in the cerebral
cortex based on non-invasive optical method can play a key role in recording images with high spatial resolution (Sakadži et al., 2010; Sakadžic et al., 2016; Sakadžić et al., 2014). In the next chapter, imaging techniques that can record oxygenation parameters are discussed.
CHAPTER 3 METHODOLOGY REVIEW FOR PO
2MEASUREMENTS
Multiple approaches have been used to quantify tissue oxygenation, each with a different mechanism to measure PO2. In this chapter, numerous imaging techniques on tissue
oxygenation will be reviewed and assessed.
3.1 Mass spectroscopy
Mass spectroscopy has been used to analyze cerebral blood gas and cerebral PO2 in early
animal research (Brantigan et al., 1972; Rigaud-Monnet et al., 1994). A gas-sampling cannula needs to be implanted chronically into the brain to withdraw minor quantities of physiological tissue gasses. A specially designed Teflon diffusion membrane (see Fig. 3-1) is inserted at the end of the implantable cannula with the membrane end into the tissue or blood and the opposite end connecting to the vacuum of the mass spectrometer. The membrane ensures that only dissolved gases with no blood are aspirated through the membrane in proportion to their partial pressures.
Figure 3-1 Design of Teflon membrane and cannula.
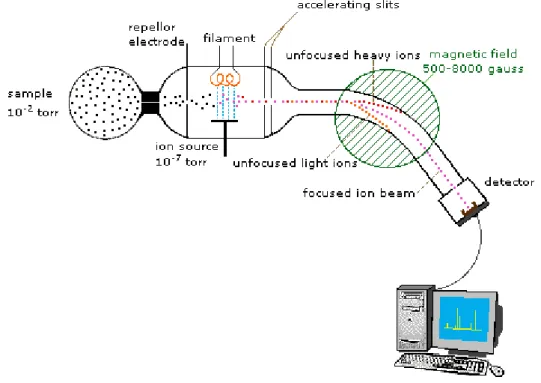
These gases are then analyzed in the chamber of mass spectrometer. The oxygen molecules are identified by ionization, acceleration and separation based on their molecular weight, allowing for quantitative measurement of tissue PO2 (Reusch, 2013). To measure the
which can be manipulated by magnetic fields. As shown in Fig. 3-2, firstly, a sample gas is collected by a high vacuum (e.g., 10-2 torr pressure in contrast to the atmospheric pressure of
760 torr). Due to the short-lived nature of ions, this sample is handled under the pressure of 10-7 torr, and ionization is achieved by a high energy beam of electrons enabled by a filament.
The ion separation is effected by accelerating and focusing the beam through the accelerating slits and bending the beam by a magnetic field. By adjusting the strength of the magnetic field, ions of different mass can be collected by the detector progressively. Lastly, a computer analyzes the character of the ions by its specific mass-to-charge ratio (m/z). For example, oxygen (O2) has a mass-to-charge ratio of 32, and carbon dioxide has a ratio of 28.
Figure 3-2. A sample design of spectrometer (Reusch, 2013).
However, there are several drawbacks with this method. Firstly, this method is invasive due to the need for implantation of the cannula which connects to the vacuum and analysis chamber of mass spectrometer on the one end and the blood vessels in the other end (Weaver andLiu, 2017). The cannula usually needs to be inserted into the vessels for 1 or 2 days
(Brantigan et al., 1972), so that there is inflammation concerns at the site of implantation which may delay the experimental process (Weaver andLiu, 2017). Secondly, measurements of tissue PO2 can be obtained only at the site of implantation, limiting its capability to offer
oxygen information in other regions of the brain (Lyons, 2015). Thirdly, although oxygen parameters can be collected in vivo, the animals need to be anesthetized, which may influence the physiological parameters of the animals. Hence, the accuracy of oxygen measurement may be compromised due to anesthesia.
3.2 Polarography
Polarography has been used for in vivo measurements of cerebral PO2 for decades and
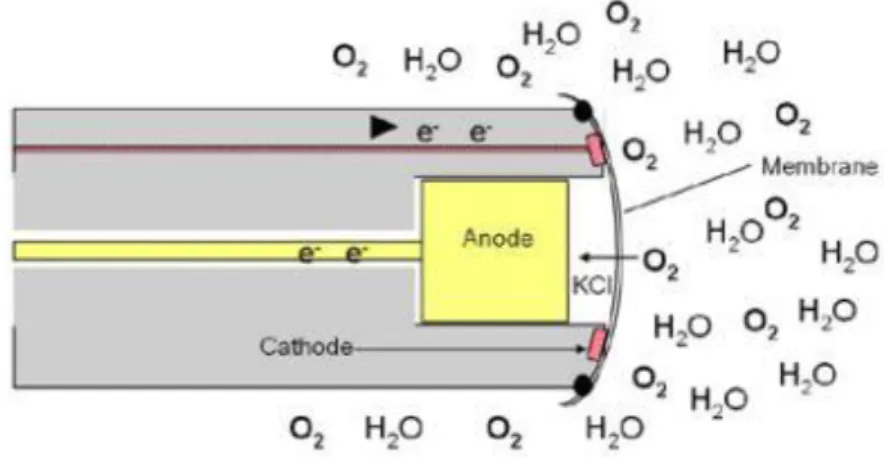
established major findings to shape our current understandings of the cerebral tissue oxygenation (see review (Ndubuizu andLaManna, 2007)). Polarography is based on the reduction of oxygen at the surface of a noble metal (e.g., platinum) affected by the negative polarizing voltage. The polarographic electrode consists of a cathode covered by a membrane for oxygen reduction and a nearby reference electrode. The tip of the cathode electrode is inserted into the tissue of interest for oxygen measurements by producing a current in proportion to the concentration of oxygen adjacent to the electrode, inducing the reduction of oxygen by transforming O2 to H2O.
Among the polarographic sensors, the Clark electrode (see Fig. 3-3), developed by Dr. Leland Clark in 1956, was commercially produced and has been used to measure dissolved oxygen in recent research (for example in the work of (Lecoq et al., 2009)) due to its time-efficiency and less susceptibility to interference (see the review (Ndubuizu andLaManna, 2007)). The dissolved oxygen molecules diffuse through the specially-designed membrane and are reduced at the cathode, based on the following reaction (Nguyen et al., 2014):
O2 + 2H2O + 2e- → H2O2 + 2OH
-The PO2 versus the electrode current generated through oxygen reduction can be calibrated
due to the oxygen diffusive flux in proportion to the PO2 in the sampled region (YSI, 2009).
Figure 3-3 An explanation of the Clark sensor (YSI, 2009).
However, there are several limitations of the polarographic electrode (see reviews (Ndubuizu andLaManna, 2007) and (Weaver andLiu, 2017)). Firstly, this method is invasive, since the reduction of oxygen at the cathode may alter the physiological environment around the sampling area which may further influence the measurements. Secondly, this technique gives point measurement rather than a 2D mapping of tissue PO2, as it only gives oxygen
information nearby the electrode. To obtain oxygen distribution, multiple probes may be used for simultaneous measurement or multiple sequential repositioning of the electrodes are required. Thirdly, this method cannot offer repetitive measurements over prolonged periods (e.g., for days). The ions in the electrolyte are not stable over time and need to be replaced.
3.3 Electron Parametric Resonance (EPR) oximetry
Electron paramagnetic resonance (EPR) is a magnetic resonance technique that measures only species with unpaired electrons (see reviews (Gallez et al., 2004) and (Weaver andLiu,
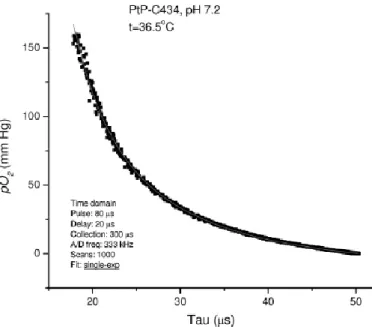
2017)). Molecular oxygen has two unpaired electrons which represents its paramagnetic property, and thus can be measured by EPR. To directly measure oxygen in biological systems, EPR oximetry is designed based on the biomolecular collisions between oxygen and free radicals, given that this interaction can alter the resonance characteristics of the radical and consequently the EPR spectrum (see review (Gallez et al., 2004)). The most common method is to apply the oxygen dependent broadening of the EPR linewidth (LW) of a paramagnetic oxygen sensor implanted in tissues. As shown in Fig. 3-4, the oxygen sensor has a higher LW response at low PO2, and thus EPR has high sensitivity to detect hypoxic
areas (e.g., regions with low PO2 values (e.g., 0.5 mmHg)). The sensor also has quick
response to the variation of tissue PO2, see Fig. 3-4. Due to these characteristics, EPR oximetry has been used to measure oxygenation in tumor studies. A recent study (Langan et al., 2016) used EPR oximetry to quantify oxygen gradients in spheroids, ball-shaped models representing liver or tumor. Since regions with tumor are often associated with hypoxia, EPR provides the sensitivity to detect these areas and the variations of PO2 in these regions.
Figure 3-4. The calibration curve based on linewidth as a function of the PO2 (Adapted from the review (Gallez et al., 2004)).
Figure 3-5 PO2 distribution in ischemic mouse brain recorded by EPR 2D spectral-spatial
linewidth imaging (Shen et al., 2009). A) PO2 map in the sham control mouse head, B), PO2
map in the same mouse after ischemia, C) MR diffusion image in the mouse after ischemia. D) Representative spatial profiles of PO2 in both groups. The PO2 values were recorded along
the black lines in A and B. E) Frequency of PO2 values in the sham control head and the
ischemic head.
Suitable paramagnetic probes are needed in the tissue regions of interes for ERP line-broadening measurements (Swartz et al., 2014). Two typical types of probes for EPR include particulate and soluble probes (Weaver andLiu, 2017). However, both probes have their limitations. There are concerns about biocompatibility with exposure to particulate probes in long periods of time, since these particulate probes may have chemical reactions in the biological systems and produce toxic chemicals. Considering the sensitivity of cerebral neuronal cell, it is reasonable to evaluate the risk of implanting particulate probes into the
brains. Soluble probes can also be used for EPR oximetry for mapping of oxygen, but are used in ex vivo environment more frequently due to the difficulty to delivery this type of probe through the BBB. In addition, the soluble proble responds to the disolved oxygen in tissue, which is more heterogeneous than tissue PO2, thus weakening the sensitivity of the
soluble probe.
3.4 Two-photon phosphorescence optical method
3.4.1 Oxygen-dependent quenching of phosphorescence
The mechanism of oxygen-dependent quenching of phosphorescence (Quaranta et al., 2012; Shonat andKight, 2003) can be represented by the Perrin-Jablonski diagram, as shown in Fig. 3-6. Specifically, in the absorbance stage, the luminescent molecule is excited from the ground state (S0) to the first singlet excited state (S1) or the second singlet excited state (S2),
which takes about 10-15 s. Next, the luminescent molecule undergoes internal conversion
which involves an intermolecular process that transitions a higher electronic state (S2) to a
lower electronic state (S1) without radiation. This internal conversion process takes about
10-12 s (denoted as the rate constant k
ic). This transition occurs rapidly and before the
de-excitation process.
There are two radiative approaches for de-excitation, including fluorescence and phosphorescence. One the one hand, fluorescence emission occurs at the first singlet excited state (S1), which does not involve changes in multiplicity (e.g., from singlet to triplet), thus
having a high possibility to occur. The fluorescence lifetimes are usually around 10-8 s. One
the other hand, phosphorescence emission occurs from the lowest excited triplet state (T1),
which requires transition between different multiplicities (S1 → T1) that is less likely to
occur. Likewise, the transition from triplet (T) to singlet (S) is also less likely to occur than singlet to singlet transition (the case in fluorescence), and thus phosphorescence emission requires more time (from 10-6 s to several seconds) to decay than fluorescence. However, the
presence of heavy atom in the phosphorescent molecular probe could increase the probability of crossing between the triplet and singlet state, thus making phosphorescence highly efficient by shortening the decay time. Since phosphorescence emission occurs at a lower energy state (T1), it emits lower energy compared to the fluorescence. Compared to
fluorescence de-excitation, phosphorescence quenching is preferred due to its relatively longer triplet lifetime, and thus offering higher oxygen sensitivity (Finikova et al., 2008). When interacting with oxygen, the luminescent molecules are quenched in a non-radiative de-excitation process involving collisions between quenchers and luminescent molecules. One potential mechanism indicates that the paramagnetic oxygen facilitates the intersystem crossing of luminescent molecules from singlet to triplet, and oxygen molecule transitions to excited state and then returns to ground state (Quaranta et al., 2012; Shonat andKight, 2003).
Figure 3-6. Perrin-Jablonski diagram (Quaranta et al., 2012).
In addition to the above figure, this quenching process can also be denoted in expressions. When a large quantity of phosphorescence dye is excited simultaneously, the phosphorescence emission can be represented by the exponential decay function:
(𝑡)=𝐼0 exp(−𝑡/𝜏) (1)
where 𝐼(𝑡) represents the intensity of phosphorescence as a function of time, 𝐼0 represents the
maximum intensity at time 0, and 𝜏 is the apparent lifetime of the decay. In the presence of a quenching agent, in our case the oxygen, the decay time of phosphorescence is shortened due