Publisher’s version / Version de l'éditeur:
International Journal of Thermophysics, 38, 107, 2017-05-12
READ THESE TERMS AND CONDITIONS CAREFULLY BEFORE USING THIS WEBSITE.
https://nrc-publications.canada.ca/eng/copyright
Vous avez des questions? Nous pouvons vous aider. Pour communiquer directement avec un auteur, consultez la
première page de la revue dans laquelle son article a été publié afin de trouver ses coordonnées. Si vous n’arrivez pas à les repérer, communiquez avec nous à [email protected].
Questions? Contact the NRC Publications Archive team at
[email protected]. If you wish to email the authors directly, please see the first page of the publication for their contact information.
NRC Publications Archive
Archives des publications du CNRC
This publication could be one of several versions: author’s original, accepted manuscript or the publisher’s version. / La version de cette publication peut être l’une des suivantes : la version prépublication de l’auteur, la version acceptée du manuscrit ou la version de l’éditeur.
For the publisher’s version, please access the DOI link below./ Pour consulter la version de l’éditeur, utilisez le lien DOI ci-dessous.
https://doi.org/10.1007/s10765-017-2239-1
Access and use of this website and the material on it are subject to the Terms and Conditions set forth at
NRC microwave refractive index gas thermometry implementation
between 24.5 K and 84 K
Rourke, P. M. C.
https://publications-cnrc.canada.ca/fra/droits
L’accès à ce site Web et l’utilisation de son contenu sont assujettis aux conditions présentées dans le site LISEZ CES CONDITIONS ATTENTIVEMENT AVANT D’UTILISER CE SITE WEB.
NRC Publications Record / Notice d'Archives des publications de CNRC:
https://nrc-publications.canada.ca/eng/view/object/?id=0ac2fea4-9f11-48f0-a61a-e007058c1a18 https://publications-cnrc.canada.ca/fra/voir/objet/?id=0ac2fea4-9f11-48f0-a61a-e007058c1a18
(will be inserted by the editor)
NRC microwave refractive index gas thermometry
implementation between 24.5 K and 84 K
P. M. C. Rourke
Received: date / Accepted: date
Abstract The implementation of microwave refractive index gas thermometry at the National Research Council between 24.5 K and 84 K is reported. A new gas-handling system for accurate control and measurement of experimental gas pressure has been constructed and primary thermometry measurements have been performed using a quasi-spherical copper resonator and helium gas at temperatures corresponding to three defining fixed points of the International Temperature Scale of 1990 (ITS-90). These measurements indicate differences between the thermodynamic temperature T and ITS-90 temperature T90of (T − T90) = −0.60 ± 0.56 mK at T90= 24.5561 K, (T − T90) = −2.0 ± 1.3 mK at T90= 54.3584 K, and (T − T90) = −4.0 ± 2.9 mK at
T90= 83.8058 K. The present results at T90= 24.5561 K and T90= 83.8058 K agree with previously reported measurements from other primary thermometry techniques of acoustic gas thermometry and dielectric constant gas thermometry, and the result at T90= 54.3584 K provides new information in a temperature region where there is a gap in other recent data sets.
Keywords Primary thermometry · Thermodynamic temperature · T − T90 · Polarizing gas thermometry· Refractive index gas thermometry · RIGT
1 Introduction 1.1(T − T90)
The International Temperature Scale of 1990 (ITS-90) [1, 2] is a practical temperature scale used worldwide to approximate thermodynamic temperature T by ITS-90 tem-perature T90. The ITS-90 was created based on the best thermodynamic temperature measurements available in 1990, mainly those performed using the constant-volume gas thermometry (CVGT) technique.
Since 1990, however, new measurements have indicated that T90deviates from
T over a broad temperature range [3, 4]. The most accurate(T − T90) measurements National Research Council Canada, 1200 Montreal Road, Ottawa, ON K1A 0R6, Canada
thus far have been from acoustic gas thermometry (AGT), which has seen consider-able technical advancement [5–7]. Another promising primary thermometry approach is polarizing gas thermometry, in which electromagnetic measurements of a working gas are used to determine the thermodynamic temperature of the gas. Polarizing gas thermometry has been implemented most prominently in the technique of dielectric constant gas thermometry (DCGT), in which the thermodynamic temperature is ob-tained from electrical capacitance measurements [8, 9]. A different implementation of polarizing gas thermometry is refractive index gas thermometry (RIGT), in which the refractive index of the working gas is linked to the thermodynamic temperature [10– 15].
At the National Research Council (NRC), work has been undertaken to further develop microwave resonator-based refractive index gas thermometry and apply this technique to (T − T90) measurements below room temperature. The initial imple-mentation described below focuses on the temperature range from the triple point of neon (T90= 24.5561 K) to the triple point of argon (T90= 83.8058 K). The present study builds on earlier development and characterization work at NRC [14], and thus highlights improvements and changes made relative to the previous publication. All uncertainties below, including those of calibrated instruments, are reported with a coverage factor of k= 1.
1.2 Refractive index gas thermometry (RIGT) The refractive index n of a gas may be calculated as
ncalc=√εrµr, (1) in whichεrandµrare the relative dielectric permittivity and relative magnetic per-meability, respectively, of the working gas. In turn,εrandµrmay be obtained using virial expansions in terms of the gas densityρ[12, 13]:
εr− 1 εr+ 2 = Aερ+ Bερ2+Cερ3+ . . . (2) and µr− 1 µr+ 2 = Aµρ+ . . . (3)
In these equations, Aε, Bεand Cε are dielectric virial coefficients, and Aµ is the first diamagnetic virial coefficient.
The gas pressure p may also be expressed as a virial expansion in terms of the gas density as a virial equation of state [12, 13]:
p= RTρ[1 + Bρρ+Cρρ2+ Dρρ3+ . . .] , (4) in which R= NAkBis the molar gas constant, NAis the Avogadro constant, kBis the Boltzmann constant, T is the thermodynamic temperature, and Bρ, Cρ and Dρ are density virial coefficients. The presence of T in Eq. 4 is the key to experimentally determining the thermodynamic temperature of the gas.
The virial coefficients Bε, Cε, Bρ, Cρand Dρare, in general, temperature depen-dent. In the present study, Eq. 2 was truncated after the Cεterm, Eq. 3 was truncated after the Aµ term, and Eq. 4 was truncated after the Dρterm. With these truncations in place, Eqs. 2 and 3 can be inverted and combined with Eq. 1 to obtain:
n2calc≈( 1 + 2Aερ+ 2Bερ 2+ 2C ερ3 1− Aερ− Bερ2−Cερ3 ) ( 1+ 2Aµρ 1− Aµρ ) . (5)
An approximate inversion of Eq. 4, suitable for converting measured gas pressure p to densityρfor use in Eq. 5, has been derived by iterative substitution [12, 16]:
ρ≈ p / RT+ Bρp 1+RTB+Bρpρp+ Cρp2 RT(RT+2Bρp) + Cρp 2 RT+ 2Bρp+ Dρp3 R2T2 . (6)
Testing this approximation by substitutingρ from Eq. 6 into Eq. 4 and comparing the p used as input in Eq. 6 to the resulting p given as output from Eq. 4 reveals a 0.15 parts per million (ppm) difference at the highest density measured for the helium working gas used in the current study (∼ 980 mol m−3at p= 200 kPa and T90= 24.5561 K). This difference is reduced to 0.11 parts per trillion by performing the following p→ρ procedure of cycling through Eqs. 4 and 6 one additional time whenever a pressure is converted into a density:
1. Calculateρ1from p= pinputusing Eq. 6.
2. Calculate p1fromρ=ρ1using Eq. 4, and obtain∆p1= p1− pinput. 3. Calculateρoutputfrom p= pinput−∆p1using Eq. 6.
In microwave RIGT, the refractive index of the working gas is measured exper-imentally inside a hollow electrically-conducting resonator cavity by measuring the microwave resonances of the cavity. The NRC RIGT implementation uses a quasi-spherical resonator (QSR) geometry that splits each resonance into a triplet of res-onance peaks. An example of a resres-onance triplet, as well as the shift of resres-onance frequencies due to the presence of gas in the resonator cavity, is shown in Fig. 1. During data analysis, the centre frequency f of each measured peak in the triplet is corrected for the effects of finite conductivity of the resonator shell by adding a half-width term g, and then the three corrected triplet frequencies are averaged together. At a given temperature and pressure, the experimentally-determined refractive index of the working gas is [12–14]
nexpt= c0 2π⟨ f + g⟩ ⟨ξcorr⟩ aeq = c0 2π⟨ f + g⟩ ⟨ξcorr⟩ a0(1 −κT3p) , (7) in which c0is the speed of light in vacuum,⟨ f + g⟩ is the average half-width-corrected frequency of the triplet measured at pressure p, aeqis the equivalent radius of a spheri-cal resonator with the same volume as the measured QSR at pressure p, a0is the value of aeqmeasured in vacuum,κTis the isothermal compressibility of the resonator shell, and⟨ξcorr⟩ is the average corrected microwave eigenvalue for the given mode at pres-sure p [14]. Microwave resonance meapres-surements in vacuum, where n≡ 1, yield the vacuum QSR radius a0.
2.620 2.622 2.624 2.626 2.628 0 5 10 15 20 25 30 35 data fit vacuum 200 kPa 1 0 6 · | S 2 1 | Frequency, GHz
Fig. 1 TM11 microwave triplet measured at T90= 54.3584 K, both in vacuum and at 200 kPa. Fits to the spectra are plotted as solid and dashed lines.
At a given ITS-90 temperature T90, the isothermal compressibilityκTin Eq. 7 is derived from other material properties of the resonator shell:
κT= 1 BS + 9α 2 LT90a30 ρshell, 293 Kcpa30, 293 K , (8)
in which BSis the adiabatic bulk modulus of the shell at T90,αLis the linear thermal expansion coefficient of the shell at T90, a0 is the vacuum radius of the resonator cavity at T90, cp is the constant-pressure specific heat capacity of the shell at T90,
ρshell, 293 Kis the density of the shell at 293 K, and a0, 293 Kis the vacuum radius of the resonator cavity at 293 K.
Equating n2
exptfrom Eq. 7 and n2calcfrom Eq. 5 gives the working equation used the analyze the results of the present study:
{ c0 2π⟨ f + g⟩ ⟨ξcorr⟩ a0(1 −κT3p) }2 −( 1 + 2Aερ+ 2Bερ 2+ 2C ερ3 1− Aερ− Bερ2−Cερ3 ) ( 1+ 2Aµρ 1− Aµρ ) ≈ 0, (9) in which the isothermal compressibilityκTis calculated from Eq. 8 and the densityρ is calculated from the pressure p using the cyclic p→ρprocedure outlined above. As described in section 3.1, Eq. 9 is solved numerically to determine the thermodynamic temperature T from each microwave scan. Note that this method of analysis does not allow the virial coefficients to be obtained from the experimental RIGT data, and literature values of these coefficients must be used when evaluating Eq. 9. At a cost of reduced numerical accuracy, readers may further simplify Eq. 9 (for example, by substituting inρ directly from Eq. 6 rather than using the cyclic p→ρ procedure, truncating the virial expansions at lower orders, and/or applying other mathematical
approximations), but this path was not taken for the determination of thermodynamic temperature values in the present study.
Thermodynamic temperatures obtained using the chosen data analysis model based on Eq. 9 and described in section 3.1 are compared in section 4.4 to those obtained using an alternate model in order to estimate a model-dependent uncertainty contri-bution. In analogy to the approach often used in DCGT [9], the alternate model is derived by combining the virial expansions of Eqs. 2–4 into a single virial expansion relating n2calcto p: n2calc− 1 = Anp+ Bnp2+Cnp3+ . . . , (10) in which An= 3 RT(Aε+ Aµ) , (11) Bn= 3 R2T2(A 2 ε+ Bε− AεBρ) , (12) Cn= 3 R3T3 ( A3ε+ 2AεBε+Cε− 2A2εBρ− 2BεBρ+ 2AεB2ρ− AεCρ ) , (13) and terms involving higher orders of Aµ have been neglected. The experimentally-measured n2
expt isotherm data are then fitted as a function of p to a polynomial of the form of Eq. 10, and the thermodynamic temperature T extracted from the Anfit coefficient via Eq. 11.
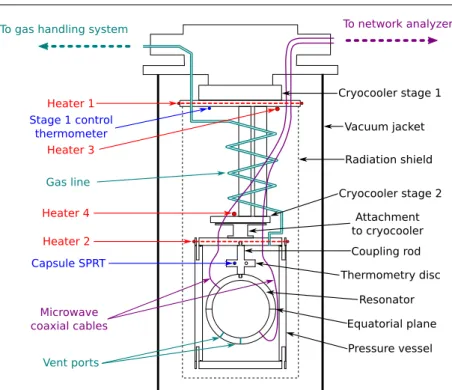
2 Experimental details 2.1 Cryostat and thermometry
A diagram of the cryostat set-up used for the presently-reported measurements is shown in Fig. 2. The oxygen-free high-conductivity (OFHC) copper quasi-spherical “race-track” resonator [12] and two-stage pulse-tube cryocooler are the same as used in the previous NRC study [14]. The same waveguide correction due to the presence of vent ports and antennas is applied as in the previous study [14], and the microwave half-width-broadening effects of the resonator’s equatorial plane are avoided by using the gcalccorrection described in section 2.3.
Four resistive heaters are employed for thermal control: heaters 1 and 2 are wire heaters wrapped around the circumference of cryocooler stage 1 and the pressure vessel lid, respectively, used for fine control; and heaters 3 and 4 are higher-power cartridge heaters mounted on stages 1 and 2, respectively, and used for coarse control. The stage 1 control thermometer is a PT100-type sensor.
ITS-90 temperature T90is realized using a Rosemount capsule standard platinum resistance thermometer (CSPRT) with serial number R4794. CSPRT R4794 was cali-brated at NRC in 2015, alongside several other CSPRTs, in an adiabatic cryostat over the triple point of equilibrium hydrogen (T90= 13.8033 K) to the triple point of water (T90= 273.16 K) range of the ITS-90 [17,18]. The capsule thermometer is measured using an Automatic Systems Laboratories F18 resistance bridge, relative to a Tinsley model 5685A reference resistor thermostatted in an oil bath. All T90 measurements
Fig. 2 Diagram of the NRC RIGT cryostat apparatus.
reported in the present study have been corrected for thermometer self-heating ef-fects.
Mechanical vibrations of the adiabatic cryostat used for CSPRT calibration, aris-ing from the Gifford-McMahon cryocooler used in that system, were previously shown to have no measurable effect on CSPRTs mounted within that cryostat [17]. Both the RIGT cryostat shown in Fig. 2 and the adiabatic cryostat use rigid connec-tions to their respective cold heads, but the RIGT cryostat exhibits less vibration than the adiabatic cryostat (as is typically the case when comparing pulse-tube cryocool-ers to Gifford-McMahon cryocoolcryocool-ers [19, 20]), and the RIGT pressure vessel is more massive than the adiabatic cryostat mass-loading shields. As a result, mechanical vi-brations are expected to have a negligible effect on the CSPRT mounted in the RIGT cryostat for the present study.
During testing, heater 2 was observed to create undesirable thermal gradients within the cryostat, causing the measured thermodynamic temperature T to depend linearly on the heater 2 power even as T90 was held at a fixed value. In order to compensate for this, microwave resonance measurements were performed at several different heater 4 offset powers. The various heater 4 settings required different heater 2 powers to maintain control at the selected T90 set point, allowing the measured experimental results to be extrapolated to zero heater 2 power during data analysis.
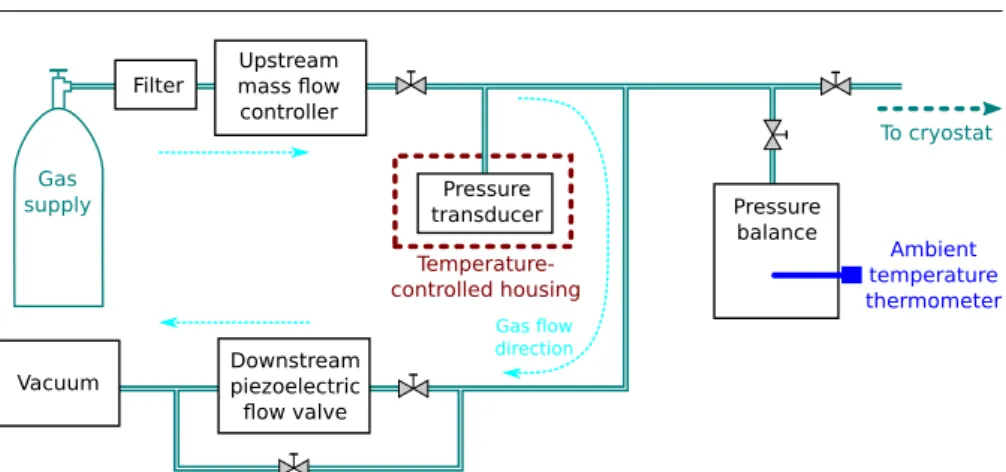
Fig. 3 Diagram of the NRC gas handling system, used to control and measure the pressure of the working gas in the cryostat pressure vessel.
Table 1 Manufacturer’s gas analysis report for the 99.9999% pure helium working gas used in the present study.
Impurity species Concentration in gas cylinder Removed by SAES filter?
N2 < 0.4 ppm no
O2 < 0.2 ppm yes
H2O < 0.2 ppm yes
total hydrocarbons (as CH4) < 0.1 ppm no
CO2 < 0.05 ppm yes
CO < 0.05 ppm yes
2.2 Gas-handling system and pressure measurement
A new gas-handling system was constructed at NRC to satisfy the demanding gas pressure control, pressure measurement and purity requirements of this study. A di-agram of the gas-handling system is shown in Fig. 3. The present configuration uses a flowing-gas pressure control scheme within the gas-handling system and static gas arrangement in the pressure balance - cryostat - pressure vessel - resonator portion. Within the cryostat (Fig. 2), the gas line consists of a 1/4-inch stainless steel tube from the room-temperature gas feedthrough to stage 1 of the cryocooler, a segment of 1/4-inch copper tube heat-sunk to stage 1, a 1/4-inch stainless steel bellows be-tween stage 1 and the pressure vessel, and another 1/4-inch copper tube connected to the gas feedthrough into the pressure vessel. Except where it is deliberately heat-sunk, the gas line inside the turbo-pumped cryostat vacuum space does not touch anything else. The gas-handling system was extensively turbo-pumped and repeatedly flushed with high-purity helium gas following assembly.
99.9999% pure helium working gas is sourced from a Linde HiQ 6.0 Grade cylin-der (Cylincylin-der No. 353671, from Lot No. 1304161); see Table 1 for the manufacturer’s gas analysis report. The working gas is passed through an SAES MicroTorr MC1-902 gas purifier in order to filter out impurities: this filter removes O2, H2O, CO2, CO and H2to< 0.1 parts per billion (ppb) [21]. N2and hydrocarbons such as CH4are not
removed from the source gas and must be accounted for in the overall uncertainty estimates (see section 4.4). While noble gas impurities are also not removed from the source gas and typically not listed on manufacturers’ gas analysis reports, none were detected in a sample of the present study’s working gas analyzed using the Finnigan MAT 271 mass spectrometer at the Korea Research Institute of Standards and Sci-ence (previously employed for measurements of the molar mass of argon in support of acoustic determinations of the Boltzmann constant [22]). The detection limits of the mass spectrometer measurement are 2 ppm for neon, 0.6 ppm for argon, 0.5 ppm for krypton, and 0.7 ppm for xenon; these limits are used in section 4.4 to set bounds on uncertainty contributions due to noble gas impurities in the working gas.
An upstream mass flow controller maintains a constant 5 standard cubic centime-tres per minute of gas flow through the gas handling system during all pressure control and calibration activities, and a downstream piezoelectric gas flow valve is actively controlled by a PID loop to maintain the target pressure. During gas-flow mode, vac-uum is provided by a dry scroll pump. In order to measure the vacvac-uum radius a0of the resonator cavity prior to each p-rising/p-falling isotherm pair, the pressure vessel is turbopumped via a bypass line. Microwave resonances are monitored continuously during pump-down to ensure that the resonator cavity reaches base pressure prior to the commencement of a0measurements.
A Paroscientific Digiquartz 745-100A absolute pressure transducer is used dur-ing isotherm data collection for pressure measurement and as input for the pressure-control PID loop. It is thermostatted inside an air bath temperature-pressure-controlled housing which maintains thermal stability of approximately±0.01◦C. The pressure trans-ducer is calibrated in-situ in the gas-handling system using a Ruska 2465-754 dead-weight piston pressure balance. Systematic effects due to, for example, the difference in height between the pressure transducer and pressure balance are included in the calibration, such that the calibrated pressures measured by the pressure transducer are equivalent to pressures at the effective reference plane of the pressure balance. The pressure balance is operated with a Ruska 2465-725 low-range piston/cylinder set (serial number TL-1188) and Ruska 2465-799 / 2465-795-2 extended mass set (serial number 43503), which limit the maximum calibration pressure to approxi-mately 200 kPa. The piston/cylinder temperature is measured with a Guildline 9540 digital thermometer (calibrated at NRC in 2015 with an uncertainty of 0.01◦C) in-serted into the base of the pressure balance, and a correction for thermal expansion is applied. Manufacturer-supplied values of the piston thermal expansion coefficient, height and mass are used in the calculation of the pressure measured by the pressure balance. The masses in the mass set were calibrated at NRC in 2015, with an uncer-tainty of 0.15 mg on each of the 200–1000 g masses and a relative unceruncer-tainty of 1 ppm on each of the 10–100 g masses. The effective area of the piston was calibrated at the US National Institute of Standards and Technology (NIST) in 2016, with a pressure-independent value of 3.357471 × 10⁻⁴ m2and pressure-dependent uncer-tainty varying between 8 ppm and 6 ppm. This effective area value is only 3.3 ppm larger than the manufacturer-supplied value of the piston effective area from 1991, which itself carried a 13 ppm uncertainty. The acceleration due to gravity at the height of the piston gauge effective reference plane, ggravity, was re-determined in 2016 and found to be 9.8061336(10) m·s−2, slightly larger than the value previously used for
experiments performed in this laboratory [18, 23, 24]. Combining the new piston ef-fective area and gravitation acceleration values results in a change of the pressure realization of less than 2 ppm relative to that used previously at NRC with the same equipment [23].
A calibration of the pressure transducer was performed using the pressure balance in February 2016 at 8 different piston mass loadings in the 16–201 kPa range. The resulting relative uncertainty in the pressure transducer pressure calibration is pres-sure dependent, but asymptotes to a roughly prespres-sure-independent value of 8 ppm for pressures above 50 kPa, of which the dominant component is the 6 ppm relative uncertainty in the effective area of the piston in this pressure range. This calibration was repeated in July 2016 using the same mass loadings, revealing a 7 Pa pressure-independent offset of the pressure transducer below its February calibration. The drift of the pressure transducer offset was assumed to be linear in time between these cal-ibrations, and this was used to correct the pressures measured by the pressure trans-ducer during the isotherms collected for this study spanning from March to July 2016. This assumed linear functional form may not perfectly model the real time-drift of the pressure transducer offset (as evidenced by residual pressure dependence seen in the(T − T90) results of section 4), but a more complicated correction would require more detailed data on the time-dependence of the transducer offset. Vacuum readings from the pressure transducer taken during the a0measurements immediately prior to each p-rising/p-falling isotherm pair roughly confirm a linear-in-time offset drift and are used in section 4.4 as the basis for an alternate transducer drift model in order to estimate the uncertainty of the applied linear-in-time offset correction; however, these vacuum measurements were not directly used for detailed corrections or re-zeroing due to an observed dependence on atmospheric pressure of the pressure transducer readings while operating in hard vacuum conditions. Pressure transducer readings were confirmed to be independent of atmospheric pressure when the pressure in the gas-handling system was actively controlled in the 16–201 kPa range.
During an isotherm measurement, the pressure ptransducer measured by the pres-sure transducer is the gas prespres-sure at ambient temperature in the gas-handling system, at the height of the reference plane of the pressure balance. In order to obtain the pres-sure p inside the resonator at low-temperature, at the height of the resonator equator, a correction for the hydrostatic pressure head must be applied:
p= ptransducer+∆phydrostatic. (14) The gas path between the pressure balance reference plane and the resonator equator is modelled as 28 approximately straight tube segments i, with unequal lengths. Prior to closing the cryostat at the beginning of the present study, the lengths and spatial orientations of the 28 tube segments were measured, along with the uncertainties in these quantities. In the calculation of the hydrostatic pressure correction∆phydrostatic, the temperature of the gas-handling system is fixed at the ambient temperature mea-sured by the Guildline 9540 thermometer mounted in the base of the pressure bal-ance, the temperature of the copper tube segment heat-sunk to the cryocooler stage 1 is fixed at the temperature measured by the stage 1 control thermometer, and the temperature of the resonator, pressure vessel and copper tube segment attached to the pressure vessel is fixed at T90measured by CSPRT R4794. For the present study,
the hydrostatic head corrections and associated uncertainties are the same (within the listed significant figures) if the thermal gradients along the lengths of the stainless steel tube and bellows inside the cryostat between these measured endpoint temper-atures are estimated using a simple linear approximation or with an approach that takes the temperature dependence of the tube thermal conductivity into account [25, 26]. The overall hydrostatic pressure correction is
∆phydrostatic= −ggravity
∑
i
(ρi∆hi) , (15) in which ggravity is the acceleration due to gravity, ∆hi is the change in height of segment i, andρiis the average gas density in segment i, calculated using the cyclic p→ρ procedure described in section 1.2, and converted from mol·m−3to kg·m−3.
ρivalues are applied cumulatively along the length of the gas path, starting from the measured ptransducer at the pressure balance reference plane. In this way, the overall
∆phydrostaticcorrection is determined to be 49(6) ppm at T90= 24.5561 K, 25(4) ppm at T90= 54.3584 K and 15(2.5) ppm at T90= 83.8058 K, relative to ptransducer.
2.3 Microwave measurements
The overall approach used in the present study to measure and fit the microwave resonances of the quasi-spherical cavity is largely the same as that previously deter-mined to be optimal at NRC, including Levenberg–Marquardt S21resonance triplet fitting, waveguide correction, and second-order “race-track” shape correction [14]. The present study focuses on the first five 1n microwave resonance modes: TM11, TE11, TM12, TE12 and TM13.
Beyond the basic microwave approach published previously [14], several refine-ments have been made. A two-port Agilent N5232A PNA-L network analyzer is used in place of the previous N5230A model, improving signal-to-noise by an order of magnitude, and the 10 MHz reference frequency signal for the network analyzer time base now is provided by a high-performance Caesium frequency standard Cs2150 that is part of the NRC clock ensemble.
The microwave resonance signal is further boosted by increasing the excitation power provided by the network analyzer beyond the−5 dBm used throughout the previous study [14]. Measurements of the microwave-mode-dependent microwave heating of the resonator were performed at low temperatures, where the small heat capacity of copper [27, 28] allows heating effects to be observed. The microwave heating results were then scaled to the temperatures of interest using copper specific heat ratios and used to set bounds on the allowable microwave power.
One other refinement in the analysis of the microwave resonances involves the half-width term g used to correct the measured triplet frequencies f in order to obtain the average half-width-corrected frequency⟨ f + g⟩ that appears in Eq. 7. In the pre-vious study, this correction used the measured half-width gmeasfrom the Lorentzian fit to each peak in a given resonance triplet [14]. In the present study, the calculated half-width gcalcis used instead, in order to reduce mode-dependent effects such as over-coupling of the antennas to the resonating cavity, half-width broadening due to
electrical currents crossing the resonator equatorial seam, and the anomalous skin effect [29]. The half-width gi,calcof a given peak i in a triplet is calculated as [12, 14]
gi,calc= 1 aeq √ fi,wgcorr 4π µ0(µr,CuσCu)× ξ2 corr,i ξ2 corr,i− 2 , TM mode 1, TE mode , (16)
in which fi,wgcorr is the waveguide-corrected centre frequency of peak i,µ0= 4π× 10−7 V·s·A−1·m−1 is the magnetic constant,µr,Cu is the relative magnetic perme-ability of the resonator skin,σCuis the electrical conductivity of the resonator skin, andξcorr,i is the shape-corrected eigenvalue of peak i.µr,CuandσCu are taken from the literature for OFHC copper [27, 30] as expressed in Eqs. 17–20 of Ref. [14], us-ing a zero-frequency, zero-temperature extrapolated conductivity ofσCu, f →0,T →0= 9.34 (1) × 108Ω−1· m−1from the “fixed-temperature” vacuum data set of Ref. [14].
2.4 Isotherm measurement procedure
At each T90 set point, microwave measurements are first performed in vacuum to determine a0separately for each microwave mode. After the vacuum measurements are complete, in-gas measurements are performed on pairs of isotherms: 10 equally-spaced pressures from 20 kPa to 200 kPa on a p-rising isotherm, followed by the same pressures in reverse order on a p-falling isotherm. At each pressure, main data collection consists of 10 microwave scans of each microwave mode performed at each of three different heater 4 offset powers, and again at a repeat of the first offset power. Changing the heater 4 offset power changes the heater 2 power required to maintain the T90set point and allows for later extrapolation of the results to zero heater 2 power to correct for thermal gradient effects.
3 Thermodynamic temperature calculation
3.1 Procedure for determining T from a single microwave scan
The thermodynamic temperature T of the working gas in the resonator cavity and the difference(T − T90) are determined for each microwave scan by the following procedure:
1. Using the average measured pressure p during the scan (corrected for hydrostatic head effects using Eqs. 14 and 15), average measured self-heating-corrected ITS-90 temperature T90 during the scan, and Eqs. 7–8, the experimentally-measured refractive index of the working gas nexptis determined.
2. A golden section search is performed to find the thermodynamic temperature T that minimizes n2expt− n2calc
, the absolute value of the left-hand side of the RIGT working equation Eq. 9, with a 0.1 nK convergence criterion on T .
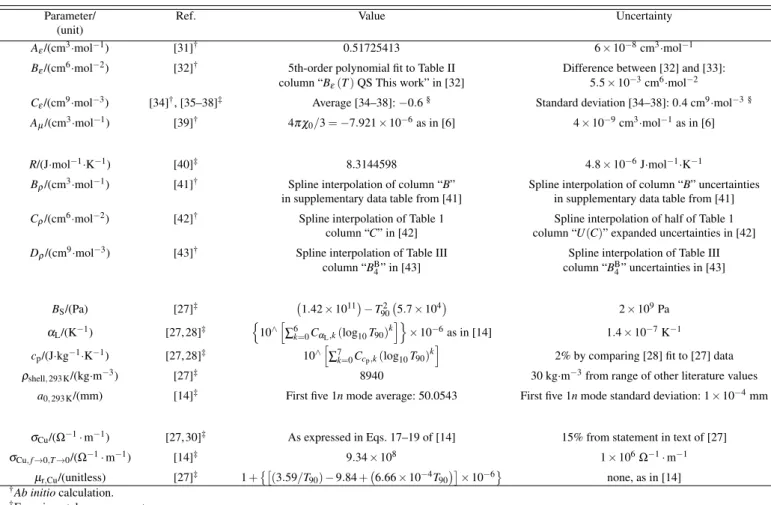
Table 2 Sources, values and uncertainties of the literature parameters used in the determination of T .
Parameter/ Ref. Value Uncertainty
(unit)
Aε/(cm3·mol−1) [31]† 0.51725413 6× 10⁻⁸cm3·mol−1
Bε/(cm6·mol−2) [32]† 5th-order polynomial fit to Table II Difference between [32] and [33]: column “Bε(T ) QS This work” in [32] 5.5 × 10⁻³cm6·mol−2
Cε/(cm9·mol−3) [34]†, [35–38]‡ Average [34–38]:−0.6§ Standard deviation [34–38]: 0.4 cm9·mol−3 §
Aµ/(cm3·mol−1) [39]† 4π χ0/3 = −7.921 × 10⁻⁶as in [6] 4× 10⁻⁹cm3·mol−1as in [6]
R/(J·mol−1·K−1) [40]‡ 8.3144598 4.8 × 10⁻⁶J·mol−1·K−1
Bρ/(cm3·mol−1) [41]† Spline interpolation of column “B” Spline interpolation of column “B” uncertainties in supplementary data table from [41] in supplementary data table from [41]
Cρ/(cm6·mol−2) [42]† Spline interpolation of Table 1 Spline interpolation of half of Table 1 column “C” in [42] column “U(C)” expanded uncertainties in [42]
Dρ/(cm9·mol−3) [43]† Spline interpolation of Table III Spline interpolation of Table III column “BB 4” in [43] column “BB4” uncertainties in [43] BS/(Pa) [27]‡ (1.42 × 10¹¹) − T902(5.7 × 10⁴ ) 2× 10⁹Pa αL/(K−1) [27, 28]‡ { 10∧[∑6 k=0CαL,k(log10T90)k ]} × 10−6as in [14] 1.4 × 10⁻⁷K−1 cp/(J·kg−1·K−1) [27, 28]‡ 10∧ [ ∑7k=0Ccp,k(log10T90)k ]
2% by comparing [28] fit to [27] data
ρshell, 293 K/(kg·m−3) [27]‡ 8940 30 kg·m−3from range of other literature values a0, 293 K/(mm) [14]‡ First five 1n mode average: 50.0543 First five 1n mode standard deviation: 1× 10⁻⁴mm
σCu/(Ω−1· m−1) [27, 30]‡ As expressed in Eqs. 17–19 of [14] 15% from statement in text of [27]
σCu, f →0,T →0/(Ω−1· m−1) [14]‡ 9.34 × 10⁸ 1× 10⁶Ω−1· m−1 µr,Cu/(unitless) [27]‡ 1+{[(3.59/T90) − 9.84 +(6.66 × 10⁻⁴T90)] × 10−6 } none, as in [14] †Ab initiocalculation. ‡Experimental measurement.
§Insufficient literature data to determine temperature dependence, so temperature-independent value assumed.
The sources, values and uncertainties of the literature parameters used in the deter-mination of thermodynamic temperature T are listed in Table 2.
Helium is a special working gas for RIGT experiments, since many of its physical properties, including virial coefficients, can be computed very accurately from first principles. This is reflected in the large number of ab initio values in Table 2. A great deal of work in this area has been done by Szalewicz and collaborators, yielding, for example, a state-of-the-art value for Aε [31] that replaces an earlier calculation by the same group [44]. Following the recommendation of Ref. [31], the values of Bε are taken from Ref. [32], rather than from more recent work by Cencek, Komasa and Szalewicz [45], since the latter used classical, rather than quantum, statistical mechanics. The more recent calculations [45] have, however, resolved [41] a discrep-ancy between Ref. [32] and an earlier independent quantum mechanical calculation of Bε [33] in favour of the results of Ref. [32]; the difference between the
calcula-tions of Refs. [32] and [33] in the temperature range of the present study is used as an estimate of the uncertainty in the value of Bε. For Cε, insufficient literature data exist to determine temperature dependence, so a temperature-independent value is assumed, derived from the average of the only theoretical calculation (at room tem-perature) [34] and several experimental results (at various temperatures) [35–38]; the large uncertainty of Cε comes from the standard deviation of these values, yet con-tributes little to the uncertainty in(T − T90) at the densities used in the present study (see Table 3). The value and uncertainty of Aµ come from an interpretation of the calculation of Ref. [39] presented in Ref. [6]. This value of Aµ agrees with that from a similar interpretation presented in Ref. [31], with a larger uncertainty than esti-mated in Ref. [31]; however, the uncertainty contribution of Aµ to(T − T90) is still negligibly small (see Table 3). In terms of the density virial coefficients, theoretical calculations of Bρ [41] and Cρ [42] have been confirmed by new calculations using a different theoretical technique [43]; however, the former results are used in Table 2 since their quoted uncertainties include the uncertainties in the potentials [41, 42], which are not included in the uncertainties quoted in the latter results [43]. For Dρ, the results of Ref. [43] represent the most complete calculation in the temperature range of interest to the present study.
Knowledge of the compressibility of the resonator is crucial, since it allows the shift of the resonance frequencies due to dimensional changes of the resonator under pressure to be separated from the shift due to refraction by the working gas, as shown in Eq. 7. In the present study, the isothermal compressibilityκTof the polycrystalline OFHC copper resonator shell is calculated using Eq. 8 and the physical properties of copper listed in Table 2, of which the adiabatic bulk modulus BSis the dominant contribution. The literature source for BSis a monograph on the cryogenic properties of copper [27] in which the regression equation is weighted predominantly toward a set of single-crystal elastic constant measurements [46] that have been averaged to convert to equivalent polycrystalline moduli [47] and combined with other polycrys-talline measurements [48, 49]; the standard deviation of 2 GPa reflects the differences between these data sets [27]. Previous measurements at room temperature [12] con-firmed that the isothermal compressibilityκT of the resonator used in the present study agrees well with values calculated from Ref. [27], and temperature-dependent measurements [14] confirmed that the thermal expansion coefficientαLalso agrees well with Ref. [27]. Note that more detailed measurements of the compressibility of a particular resonator artifact at a given temperature, along with estimates of the temperature dependence of the compressibility [50], may in some instances allow the uncertainty due to resonator compressibility to be reduced below that derived from Ref. [27].
3.2 Further data analysis
At each pressure set point on a given isotherm,(T − T90) values obtained from the 40 microwave scans of a given microwave mode are fitted to a straight line as a function of heater 2 power and extrapolated to zero heater 2 power to correct for the thermal gradient effects discussed in section 2.1. The extrapolated(T − T90)
val-ues from the first five 1n microwave resonance modes are then averaged together at each pressure set point to get a single heater-2-power-corrected, mode-averaged (T − T90) value at that pressure for the given isotherm, and then the mode-averaged (T − T90) values from each p-rising/p-falling isotherm pair are averaged together in a “low-uncertainty high-pressure” region in which the pressure-dependent combined uncertainty of(T − T90) has fallen to within 10% of the uncertainty at 200 kPa. The pressure dependence of the(T − T90) uncertainty varies with temperature, so the size of the low-uncertainty high-pressure region that satisfies the 10% criterion differs at the different T90set points investigated in the present study.
4(T − T90) measurement results 4.1 Triple point of neon: T90= 24.5561 K
(T − T90) measurements performed on a pair of isotherms at the temperature of the triple point of neon (T90= 24.5561 K) are shown in Fig. 4, plotted as a function of measurement time: p-rising isotherm in panels (a) and (c), and p-falling isotherm in panels (b) and (d). The small (colour online) open symbols in Fig. 4 (a) and (b) show the “as-measured” results from all of the individual microwave scans (calculated us-ing the procedure from section 3.1), performed at various heater 4 offset powers; whereas the larger black symbols show a single point for each microwave mode ex-trapolated to zero heater 2 power at each pressure on the isotherm. In Fig. 4 (c) and (d), the working gas pressures (solid squares) and heater 2 powers (open circles) used during each isotherm are plotted as a function of measurement time. The cryostat stage 1 temperature T1was maintained within 1 mK of 50 K during these isotherms; since the base temperature of the cryocooler stage 1 is∼ 40 K, a set point of 50 K ensured enough cooling power to maintain stable T1throughout the measurement.
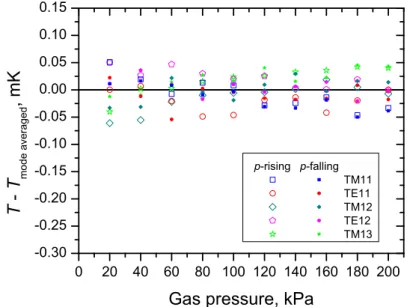
Fig. 5 plots the differences between the extrapolated zero heater 2 power ther-modynamic temperature values T obtained from the five separate 1n microwave modes (also shown as large symbols in Fig. 4 (a) and (b)) and the five-mode aver-ages Tmode averagedat each pressure on each isotherm. The mode-to-mode consistency of the results is within approximately±0.05 mK over the entire pressure range.
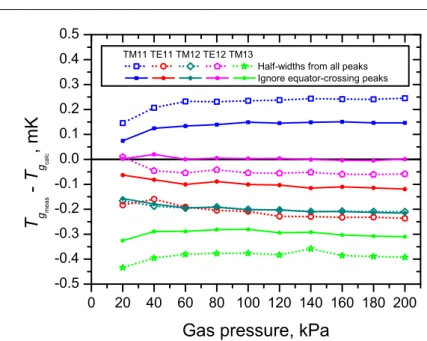
Fig. 6 shows the difference between Tgmeas, obtained using a half-width correction from the measured half-widths gmeasof the peaks in each microwave triplet scan (as in [14]), and Tgcalc, obtained using the default half-width correction of the present study from the Eq. 16 calculated half-widths gcalc. The open symbols were obtained using the separately-measured half-widths from all three peaks in each microwave triplet scan, whereas the closed symbols were obtained with measured half-widths for peaks whose surface currents cross the resonator equatorial seam derived from those of peaks whose surface currents do not cross the equatorial seam. Comparing Figs. 5 and 6, it is apparent that using gcalc rather than gmeas improves the mode-to-mode consistency of the thermodynamic temperature results by up to an order of magnitude. When calculating gcalcwith Eq. 16, changing the value of the electrical conductivity of the resonator skin σCu by its uncertainty changes the obtained thermodynamic temperature T by 5µK or less.
0 20 40 60 80 100120140160180 -1.0 -0.8 -0.6 -0.4 -0.2 0.0 0.2 0.4 as- heater 2 = 0 W measured extrapolation TM11 TE11 TM12 TE12 TM13 T -T 9 0 , m K Time, hours (a) 0 20 40 60 80 100120140160180 0 20 40 60 80 100 120 140 160 180 200 (c) G a s p r e ssu r e , kP a Time, hours 0.0 0.5 1.0 1.5 2.0 2.5 3.0 H e a t e r 2 p o w e r , W 0 20 40 60 80 100 120 140 -1.0 -0.8 -0.6 -0.4 -0.2 0.0 0.2 0.4 (b) as- heater 2 = 0 W measured extrapolation TM11 TE11 TM12 TE12 TM13 T -T 9 0 , m K Time, hours 0 20 40 60 80 100 120 140 0 20 40 60 80 100 120 140 160 180 200 (d) G a s p r e ssu r e , kP a Time, hours 0.0 0.5 1.0 1.5 2.0 2.5 3.0 H e a t e r 2 p o w e r , W
Fig. 4 (T − T90) measurements performed at the temperature of the triple point of neon (T90= 24.5561 K). Panels (a) and (c) show data from the p-rising isotherm, and panels (b) and (d) show data from the subse-quent p-falling isotherm.
0 20 40 60 80 100 120 140 160 180 200 -0.30 -0.25 -0.20 -0.15 -0.10 -0.05 0.00 0.05 0.10 0.15 p-rising p-falling TM11 TE11 TM12 TE12 TM13 T -T m o d e a v e r a g e d , m K
Gas pressure, kPa
Fig. 5 Differences between the extrapolated zero heater 2 power thermodynamic temperature values T obtained from the five separate 1n microwave modes and the five-mode averages at each pressure on each isotherm Tmode averagedat T90= 24.5561 K.
0 20 40 60 80 100 120 140 160 180 200 -0.5 -0.4 -0.3 -0.2 -0.1 0.0 0.1 0.2 0.3 0.4 0.5 TM11 TE11 TM12 TE12 TM13
Half -widths f rom all peaks Ignore equator-crossing peaks
T g m e a s -T g c a l c , m K
Gas pressure, kPa
Fig. 6 Difference between thermodynamic temperature from the T90= 24.5561 K p-rising isotherm ob-tained using measured half-widths gmeasand using the default calculated half-widths gcalc. The open sym-bols were calculated using all three measured half-widths from every microwave triplet scan, whereas the closed symbols were calculated using only the measured half-widths from peaks whose surface currents do not cross the resonator equator.
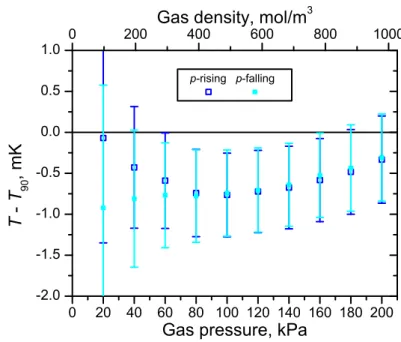
The(T − T90) results from Figs. 4 and 5, analyzed using default parameters and averaged across the first five 1n microwave modes at each pressure, are plotted on the T90= 24.5561 K p-rising and p-falling isotherms in Fig. 7. Uncertainty bars include all uncertainty components discussed in section 4.4, except for the uncertainty com-ponent arising from the final average over the low-uncertainty high-pressure region and that attributed to the data analysis model itself. The agreement between the two isotherms is very good at high pressures. Some residual pressure-dependence of the (T − T90) results remains, attributed to the approximate nature of the pressure trans-ducer drift correction. This is most severe at low pressures, since a pressure offset has a proportionally larger effect there and the low-pressure data points from the p-rising and p-falling isotherms have the furthest separation from one another in terms of data collection time; the low-pressure results, including the splitting between the isotherms, depend sensitively on details of the pressure transducer drift correction.
For the (T − T90) data collected at the temperature of the triple point of neon (T90= 24.5561 K) and shown in Fig. 7, the low-uncertainty high-pressure region (wherein uncertainties are within 10% of the uncertainty at 200 kPa, as per sec-tion 3.2) spans from 80 kPa to 200 kPa. In this region, averaging over the results of the p-rising/p-falling isotherm pair gives(T − T90) = −0.60 ± 0.56 mK.
0 20 40 60 80 100 120 140 160 180 200 -2.0 -1.5 -1.0 -0.5 0.0 0.5 1.0 p-rising p-falling T -T 9 0 , m K
Gas pressure, kPa
0 200 400 600 800 1000 Gas density, mol/m
3
Fig. 7 (T − T90) mode-averaged results from the p-rising/p-falling isotherm pair at the triple point of neon (T90= 24.5561 K). Uncertainty bars include all uncertainty components discussed in section 4.4, except for the uncertainty component arising from the final average over the low-uncertainty high-pressure region and that attributed to the data analysis model itself.
4.2 Triple point of oxygen: T90= 54.3584 K
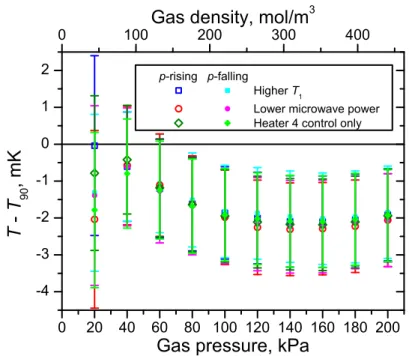
(T − T90) measurements were performed on three pairs of isotherms at the tempera-ture of the triple point of oxygen (T90= 54.3584 K), varying different experimental parameters in order to look for systematic effects: one isotherm pair used a stage 1 temperature set point T15 K higher than the default T1= T90= 54.3584 K used at this temperature, one isotherm pair used a network analyzer microwave power setting four times lower than the default +10 dBm, and one isotherm pair directly used heater 4 for active T90temperature control rather than following the heater 4 offset approach described in sections 2.4 and 3.2.
Measurements from the three pairs of T90= 54.3584 K isotherms were analyzed similarly to the T90= 24.5561 K measurements in section 4.1, and are plotted in Fig. 8. The agreement between all six isotherms is very good, and this shows that the (T − T90) results are insensitive to changes in several key experimental factors:
– The results are not significantly influenced by the stage 1 temperature or a thermal gradient along the gas line, and the hydrostatic head correction of section 2.2 is implemented robustly.
– The results are not significantly influenced by the excitation power of the network analyzer, either via microwave heating of the copper shell of the resonator or direct microwave heating of the working gas.
0 20 40 60 80 100 120 140 160 180 200 -4 -3 -2 -1 0 1 2 p-rising p-falling Higher T 1
Lower microwave power Heater 4 control only
T -T 9 0 , m K
Gas pressure, kPa
0 100 200 300 400 Gas density, mol/m
3
Fig. 8(T − T90) mode-averaged results from the three p-rising/p-falling isotherm pairs at the triple point of oxygen (T90= 54.3584 K). Uncertainty bars include all uncertainty components discussed in section 4.4, except for the uncertainty component arising from the final average over the low-uncertainty high-pressure region and that attributed to the data analysis model itself.
– Using the “coarse control” heater 4 to replace heater 2 entirely in the T90control loop is viable, and when heater 2 is used in the control loop, the data collection and analysis procedure described in sections 2.1, 2.4 and 3.2 to extrapolate the results to zero heater 2 power is working as intended.
As in the T90= 24.5561 K case, some residual pressure-dependence of the (T − T90) results is seen at low pressures, since the simple form of the pressure transducer drift correction does not capture fine details of the transducer offset time dependence.
For the(T − T90) data collected at the temperature of the triple point of oxygen (T90= 54.3584 K) and shown in Fig. 8, the low-uncertainty high-pressure region spans from 80 kPa to 200 kPa. In this region, averaging over the results of all three p-rising/p-falling isotherm pairs gives(T − T90) = −2.0 ± 1.3 mK.
4.3 Triple point of argon: T90= 83.8058 K
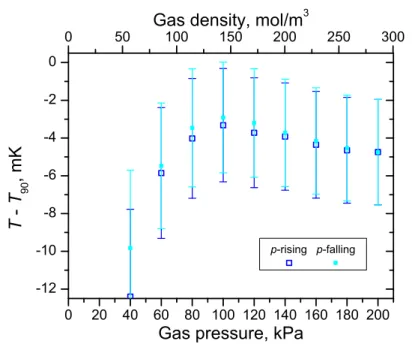
(T − T90) measurements performed on a pair of isotherms at the temperature of the triple point of argon (T90= 83.8058 K) were analyzed similarly to the T90= 24.5561 K measurements in section 4.1 and are plotted in Fig. 9. The cryostat stage 1 tempera-ture set point was maintained at T1= T90= 83.8058 K during these isotherms. Once again, the agreement between the two isotherms is very good at high pressures. As
0 20 40 60 80 100 120 140 160 180 200 -12 -10 -8 -6 -4 -2 0 p-rising p-falling T -T 9 0 , m K
Gas pressure, kPa
0 50 100 150 200 250 300 Gas density, mol/m
3
Fig. 9 (T − T90) mode-averaged results from the p-rising/p-falling isotherm pair at the triple point of argon (T90= 83.8058 K). Uncertainty bars include all uncertainty components discussed in section 4.4, except for the uncertainty component arising from the final average over the low-uncertainty high-pressure region and that attributed to the data analysis model itself.
with the measurements at T90= 24.5561 K and T90= 54.3584 K, residual pressure-dependence of the(T − T90) results remains, especially at low pressures, due to the inexact pressure transducer drift correction.
For the (T − T90) data collected at the temperature of the triple point of argon (T90= 83.8058 K) and shown in Fig. 9, the low-uncertainty high-pressure region spans from 100 kPa to 200 kPa. In this region, averaging over the results of the p-rising/p-falling isotherm pair gives(T − T90) = −4.0 ± 2.9 mK.
4.4 Uncertainty budget
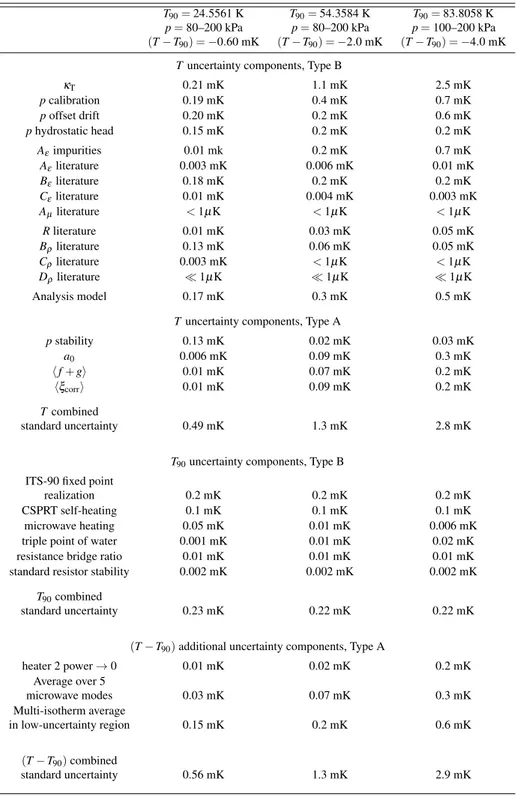
The uncertainty budget for the(T − T90) measurements of sections 4.1, 4.2 and 4.3 is shown in Table 3. The uncertainty contributions listed in Table 3 have been averaged over the first five 1n microwave modes and all isotherms within the respective low-uncertainty pressure regions. Within the gas density ranges measured, the(T − T90) combined standard uncertainties are large at low pressures and asymptote to smaller, pressure-independent values at high pressures; within the low-uncertainty pressure regions this variation of the uncertainty with pressure is less than 10%.
Uncertainty components related to the thermodynamic temperature T are esti-mated using a simplified equation derived from Eq. 9 by directly substituting inρ
Table 3 Uncertainty budget for microwave RIGT(T − T90) determinations.
T90= 24.5561 K T90= 54.3584 K T90= 83.8058 K p= 80–200 kPa p= 80–200 kPa p= 100–200 kPa (T − T90) = −0.60 mK (T − T90) = −2.0 mK (T − T90) = −4.0 mK
Tuncertainty components, Type B
κT 0.21 mK 1.1 mK 2.5 mK pcalibration 0.19 mK 0.4 mK 0.7 mK poffset drift 0.20 mK 0.2 mK 0.6 mK phydrostatic head 0.15 mK 0.2 mK 0.2 mK Aεimpurities 0.01 mk 0.2 mK 0.7 mK Aεliterature 0.003 mK 0.006 mK 0.01 mK Bεliterature 0.18 mK 0.2 mK 0.2 mK Cεliterature 0.01 mK 0.004 mK 0.003 mK Aµliterature < 1µK < 1µK < 1µK Rliterature 0.01 mK 0.03 mK 0.05 mK Bρliterature 0.13 mK 0.06 mK 0.05 mK Cρliterature 0.003 mK < 1µK < 1µK Dρliterature ≪ 1µK ≪ 1µK ≪ 1µK Analysis model 0.17 mK 0.3 mK 0.5 mK
Tuncertainty components, Type A
pstability 0.13 mK 0.02 mK 0.03 mK a0 0.006 mK 0.09 mK 0.3 mK ⟨ f + g⟩ 0.01 mK 0.07 mK 0.2 mK ⟨ξcorr⟩ 0.01 mK 0.09 mK 0.2 mK Tcombined standard uncertainty 0.49 mK 1.3 mK 2.8 mK
T90uncertainty components, Type B ITS-90 fixed point
realization 0.2 mK 0.2 mK 0.2 mK
CSPRT self-heating 0.1 mK 0.1 mK 0.1 mK microwave heating 0.05 mK 0.01 mK 0.006 mK triple point of water 0.001 mK 0.01 mK 0.02 mK resistance bridge ratio 0.01 mK 0.01 mK 0.01 mK standard resistor stability 0.002 mK 0.002 mK 0.002 mK
T90combined
standard uncertainty 0.23 mK 0.22 mK 0.22 mK (T − T90) additional uncertainty components, Type A
heater 2 power→ 0 0.01 mK 0.02 mK 0.2 mK Average over 5 microwave modes 0.03 mK 0.07 mK 0.3 mK Multi-isotherm average in low-uncertainty region 0.15 mK 0.2 mK 0.6 mK (T − T90) combined standard uncertainty 0.56 mK 1.3 mK 2.9 mK
and applying the approximationεr+ 2 ≈ 3: T≈ 3Aεp R { [ c0 2π⟨ f +g⟩a0(⟨ξ1−corrκT p⟩ 3 ) ]2 − 1 } . (17)
The same simplified equation may be derived from Eqs. 10 and 11 by truncating the virial expansion at the first term and neglecting Aµ. Uncertainty components arising from virial coefficients Bε, Cε, Aµ, Bρ, Cρ and Dρ that do not appear in Eq. 17 are obtained by calculating the sensitivity coefficients relating changes in(n2
calc− 1) to changes in each virial coefficient and then converting to uncertainties in T using the T↔(n2
calc− 1) sensitivity coefficient. The T combined standard uncertainty obtained by quadrature combination of the estimated uncertainty components listed in Table 3 is consistent with that obtained by Monte Carlo numerical simulations.
The dominant uncertainty component at all temperatures measured in the present study arises due to the uncertainty in the isothermal compressibility of the resonator
κT. The uncertainty inκTis calculated by propagation of uncertainties in Eq. 8, and is itself dominated by the uncertainty in the adiabatic bulk modulus BSlisted in Ta-ble 2. Although for OFHC copperκTand its uncertainty are only weakly temperature dependent, the contribution of the uncertainty inκTto the absolute uncertainty in the thermodynamic temperature scales approximately as T2, posing challenges for abso-lute RIGT measurements performed at higher temperatures. A different experimental approach has recently been proposed for relative primary RIGT, in which refractive index measurements are performed as a function of temperature on constant-pressure isobars and compared to measurements at a reference temperature [15]. Future imple-mentations of relative RIGT may be less sensitive than absolute RIGT to uncertainties in the compressibility of the resonator and absolute pressure calibration.
The 8 ppm uncertainty contribution due to the calibration of the pressure trans-ducer is dominated by the 6 ppm uncertainty in the effective area of pressure balance piston. The uncertainty due to the correction for the offset drift of the pressure trans-ducer between pressure balance calibrations is calculated by quadrature combination of two sub-components. The first sub-component is an estimated 0.5 Pa uncertainty in the linear-in-time offset drift correction that is applied in the main data analysis of the present study, and corresponds to a 3.8 ppm relative uncertainty averaged over the pressure regimes listed in Table 3. The second sub-component is estimated from the difference between drift correction models using the linear-in-time offset drift approach and the alternate offset drift approach based on vacuum readings of the pressure transducer (corrected for atmospheric pressure drift effects) taken during a0 measurements. When averaged over each pressure regime listed in Table 3 this sec-ond sub-component correspsec-onds to a 7 ppm relative uncertainty at T90= 24.5561 K, 6 ppm relative uncertainty at T90= 83.8058 K, and 1.5 ppm relative uncertainty at
T90= 54.3584 K; the latter measurements were performed close to the time of the July 2016 pressure transducer calibration using the piston gauge, resulting in closer agreement between the two pressure transducer offset drift correction approaches.
As discussed in section 2.2, the uncertainty in the hydrostatic head correction is 6 ppm at T90= 24.5561 K, 4 ppm at T90= 54.3584 K and 2.5 ppm at T90= 83.8058 K.
The uncertainty in the hydrostatic head correction contribution from an individual gas line segment i in Eq. 15 is dominated by the uncertainty in the height change of that segment (calculated from the uncertainties in the length and spatial orienta-tion measurements for that segment), scaled by the average gas density in the seg-ment; thus, the segments that contribute most strongly to the overall hydrostatic head correction uncertainty are those that have large height-change uncertainties near the low-temperature end of the gas line. While the relative uncertainty in thermodynamic temperature due to the overall hydrostatic head correction increases with decreasing isotherm temperature, as expected due to the gas density increasing at the same pres-sures, the density gradients along the gas line cause this uncertainty increase to be weaker than would be the case if the entire length of the gas line was held at the temperature of the resonator, resulting in absolute uncertainty contributions in Ta-ble 3 that decrease slightly with decreasing temperature, similar to what is seen in other experiments [9]. This is especially marked when comparing the lowest temper-ature isotherms to those measured at higher tempertemper-atures, since the former measure-ments have a strong thermal gradient along the gas line segmeasure-ments between the 50 K cryocooler stage 1 and the T90= 24.5561 K resonator, weakening the relative con-tributions of segments with high height-change uncertainties located in that section, whereas the gas line between stage 1 and the resonator is approximately isothermal for the T90= 54.3584 K and T90= 83.8058 K measurements.
The uncertainty contribution due to gas impurities is estimated via the effect on Aεusing a simple mixing rule for polarizabilities [51, 52]:
Pmix=
∑
ixiPi, (18)
where Pmixis the molar polarizability of the gas mixture, and Piis the molar polar-izability of gas component i at mole fraction xi. As discussed in section 2.2, limiting concentrations for gas impurities in the present study are 0.4 ppm for N2, 0.1 ppm for CH4(as an approximation to total hydrocarbon content), 2 ppm for Ne, 0.6 ppm for Ar, 0.5 ppm for Kr, and 0.7 ppm for Xe. Note that negligible vapour pressures for some species at low temperatures [53] mean that only the possible Ne impurity is relevant at T90= 24.5561 K, and the effects of the possible Xe impurity are only significant at T90 = 83.8058 K. Using polarizability values from Ref. [54] for Ne and Ref. [51] for the other impurities species, and applying a rectangular distribu-tion [8], gives uncertainty contribudistribu-tions of 0.5 ppm at T90= 24.5561 K, 4.5 ppm at
T90= 54.3584 K and 8.3 ppm at T90= 83.8058 K.
Uncertainty components on the thermodynamic temperature were also estimated from the uncertainties in the literature values of the virial coefficients listed in Ta-ble 2. The largest of these uncertainty components are those due to the uncertainties in Bεand Bρ. Note that a temperature-independent absolute uncertainty in the value of Bε results in a relative uncertainty contribution to T that is approximately pro-portional to p and inversely propro-portional to T ; therefore at the same pressures, the absolute uncertainty component on T due to Bε is largely independent of tempera-ture. Despite a large uncertainty in Cε (two thirds of its value), the contribution of Cε to the uncertainty in T remains small at the gas densities used in the present study.
The uncertainty of the data analysis model described in section 3.1 is estimated by comparing the results of sections 4.1, 4.2 and 4.3 to those obtained by applying the alternate data analysis model described at the end of section 1.2. The alternate analysis approach yields thermodynamic temperatures that differ from those of the main analysis model by 6.9 ppm at T90= 24.5561 K, 5.5 ppm at T90= 54.3584 K and 6.0 ppm at T90= 83.8058 K.
An uncertainty contribution arising from stability of the gas pressure during the individual microwave scans is included, since changes in pressure affect T but not T90. Pressure and temperature of the working gas are closely linked as in Eq. 4, so small thermal oscillations due to cryocooler cooling pulses disrupt the gas pressure con-trol, leading to reduced pressure stability at the lowest temperature measured in the present study. At higher temperatures, the heat capacity of copper rises greatly [27, 28], causing the large mass of the copper pressure vessel to act as a low-pass filter that efficiently damps out the thermal oscillations. An analogous uncertainty contribution due to temperature stability is not included, because T and T90 are correlated such that temperature fluctuations of the resonator are tracked by both the thermodynamic temperature measurement and ITS-90 temperature measurement, and cancel out of the difference(T − T90).
The a0uncertainty component on T comes from the uncertainty in the microwave determinations of the mode-dependent vacuum radius of the resonator at each tem-perature set point and includes statistical sources such as microwave triplet fitting and zero heater 2 power extrapolation applied specifically to the vacuum measurements. The⟨ f + g⟩ uncertainty component on T arises from the uncertainty in the average half-width-corrected frequency of the microwave triplets measured with gas in the resonator, and it is dominated by the fitting uncertainty of the centre frequencies of the peaks in each microwave triplet. The⟨ξcorr⟩ uncertainty component characterizes the influence on T of the uncertainty in the second-order cavity shape correction to the microwave eigenvalues when gas is in the resonator, stemming from the fitting uncertainty of the separation between the peaks in each microwave triplet (the eigen-value correction due to the presence of waveguides cancels out when taking the ratio of in-gas and vacuum measurements).
The dominant uncertainty component for the measurement of the ITS-90 temper-ature T90 is the 0.2 mK NRC standard realization uncertainty of the ITS-90 neon, oxygen and argon defining fixed points [55]. Contributions to the T90 uncertainty are included from the uncertainty of the CSPRT self-heating correction and from microwave heating of the resonator shell estimated from the low-temperature heat-ing tests described in section 2.3. The uncertainty component propagated from the triple point of water (TPW) is the product of the NRC TPW realization uncertainty for CSPRTs (100µK) and the CSPRT resistance ratio at the temperatures of interest: W= R(T90)/R(273.16 K). The uncertainty component due to the accuracy of the F18 resistance bridge used to measure the CSPRT is estimated from the manufacturer’s claimed ratio uncertainty of 5× 10⁻⁸full scale, which is supported by in-house char-acterization using an Automatic Systems Laboratories ratio test unit and an Aeonz resistance bridge calibrator. A small uncertainty contribution stemming from the sta-bility of the standard reference resistors is estimated from a temperature coefficient of 3 ppm◦C−1and an oil bath stability of 2 m◦C.
Since T and T90, and therefore(T − T90), are measured for each microwave scan, three additional uncertainty components from statistical sources arise due to the pro-cess of aggregating results from the multitude of scans into single(T − T90) values at each temperature set point: a contribution from the uncertainty of the extrapo-lation to zero heater 2 power of the (T − T90) data from each microwave mode at each pressure on a given isotherm, a contribution from the standard deviation of the zero-heater-2-power(T − T90) data averaged over the first five 1n microwave modes at each pressure on a given isotherm, and a contribution from the standard devia-tion of the mode-averaged(T − T90) data averaged in the low-uncertainty pressure region across all isotherms at a given temperature set point (one pair of isotherms at T90= 24.5561 K and 83.8058 K, and three pairs of isotherms at T90= 54.3584 K).
Combining the uncertainty components in quadrature from all sources listed in Table 3 gives combined standard uncertainties on (T − T90) of 0.56 mK at T90 = 24.5561 K, 1.3 mK at T90= 54.3584 K and 2.9 mK at T90= 83.8058 K.
5 Summary
The primary thermometry technique of microwave refractive index gas thermometry (RIGT) has been implemented at NRC and used to measure thermodynamic temper-ature between 24.5 K and 84 K at tempertemper-atures corresponding to three ITS-90 defin-ing fixed points. The measurements employed a quasi-spherical copper resonator, pulse-tube cryostat and a newly-constructed gas-handling system, with helium as the working gas. Corrections were applied for capsule thermometer self-heating, thermal gradients, pressure transducer offset drift, hydrostatic head effects, resonator cavity shape, and finite conductivity of the resonator shell.
The measurements reported in the present study indicate that the ITS-90 tem-perature T90 deviates from thermodynamic temperature T as(T − T90) = −0.60 ± 0.56 mK at T90= 24.5561 K, (T − T90) = −2.0 ± 1.3 mK at T90= 54.3584 K, and (T − T90) = −4.0 ± 2.9 mK at T90= 83.8058 K. These results are plotted in Fig. 10 and agree with previously reported measurements from other primary thermometry techniques of acoustic gas thermometry [5] and dielectric constant gas thermome-try [9].
Data analysis of the isotherms measured at T90= 24.5561 K highlights the im-portance of using calculated half-widths gcalcrather than measured half-widths gmeas to obtain good agreement between different microwave modes when applying a cor-rection for finite conductivity of the resonator shell. A comparison of several sets of isotherms measured with differing experimental parameters at T90= 54.3584 K in-dicates that the present(T − T90) measurements are insensitive to a thermal gradient along the gas line or to microwave heating effects.
Acknowledgements The author would like to thank the National Institute of Standards and Technology (NIST) for the loan of the copper resonator used in this study; T.A. Quance and D.W. Woods for technical assistance with the gas-handling system and pressure balance; I. Yang for mass spectrometer gas analysis; and L. Pitre, M. de Podesta, M. Moldover, R.M. Gavioso, C. Gaiser, J.W. Schmidt, K.D. Hill, A.D.W. Todd and S.N. Dedyulin for useful discussions.
0 10 20 30 40 50 60 70 80 90 100 -7 -6 -5 -4 -3 -2 -1 0 1 AGT, Ref. [5] DCGT, Ref [9]
RIGT, present NRC study
T -T 9 0 , m K T 90 , K
Fig. 10 Comparison of(T − T90) measured by microwave refractive index gas thermometry in the present study with previous results from acoustic gas thermometry [5] and dielectric constant gas thermometry [9].
References
1. H. Preston-Thomas, Metrologia 27, 3 (1990). doi:10.1088/0026-1394/27/1/002 2. H. Preston-Thomas, Metrologia 27, 107 (1990). doi:10.1088/0026-1394/27/2/010
3. J. Fischer, M. de Podesta, K.D. Hill, M. Moldover, L. Pitre, R. Rusby, P. Steur, O. Tamura, R. White, L. Wolber, Int. J. Thermophys. 32, 12 (2011). doi:10.1007/s10765-011-0922-1
4. R.M. Gavioso, D.M. Ripa, P.P.M. Steur, C. Gaiser, T. Zandt, B. Fellmuth, M. de Podesta, R. Under-wood, G. Sutton, L. Pitre, F. Sparasci, L. Risegari, L. Gianfrani, A. Castrillo, G. Machin, Phil. Trans. R. Soc. A 374, 20150046 (2016). doi:10.1098/rsta.2015.0046
5. L. Pitre, M.R. Moldover, W.L Tew, Metrologia 43, 142 (2006). doi:10.1088/0026-1394/43/1/020 6. M.R. Moldover, R.M. Gavioso, J.B. Mehl, L. Pitre, M. de Podesta, J.T. Zhang, Metrologia 51, R1
(2014). doi:10.1088/0026-1394/51/1/R1
7. R. Underwood, M. de Podesta, G. Sutton, L. Stanger, R. Rusby, P. Harris, P. Morantz, G. Machin, Phil. Trans. R. Soc. A 374, 20150048 (2016). doi:10.1098/rsta.2015.0048
8. C. Gaiser, T. Zandt, B. Fellmuth, Metrologia 52, S217 (2015). doi:10.1088/0026-1394/52/5/S217 9. C. Gaiser, B. Fellmuth, N. Haft, Metrologia 54, 141 (2017). doi:10.1088/1681-7575/aa5389 10. A.R. Colclough, Metrologia 10, 73 (1974). doi:10.1088/0026-1394/10/2/006
11. R.L. Rusby, Inst. Phys. Conf. Ser. for Eur. Conf. on Temp. Meas. 26, 44 (1975).
12. E.F. May, L. Pitre, J.B. Mehl, M.R. Moldover, J.W. Schmidt, Rev. Sci. Instrum. 75, 3307 (2004). doi:10.1063/1.1791831
13. J.W. Schmidt, R.M. Gavioso, E.F. May, M.R. Moldover, Phys. Rev. Lett. 98, 254504 (2007). doi: 10.1103/PhysRevLett.98.254504
14. P.M.C. Rourke, K.D. Hill, Int. J. Thermophys. 36, 205 (2015). doi:10.1007/s10765-014-1728-8 15. B. Gao, L. Pitre, E.C. Luo, M.D. Plimmer, P. Lin, J.T. Zhang, X.J. Feng, Y.Y. Chen, F. Sparasci,
Measurement 103, 258 (2017). doi:10.1016/j.measurement.2017.02.039 16. M.R. Moldover, J. Res. Natl. Inst. Stand. Technol. 103, 167 (1998).
17. A.G. Steele, The International Seminar on Low Temperature Thermometry and Dynamic Temperature
Measuremented A Szmyrka-Grzebyk (Wroclaw, Poland), pp L48–53 (1997). 18. P.M.C. Rourke, Metrologia 53, L1 (2016). doi:10.1088/0026-1394/53/2/L1