HAL Id: hal-01864170
https://hal.archives-ouvertes.fr/hal-01864170v2
Submitted on 31 Aug 2018HAL is a multi-disciplinary open access
archive for the deposit and dissemination of sci-entific research documents, whether they are pub-lished or not. The documents may come from
L’archive ouverte pluridisciplinaire HAL, est destinée au dépôt et à la diffusion de documents scientifiques de niveau recherche, publiés ou non, émanant des établissements d’enseignement et de
Microtubule Dynamics Scale with Cell Size to Set
Spindle Length and Assembly Timing
Benjamin Lacroix, Gaelle Letort, Laras Pitayu, Jeremy Sallé, Marine
Stefanutti, Gilliane Maton, Anne-Marie Ladouceur, Julie Canman, Paul
Maddox, Amy Maddox, et al.
To cite this version:
Benjamin Lacroix, Gaelle Letort, Laras Pitayu, Jeremy Sallé, Marine Stefanutti, et al.. Microtubule Dynamics Scale with Cell Size to Set Spindle Length and Assembly Timing. Developmental Cell, Elsevier, 2018, 45 (4), pp.496-511.e6. �10.1016/j.devcel.2018.04.022�. �hal-01864170v2�
Microtubule Dynamics Scale with Cell Size to Set Spindle Length and Assembly Timing
Authors:
Benjamin Lacroix1*, Gaëlle Letort2, Laras Pitayu1, Jérémy Sallé1, Marine Stefanutti1, Gilliane Maton1, Anne-Marie Ladouceur3, Julie C. Canman4, Paul S. Maddox3, Amy S. Maddox3, Nicolas Minc1, François Nédélec5* & Julien Dumont1,6*
Affiliations:
1Institut Jacques Monod, CNRS, UMR 7592, University Paris Diderot, Sorbonne Paris Cité, F-75205, Paris, France.
2Institut Curie, Mines Paris Tech, Inserm, U900, PSL Research University, F-75005, Paris, France.
3Department of Biology, University of North Carolina, Chapel Hill, NC 27599, USA.
4Columbia University Medical Center, Department of Pathology and Cell Biology, New York, NY 10032, USA.
5Cell Biology and Biophysics Unit, European Molecular Biology Laboratory, 69117 Heidelberg, Germany.
6Lead contact
Summary
Successive cell divisions during embryonic cleavage create increasingly smaller cells, so intracellular structures must adapt accordingly. Mitotic spindle size correlates with cell size, but the mechanisms for this scaling remain unclear. Using live cell imaging, we analyzed spindle scaling during embryo cleavage in the nematode Caenorhabditis elegans and sea urchin
Paracentrotus lividus. We reveal a common scaling mechanism, where the growth rate of
spindle microtubules scales with cell volume, which explains spindle shortening. Spindle assembly timing is however constant throughout successive divisions. Analyses in silico suggest that controlling the microtubule growth rate is sufficient to scale spindle length and maintain a constant assembly timing. We tested our in silico predictions to demonstrate that modulating cell volume or microtubule growth rate in vivo induces a proportional spindle size change. Our results suggest that scalability of the microtubule growth rate when cell size varies adapts spindle length to cell volume.
Introduction
Eukaryotic cells range in size over six orders of magnitude. Regardless of size from the smallest unicellular eukaryote Ostreococcus tauri (<1 µm) to long motor neurons (>1 m long), all cells contain a common set of organelles and subcellular structures. This requirement mandates a strict scaling between these intracellular components and cell size. One striking example of this scaling is the progressive decrease in cell volume that occurs during cleavage of early embryos. Early embryonic development usually occurs without an increase in the overall embryo volume. Each round of cell division halves the size of blastomeres, so blastomere volume can decrease by two orders of magnitude from single celled-zygotes to multicellular gastrulae (O'Farrell et al., 2004). Thus, intracellular structures and organelles must adapt to this wide range of cell dimensions by adjusting their spatial distribution and/or size to remain functional (West and Brown, 2005). Organelles known to exhibit size adaptation to cell volume variations include nuclei, cilia, endoplasmic reticulum, and cytoskeletal assemblies like the metaphase spindle (reviewed in Chan and Marshall, 2010, 2012; Levy and Heald, 2012; Marshall, 2015b; Reber and Goehring, 2015).
The metaphase spindle is a bipolar structure composed of highly dynamic microtubules. Adapting spindle length to cell volume enables accurate chromosome segregation and spindle orientation to accommodate different scales (Dumont and Mitchison, 2009a; Holmfeldt et al., 2006; Lancaster et al., 2013). Spindle length scaling among different organisms can occur through biochemical variations in cytoplasmic content. For example, a single amino-acid change in the microtubule-severing protein katanin primarily accounts for the spindle length difference observed between oocytes from Xenopus laevis and the smaller closely related frog Xenopus
different sized blastomeres from a given species is assumed to be constant (Mitchison et al., 2015). During cleavage of the large X. laevis embryo, spindle length remains constant for the first five divisions and then decreases linearly with blastomere radius for the next 5-7 divisions (Wuhr et al., 2008). In contrast, the smaller C. elegans embryo shows spindle length proportional to cell length from the first division throughout cleavage (Decker et al., 2011; Hara and Kimura, 2009, 2013). Seminal experiments using artificially encapsulated extracts from X. laevis oocytes or embryos demonstrated that spindle length directly corresponds to the size of the encapsulating droplet (Good et al., 2013; Hazel et al., 2013). These experiments accurately recapitulated the spindle scaling observed in intact embryos with a linear relationship between spindle length and droplet radius in small droplets and an upper limit to spindle length in large droplets. Intrinsic spindle mechanisms, such as balancing force between opposed motors, may account for the upper limit of spindle length scaling (Dumont and Mitchison, 2009a, b; Reber and Goehring, 2015). In contrast, spindle extrinsic mechanisms, such as component limitation, have been proposed to explain how different cytoplasm volumes with a given composition may produce different spindle lengths (Goehring and Hyman, 2012; Marshall, 2015a; Mitchison et al., 2015; Reber and Goehring, 2015; Reber and Hyman, 2015). In C. elegans early embryos, decreasing spindle length correlates with a progressive reduction in the amount of centrosomal components and with a decaying gradient of the microtubule-associated protein TPXL-1 (ortholog of TPX2) along spindle microtubules (Greenan et al., 2010). Experiments performed in Xenopus egg or embryo extracts suggest that titration of tubulin heterodimers, limited amount/activity of the microtubule polymerase XMAP215, or cortical sequestration of Importin α, the negative regulator of the microtubule depolymerase KIF2A, could participate in spindle length scaling
(Reber et al., 2013; Wilbur and Heald, 2013). Yet, it remains unclear how the limited supply of these factors controls spindle size.
The limited supply or local inactivation of key factor(s) could directly regulate spindle microtubule dynamics to efficiently control spindle length (Andersen, 2000; Andersen et al., 1997; Desai and Mitchison, 1997; Goshima et al., 2005b; Picone et al., 2010; Tournebize et al., 2000; Verde et al., 1992). Both in vitro and in vivo, microtubules alternate between phases of growth and shrinkage in a process called dynamic instability (Mitchison and Kirschner, 1984). Four parameters define these dynamic properties of microtubules, the velocities of growth and shrinkage and the frequencies of transitions between these two states called catastrophe and rescue (Kirschner and Mitchison, 1986; Walker et al., 1988). Typically, long interphasic microtubules display low catastrophe and high rescue frequencies (Belmont et al., 1990; Verde et al., 1992; Verde et al., 1990). Microtubules in this state are “unbounded” and continuously elongate over time. In contrast, microtubules shorten upon mitotic entry, due to a sharp increase in catastrophe frequency and a significant decrease in rescue events. In this “bounded” regime, microtubules tend to disassemble, and their average growth velocity, termed J, is negative. A steady population of microtubules can only be maintained because a finite fraction is continuously nucleated de novo (Mitchison et al., 2015; Verde et al., 1992). This regime establishes a distribution of microtubule lengths to dictate a steady state spindle size. Therefore, precise control of microtubule dynamics during mitosis in cleaving embryos becomes an attractive candidate to adjust spindle length for blastomere size. However, the functional link between microtubule dynamics and spindle length scaling as a function of cell volume during embryo cleavage remains unknown.
Results
Microtubule Dynamics are Modulated During C. elegans Embryo Cleavage
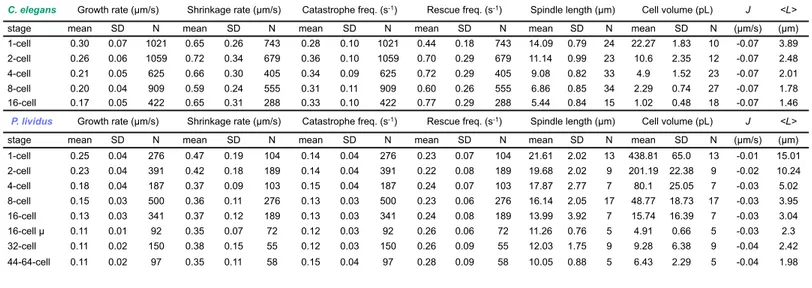
We first determined the potential relationship among metaphase spindle length, cell volume, and microtubule dynamics from the 1- to the 16-cell stage in cleaving C. elegans embryos. We combined high-temporal single plane confocal microscopy and 2-photon 3D-volumetric reconstructions of live embryos expressing GFP-tagged microtubules or a plasma membrane marker respectively (Figure 1A and S1A,B). In line with previous studies, we found that spindle length and cell volume progressively decreased in a sub-proportional manner across early embryogenesis in C. elegans (Figure S1C-F) (Decker et al., 2011; Greenan et al., 2010; Hara and Kimura, 2009, 2013). To determine if microtubule dynamics vary concomitantly with spindle length and cell volume, we generated kymographs of individual microtubules from our high frame-rate, single-plane confocal series of embryos expressing GFP-tagged β-tubulin (Figure 1B). This approach allowed us to identify phases of elongation and shortening and to measure the rate and duration of individual phases for all analyzed microtubules. We observed that microtubule growth rates and durations were significantly higher for astral microtubules than spindle microtubules in all blastomeres from the 1- to the 16-cell stage, in agreement with published results for the one-cell stage (Figure 1C) (Srayko et al., 2005). In addition, we found that microtubule dynamics’ parameters for both types of microtubules varied throughout development. While we found a notable but mild decrease in shrinkage duration between the 1- and the 16-cell stage, the most striking variation across divisions was the continuous and significant decrease in microtubule growth rate for both astral and spindle microtubules (Figure 1C). Importantly, we obtained similar rates and frequencies using a different promoter to drive
Table S1). These results suggest that microtubule dynamics vary throughout early embryonic divisions, with a distinct decrease in the microtubule growth rate associated with decreased blastomere volume.
To investigate a potential link between these variations in microtubule dynamics and spindle length, we first determined if the length of metaphase spindles reached a steady state or if they were limited by the duration of the cell cycle and the time available before anaphase onset. Indeed, cell divisions in cleaving embryos of most species are particularly rapid, and spindle length increases continuously from nuclear envelope breakdown (NEBD) to anaphase onset (Mitchison et al., 2015). However, delaying anaphase onset in C. elegans embryos using a proteasome inhibitor did not induce spindle elongation above the normal metaphase spindle length at any analyzed stage (Figure 1D,E) (Labbe et al., 2004). Moreover, the measured microtubule dynamics parameters indicate that all microtubules are in the “bounded” regime (J<0) at every stage of embryo cleavage, which is compatible with a steady state (Figure S2B and Table S1A,C) (Verde et al., 1992). These results suggest that mitotic spindles in early C.
elegans embryos reach a steady state length before anaphase onset that is independent of the
duration of mitosis. Overall, our results demonstrate that microtubule dynamic instability evolves during embryo cleavage with the microtubule growth rate continuously decreasing in parallel with the progressive reduction of steady state spindle length.
Spindle Microtubule Growth Rate Adapts to Cell Volume in C. elegans
We next asked if variations in microtubule dynamics parameters during early embryogenesis were either a direct consequence of cell size changes or under the control of a
microtubule dynamics parameters (Figure 2A,B). This analysis revealed that the growth rate of spindle microtubules most significantly correlated with cell volume (Figure 2B). So, we tested if the decrease in cell volume of dividing blastomeres solely accounted for this relationship or if cell fate patterning and developmental timing also contributed. Since C. elegans zygotes divide asymmetrically, patterning is already established at the 2-cell stage by asymmetric distribution of cell fate determinants (Nance, 2005; Rose and Kemphues, 1998). The first division of the C.
elegans zygote produces a large anterior AB blastomere from which most somatic tissues emerge
and a small posterior P1 blastomere from which the germline originates (Figure 2A) (Sulston et al., 1983). We used a fast acting temperature sensitive (ts) mutant of formin CYK-1 to induce cytokinesis failure in the zygote (Figure 2C) (Canman et al., 2008; Davies et al., 2014). In control 2-cell stage embryos, AB and P1 blastomeres display shorter spindles than the 1-celled zygote, which correlates with slower microtubule growth in both blastomeres (Figure 2D). At the restrictive temperature (25°C), cyk-1(ts) mutant zygotes exhibit cytokinesis failure and form abnormal one-cell embryos that kinetically correspond to 2-cell stage embryos but possess the cytoplasmic content and cell fate determinants of both AB and P1 blastomeres. These abnormal embryos assembled tetrapolar spindles with microtubules that grew at a rate indistinguishable from normal one-cell zygotes (Figure 2C,D). Thus cell fate determinants and developmental timing do not make a major contribution to set the spindle microtubule growth rate in cleaving C.
elegans embryos. To further demonstrate the effect of cell volume on spindle microtubule
growth rate, we generated abnormally large zygotes. We generated embryos depleted of the fucosyltransferase C27D9.1, which does not have any known direct effect on microtubules and leads to the formation of abnormally large embryos (Hara and Kimura, 2009; Sonnichsen et al.,
rate of spindle microtubules than in control normal-sized zygotes (Figure 2C,D). Altogether, these results show that the observed progressive reduction in the growth rate of spindle microtubules is directly linked to cell volume during embryonic cleavage and independent of developmental timing or cell fate.
Spindle Length Scales with Microtubule Growth Rate in C. elegans
We then asked if variations between dynamics parameters of astral and spindle microtubules and cell volume could underlie spindle length scaling during early embryogenesis. Strikingly, we found that the growth rate of both astral and spindle microtubules was the only parameter exhibiting a distinct, continuous and linear relationship with spindle length throughout cleavage (Figure 3A-C). This observation suggests that modulating the growth rate of one or both microtubule populations could be a key determinant for spindle length adaptation in cleaving embryos. However, analysis of this scaling in C27D9.1-depleted extra-large zygotes revealed that only spindle microtubule growth rate increased with spindle length (Figure 3B), while astral microtubule growth rate remained similar to controls (Figure 3C and Figure S1G,H) (0.41±0.08 µm/s versus 0.40±0.09 µm/s, p=0.087 unpaired t-test). These results suggest that spindle, but not astral, microtubule dynamics determine spindle length in cleaving embryos.
As the growth rate of spindle microtubules decreased progressively with cell volume during embryo cleavage and concomitant with spindle length, we hypothesized that modulating this parameter is sufficient to scale spindle length to cell volume during embryo cleavage. We calculated the average length <L> predicted from microtubule dynamics parameters (Figure 3D, S2B,C and Table S1) (Verde et al., 1992). In control embryos, <L> scaled linearly with our
that spindle length is a multiple of <L> and that the multiplicative factor remains relatively constant as cell size evolves. Interestingly, the predicted average length <L> of spindle microtubules in C27D9.1-depleted embryos fitted well with the abnormally long spindles in these extra-large zygotes. Thus, spindle length varies proportionally to the overall microtubule dynamics in cleaving embryos. Since rescue frequency is low but catastrophe frequency and shrinkage rate are almost constant in cleaving C. elegans embryos, our results demonstrate that <L> is primarily determined by the microtubule growth rate (Figure 3B,D and Table S1). Our results support the idea that spindle microtubule growth rate is a key regulator to scale spindle length to cell volume.
To directly test this hypothesis, we experimentally reduced spindle microtubule growth rate in zygotes and measured spindle length. We analyzed zygotes partially depleted of the microtubule-associated protein (MAP) CLS-2 (ortholog of CLASP, Figure 3A-C) (Cheeseman et al., 2005; Espiritu et al., 2012), since CLS-2 promotes microtubule assembly in vitro and in vivo (Maton et al., 2015). Consistent with this, in partial cls-2(RNAi) conditions, spindle microtubules displayed a significantly reduced growth rate compared to in control zygotes (0.25±0.06 versus 0.3±0.07 µm/s, p<0.001 unpaired t-test) (Figure 3B and Table S1). Rescue frequency also slightly increased, while catastrophe frequency and shrinkage rate remained unaltered. As we predicted, abnormally short but functional spindles assembled under this condition. Strikingly, both the average theoretical length of microtubules <L> and spindle length in these depleted zygotes were concomitantly reduced to levels corresponding to that of 4-cell stage control blastomeres (Figure 3B-D). Taken together, our results show that microtubule dynamics parameters, specifically the growth rate of spindle microtubules, vary proportionally to cell
Spindle Length and Microtubule Growth Rate Scale with Cell Volume in the Sea Urchin P.
lividus
We next wondered whether the scaling relationship among cell volume, spindle length, and microtubule growth rate identified in C. elegans also takes place in other species. Sea urchin (Paracentrotus lividus) embryos are approximately 20 times larger in volume than C. elegans embryos. P. lividus zygotes are spherical and divide symmetrically and synchronously until the 8-cell stage (Figure 4A) (Agrell, 1956; Parisi et al., 1978). First, we microinjected P. lividus eggs with fluorescently labeled tubulin (ATTO 565-tubulin, Figure S3A-F), which then underwent fertilization. We examined the first six rounds of embryonic cleavages by live confocal microscopy (Movie S1 and S2). Consistent with previous reports for other echinoderms (Crowder et al., 2015), spindle length and cell volume progressively decreased across early embryogenesis in P. lividus (Figure S3G-H and Table S2). Spindle lengths measured in ATTO 565-tubulin injected live embryos were indistinguishable from those in control non-injected fixed embryos (Figure S3B,D). To determine if microtubule dynamics also varied concomitantly with spindle length and cell volume, we generated kymographs of individual microtubules to measure spindle microtubule dynamics parameters. In line with our results from C. elegans embryos, microtubule dynamics parameters varied during P. lividus cleavage, but the overall microtubule dynamics remained in the bounded regime at every stage (Figure 4B and Table S2). We observed a continuous and significant decrease in the growth rate of spindle microtubules across P. lividus embryo cleavage (Figure 4B). This decrease correlated with the progressive reduction in blastomere volume and spindle length (Figure 4C,D). We observed similar spindle lengths and growth rates using another fluorescent microtubule probe (the 3XmCherry-tagged
These results suggest that microtubule growth rate is a key determinant of spindle length in cleaving sea urchin embryos. Importantly, both spindle length and spindle microtubule growth rate were comparable in vegetal micromeres (which result from strong asymmetric division at the 8-cell stage and inherit a fate determining polar domain (Angerer and Angerer, 2000; Davidson et al., 1998)) and in 32-cell stage blastomeres at the animal pole (p=0.85 unpaired t-test, Figure 4A,B). Thus, cell volume, but not cell fate or developmental timing, appears to dictate spindle microtubule growth rate and consequent spindle size in cleaving P. lividus embryos, as we found for C. elegans. We conclude that this scaling principle operates across a 500-fold change in cell volume and could potentially represent an evolutionarily conserved feature of cleaving embryos.
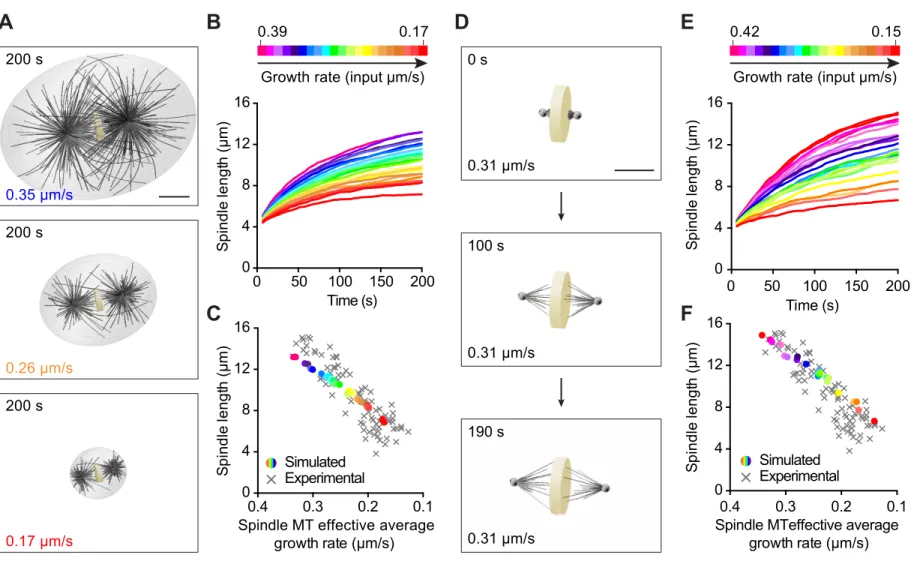
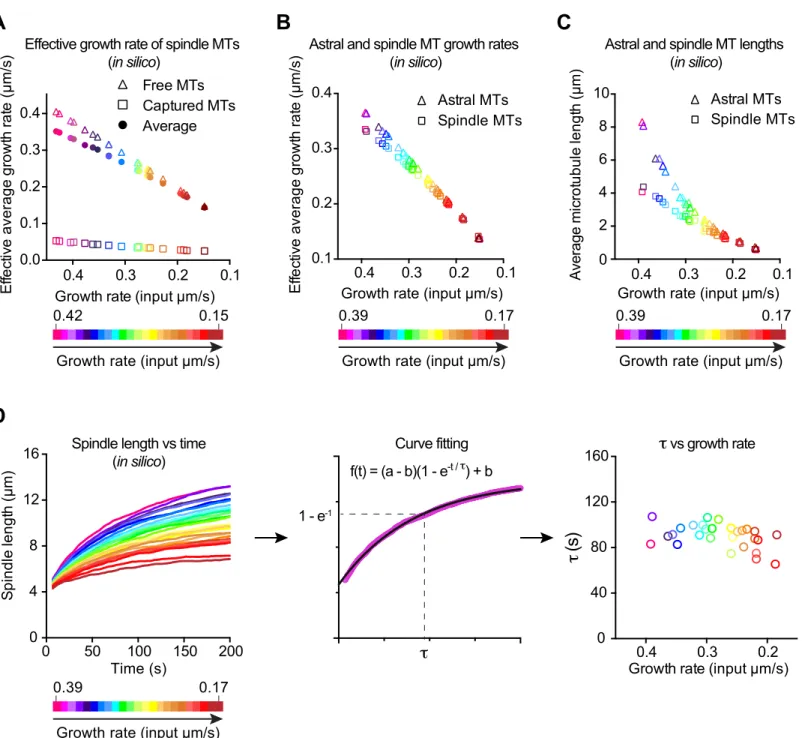
3D Simulations Reproduce Spindle Length Scaling with Microtubule Growth Rate
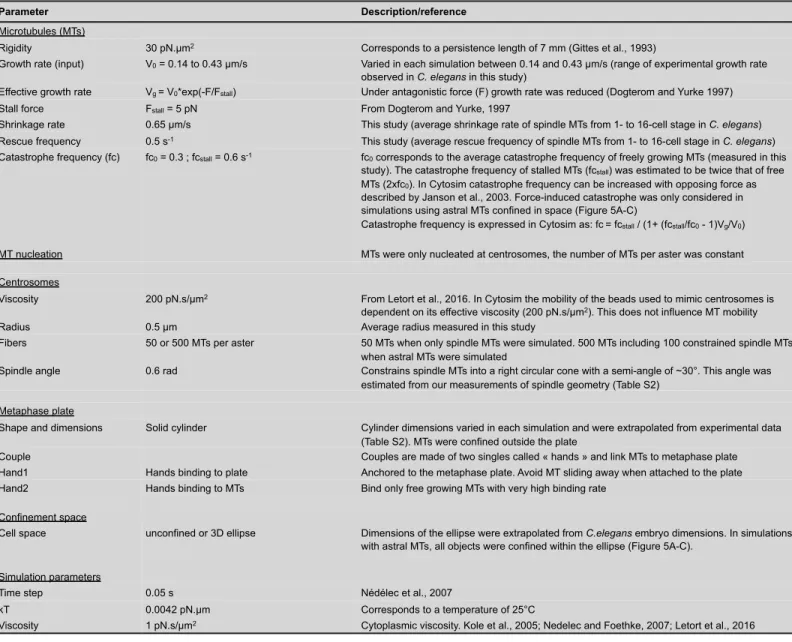
To directly test if modulating only microtubule growth rate is sufficient to explain the observed spindle length scaling, we utilized computer simulations. Using the cytoskeletal simulator Cytosim to develop a three-dimensional spindle model, we examined the contribution of the microtubule growth rate on spindle size in a dose-dependent manner in silico (www.cytosim.org; Nedelec F, 2007). We modeled each spindle pole as an aster composed of a preset number of microtubules that can grow, shrink, and stochastically undergo catastrophe and rescue (Figure 5A and S4, see detailed parameters in Table S3 and Methods). We constructed two asters by distributing a subset of these microtubules evenly and then confining the remaining microtubules within a cone to account for the higher microtubule density directed toward the metaphase plate in C. elegans spindles. We represented the metaphase plate itself using a fixed
measurements, we scaled cell volume, metaphase plate thickness and spindle width linearly with respect to the input growth rate (Table S2B). Microtubules are confined inside the cell volume, and growing plus-ends contacting the cell boundaries can create pushing forces leading to aster centration. Similarly, growing microtubules emanating from the two centrosomes, and contacting the metaphase plate, can generate forces that would push spindle poles apart leading to spindle elongation. To ensure that spindle pole movements would strictly occur through growing microtubules pushing on the cell cortex or on the metaphase plate, we omitted microtubule motors from this model. We analyzed the effects of modulating the microtubule growth rate as a function of cell volume, while keeping the three other microtubule dynamics parameters constant. We tested the physiological range of microtubule growth rates that we measured in vivo in C. elegans (Table S1). In this first set of simulations, the spindle length (pole-to-pole distance) trended toward a plateau over time for every tested microtubule growth rate (Figure 5B and Movie S3). Consistent with our hypothesis, the steady state spindle length decreased concomitantly with the microtubule growth rate (Figure 5C). Overall, the spindle lengths calculated in silico were in good agreement with our experimental measurements (Figure 5C), which confirms that this simple model accurately recapitulated the in vivo relationship between microtubule growth rate and spindle length.
Since our experimental data suggested that spindle length correlates with spindle but not astral microtubule dynamics, we tested if a simulation devoid of cell boundary and astral microtubules could reproduce the relationship between spindle length and microtubule growth rate (Figure 5D). With this modified model, we tested a range of microtubule growth rates, while keeping all other parameters constant (Figure 5E and Movie S4). We did find that spindle length
values and scaling slopes as in our experiments (Figure 5F). This model exhibited the correct multiplicative factor between <L> and spindle length, which suggests that this scaling factor only depends on the geometrical dimensions of the system (i.e. cell size and/or dimensions of the metaphase plate) included in the simulation. Together, these findings suggest that modulating spindle microtubule growth rate is sufficient to scale spindle size with cell volume in cleaving embryos.
Spindle Assembly and Microtubule Growth Rates Proportionally Correlate with Constant Spindle Assembly Timing During Embryo Cleavage
An interesting finding from our 3D simulations was that spindle length reached steady state within a timeframe that was independent of microtubule growth rate or final spindle size (Figure 5B, E and S4D). So, our simulations predict that shorter spindles would not assemble faster than longer ones. To test if this occurred in vivo, we compared spindle lengths at various stages of C. elegans cleavage with the timing of spindle assembly (Figure 6A and Movie S5). Since spindle length continuously increases from NEBD to anaphase onset in C. elegans embryos, we approximated spindle assembly timing as the duration between NEBD and anaphase onset. We found that the timing of spindle assembly was independent of the initial distance between centrosomes or final spindle length (Figure 6B). Although spindle assembly took slightly longer in the 1-celled zygote than in subsequent stages, spindle assembly durations stayed relatively constant over the first five rounds of embryonic division, despite the progressive decrease in spindle length at each division. We also observed a progressive decrease of the spindle assembly rate, which strongly correlated with the decreasing spindle length and
and D). These results agree with the predictions from our simulations. Therefore, the progressive decrease of the microtubule growth rate is sufficient to regulate the constant timing of spindle assembly in cleaving embryos.
Discussion
In summary, we have explored the dynamic properties of microtubules as cell size decreases in early cleaving embryos. Using the nematode C. elegans and the sea urchin P.
lividus, our results establish that the growth rate of spindle microtubules in both species is the
primary parameter of dynamic instability that decreases proportionally to cell volume and concomitantly with spindle length. Using an in silico 3D spindle model, we demonstrate that decreasing the microtubule growth rate proportionally to cell volume is sufficient to control spindle size and recapitulates the principal features of spindle scaling observed in vivo. Our results suggest a simple mechanism to adjust spindle length with varying cell volume, as typically found in early embryonic development. Importantly, our results elucidate how spindle assembly timing is constant among different blastomere sizes in early embryos. This mechanism may be crucial to prevent chromosome segregation defects (Holmfeldt et al., 2006; Lancaster et al., 2013; Mitchison et al., 2015).
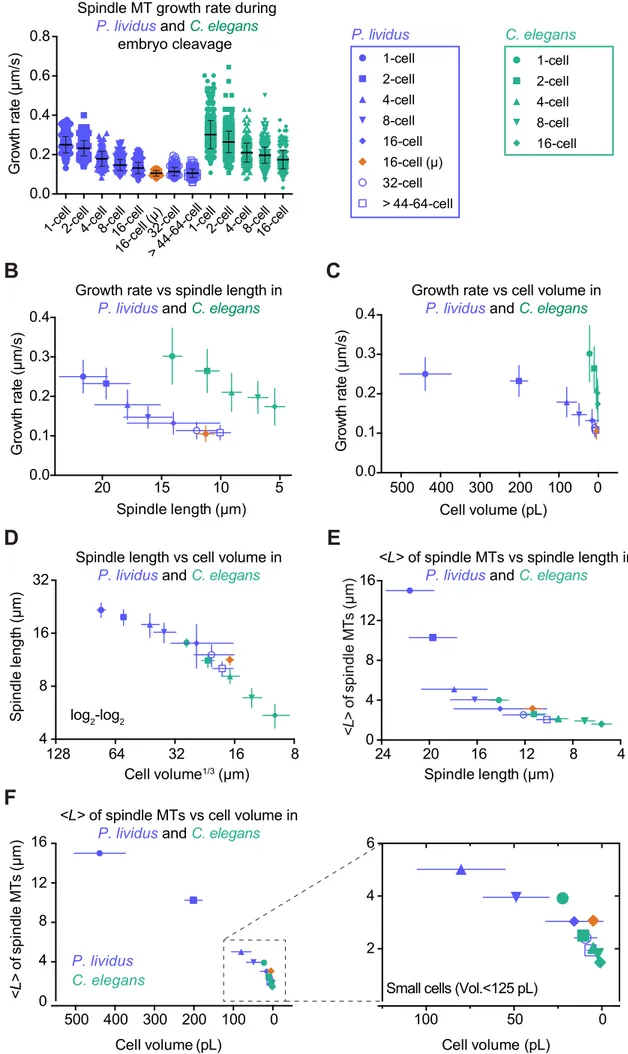
Microtubule Dynamics and Cell Volume
Parameters of microtubule dynamics scaled similarly across cleavages in C. elegans and
P. lividus but had different absolute values in the two species. C. elegans embryos are ~20 times
absolute predictor of spindle length (Figure 7B-D). In contrast, the average theoretical microtubule length <L>, calculated from the four parameters of dynamic instability, followed a linear and similar trend in both species when plotted against cell volume (Figure 7F). Strikingly, blastomeres of comparable volumes displayed very similar values of <L> regardless of their species of origin (C. elegans 2-cell stage blastomeres and P. lividus 32-cell stage blastomeres display volumes of 10.6 and 9.28 pl respectively and <L> of 2.48 and 2.42 µm respectively).
<L> is a readout of the overall microtubule dynamics, which suggests that microtubule
dynamics vary to set an average microtubule length that scales with cell volume. Furthermore, since spindle length is roughly proportional to <L>, microtubule dynamics are modulated to scale spindle length with cell volume.
However, we note that <L> is not equal to the spindle half-length nor do we suggest that spindle length is solely determined by microtubule length. Spindle assembly requires other factors (Dumont and Mitchison, 2009b; Mitchison et al., 2015; Reber and Hyman, 2015; Walczak and Heald, 2008; Waters and Salmon, 1997). We also provide evidence for this premise, as <L> did not always scale linearly with spindle length in P. lividus (Figure 7E). Specifically, 1- and 2-cell stage sea urchin blastomeres deviated from the linear scaling trend followed by other cells, and assembled spindles that were shorter than predicted by values of
<L>. Several non-exclusive causes could account for the discrepancy between <L> and spindle
length: microtubules may bend, detach from the centrosomes or be severed (Brangwynne et al., 2006; Crowder et al., 2015; Dumont and Mitchison, 2009a; Gadde and Heald, 2004; Goshima et al., 2005a; Maiato et al., 2004; McBeath and Fujiwara, 1990; Reber and Hyman, 2015; Redemann et al., 2017; Wuhr et al., 2008). We also note that theoretically, the microtubule
itself (Mitchison et al., 2015; Reber et al., 2013). So, when microtubule length and spindle length scale linearly together, total microtubule mass in the spindle may also scale. But in larger blastomeres, an excess in microtubule mass, due to the increased growth rate, could be compensated either by an increase in density, or by a change in spindle width rather than length. Consistent with the later possibility and previous observations done in other species (Crowder et al., 2015; Hara and Kimura, 2013), we observed a significant change in the spindle length to width ratio and in the centrosome radius in P. lividus among cleavages, which correlated with proportionally wider spindle poles at earlier stages (Figure S3H and Table S2).
Microtubule Dynamics and Spindle Length
Our analysis revealed that the microtubule growth rate and spindle length decrease concomitantly and sub-proportionally to cell volume across reductive divisions in early C.
elegans and P. lividus embryos. This contrasts with previous work comparing stage 3 and 8 Xenopus embryo extracts. These studies found no major variation in the microtubule growth rate,
but a threefold increase in the microtubule catastrophe frequency correlated with smaller spindles (Wilbur and Heald, 2013). It is possible that different mechanisms may exist across phylogeny that would produce similar effects on spindle length, thus reflecting evolutionary diversity. However, we note that Xenopus blastomeres (at both stages 3 and 8) are significantly larger than
C. elegans or P. lividus embryos, which could favor one spindle scaling mechanism over the
other. Moreover, stage 8 blastomeres utilize a linear scaling regime, where spindle length scales linearly with cell size, while stage 3 blastomeres remain in the ‘large-cell’ regime, in which spindle length reaches an upper limit that is independent of cell size (Wilbur and Heald, 2013;
be related to the transitioning from ‘large-cell’ to linear scaling regime rather than reflecting a cell size-dependent spindle scaling mechanism. Finally, results obtained with Xenopus egg extracts could also reflect the removal of membrane confinements. In the ‘large-cell’ regime, spindle length is controlled through spindle intrinsic mechanisms such as autocatalytic microtubule nucleation (Decker et al., 2018; Ishihara et al., 2016; Mitchison et al., 2015). It is therefore possible that in the ‘small-cell’ regime, modulation of the microtubule nucleation rate similarly contributes to spindle length scaling. However, our results demonstrate that regulation of the microtubule growth rate is sufficient to account for spindle length adaptation to cell volume in small cells.
We still must determine the specific factors that control microtubule growth rate with respect to cell volume. The limiting component hypothesis proposes that one or several factors critical for spindle assembly have a limited supply, so their absolute quantity per cell diminishes upon embryo cleavage (Mitchison et al., 2015; Reber and Goehring, 2015). Tubulin is the most obvious candidate, as its concentration does determine the rate of microtubule elongation in vitro (Walker et al., 1988). However, several in vitro and in vivo studies argue against tubulin being the sole limiting component. In Xenopus egg extracts or in the presence of crowding agents in
vitro, the growth rate of microtubules is not linearly dependent on the available tubulin
concentration (Parsons and Salmon, 1997; Wieczorek M, 2013), as robust spindle length scaling occurred in lipid droplets even after artificially increasing the amount of tubulin (Good et al., 2013). In sea urchin embryos, a 5-fold excess of tubulin is present in a soluble non-polymerized form, and can be artificially mobilized into the spindle upon treatment with crowding agents indicating that tubulin itself is not limiting in this system (Inoue and Sato, 1967; Raff et al.,
to estimate the tubulin concentration to approximately 22 µM in C. elegans embryos, which is similar to Xenopus embryos (Figure S5 and Methods) (Belmont et al., 1990). Based on a recent study providing the first complete electron tomographic reconstruction of the mitotic spindle in the C. elegans zygote (Redemann et al., 2017), we estimated that the total amount of tubulin heterodimers should be sufficient to assemble 2–3 zygotic mitotic spindles (see Methods). Thus, tubulin seems unlikely to be the only limiting factor for spindle length scaling. Another possibility is that specific microtubule-associated proteins (MAPs) that regulate microtubule growth rate are also limiting. Consistent with this, we found that reducing levels of the CLS-2 protein in C. elegans zygotes modulated microtubule growth rate and spindle length proportionally. Furthermore, by performing a temporal dilution experiment through progressive RNAi depletion of CLS-2 in the C. elegans one-cell embryo, we found that spindle length was proportional to CLS-2 protein level (Figure 8A-E). Together, these results are in agreement with the limiting amount of one or several MAPs restricting microtubule dynamics and spindle length in early embryos (Figure 8F,G). To explain how the absolute amount of MAPs could become limiting and thus control spindle length scaling, we favor a model where a progressive mismatch is established across successive divisions between the number of available MAPs and the number of spindle microtubules (Figure 8G). The CLS-2 and TPXL-1 proteins are good candidate factors for acting as limiting components (Greenan et al., 2010). However, MAPs influence several microtubule dynamics parameters, which complicates the identification of the key factor(s) that coordinates spindle length with cell size in early embryos in vivo (Bowne-Anderson et al., 2015). We must also point out that the limiting component model cannot account for the spindle-scaling mismatch observed between oocytes and zygotes of most species, and that cell volume is not an absolute predictor of spindle length. Indeed, although they
assemble in an identical volume of the same cytoplasm, oocyte spindles are usually smaller than their zygotic counterpart. Meiotic-specific and volume-independent mechanisms can usually account for the discrepancy between cell volume and spindle length in oocytes (Clandinin and Mains, 1993; Clark-Maguire and Mains, 1994; Lu et al., 2004; Srayko et al., 2000).
Microtubule Dynamics and Spindle Assembly Rate
In addition to spindle size, we also found that the rate of spindle assembly (spindle length/time of assembly) scaled with cell size in C. elegans embryos. Our simulations combined with our in vivo measurements suggest that this scalability occurs through the proportional relationship between microtubule growth rate and steady state spindle length. This property could be key in early embryos that undergo rapid cell divisions with a weak spindle assembly checkpoint (Encalada et al., 2005). Indeed, C. elegans embryos respond to unattached kinetochores by inducing a small delay in mitosis but do not arrest their cell cycle progression. In this context, adapting the microtubule growth rate to the final spindle length would ensure efficient chromosome bi-orientation and avoid sister chromatid mis-segregation. Fast-assembling microtubules in large blastomeres reach further and search more space to ensure timely chromosome capture during the short mitotic time window. As cleavage progresses and spindle length decreases, slowing down microtubule assembly may negate the simultaneous connection of individual kinetochores to both spindle poles, which would promote merotely and gross chromosome mis-segregation if not corrected. From these observations, we envision that decreasing the microtubule growth rate permits the embryo to not only scale down its spindles,
C. elegans embryos demonstrated that the rate of spindle elongation during anaphase (Hara and
Kimura, 2009) and the rate of cortical ring constriction during cytokinesis (Carvalho et al., 2009) also decreased as cell volume decreased, which makes the time needed for anaphase spindle elongation and for cytokinetic ring constriction independent of cell size. Future studies should examine whether the rates of other cell division processes also exhibit intrinsic scalability and whether this is a general principle that dictates how cell biological processes scale with cell size.
ACKNOWLEDGMENTS
We thank all members of the Dumont lab for support and advice, and Kimberley Laband for critical reading of the manuscript. We are grateful to Patricia Moussounda for providing technical support. We thank Life Science Editors for editing assistance. We acknowledge the ImagoSeine core facility of the Institut Jacques Monod, member of IBiSA and France-BioImaging (ANR-10-INBS-04) infrastructures. We thank Nicolas Tissot (ImagoSeine) for his help with the 2-photon microscopy. We thank Julie Ahringer (The Gurdon Institute, University of Cambridge, UK) for the generous gift of the JA1559 C. elegans strain, and George Von Dassow, University of Oregon) for providing recombinant 3xmCherry-EMTB. Some strains were provided by the CGC, which is funded by NIH Office of Research Infrastructure Programs (P40 OD010440). EMBRC-France is supported by the Investments of the Future program under reference ANR-10-INBS-02. We thank Pascal Romans (UPMC, Banyuls-sur-Mer, France) and Anaëlle Pierre (IJM, Paris, France) for technical assistance with sea urchins. We thank Dmitry Ershov (IJM, Paris, France) for his help with MATLAB. We are grateful to Jean-Claude Labbe (IRIC) for initial technical support and discussions. B.L. was originally supported by a post-doctoral fellowship from the Fondation pour la Recherche Médicale (FRM ARF20140129055). JS and NM are supported by the European Research Council (CoG Forcaster N° 647073). This work was supported by CNRS and University Paris Diderot and by grants from the Agence
Nationale pour la Recherche (ANR-16-CE13-0020-01), the Mairie de Paris (Emergence) and
AUTHOR CONTRIBUTIONS
B.L. and J.D. conceived the project with input from all authors. B.L. performed all of the experiments, except those specifically attributed to other authors. L.P. performed the CLβL experiments and analysis. J.S. performed the sea urchin microinjection experiments with input from N.M. G.M. performed the C. elegans microinjection experiments. M.S. and J.C.C. generated some strains used in this study. A.M.L. performed some image analyses. B.L., J.D., G.L. and F.N. conceived the in silico model, and G.L. and F.N. extended Cytosim to implement it. G.L. performed the computer simulations under F.N. supervision. B.L. and J.D. made the figures and wrote the manuscript with input from all authors.
DECLARATION OF INTERESTS
REFERENCES
Agrell, I. (1956). A mitotic gradient as the cause of the early differentiation in the sea urchin embryo. Zoological Papers in Honour of B Hanstrom, pp. 27-34.
Andersen, S.S. (2000). Spindle assembly and the art of regulating microtubule dynamics by MAPs and Stathmin/Op18. Trends Cell Biol 10, 261-267.
Andersen, S.S., Ashford, A.J., Tournebize, R., Gavet, O., Sobel, A., Hyman, A.A., and Karsenti, E. (1997). Mitotic chromatin regulates phosphorylation of Stathmin/Op18. Nature 389, 640-643. Angerer, L.M., and Angerer, R.C. (2000). Animal-vegetal axis patterning mechanisms in the early sea urchin embryo. Dev Biol 218, 1-12.
Belmont, L.D., Hyman, A.A., Sawin, K.E., and Mitchison, T.J. (1990). Real-time visualization of cell cycle-dependent changes in microtubule dynamics in cytoplasmic extracts. Cell 62, 579-589.
Bowne-Anderson, H., Hibbel, A., and Howard, J. (2015). Regulation of Microtubule Growth and Catastrophe: Unifying Theory and Experiment. Trends Cell Biol 25, 769-779.
Brangwynne, C.P., MacKintosh, F.C., Kumar, S., Geisse, N.A., Talbot, J., Mahadevan, L., Parker, K.K., Ingber, D.E., and Weitz, D.A. (2006). Microtubules can bear enhanced compressive loads in living cells because of lateral reinforcement. J Cell Biol 173, 733-741. Brenner, S. (1974). The genetics of Caenorhabditis elegans. Genetics 77, 71-94.
Brown, K.S., Blower, M.D., Maresca, T.J., Grammer, T.C., Harland, R.M., and Heald, R. (2007). Xenopus tropicalis egg extracts provide insight into scaling of the mitotic spindle. J Cell Biol 176, 765-770.
Canman, J.C., Lewellyn, L., Laband, K., Smerdon, S.J., Desai, A., Bowerman, B., and Oegema, K. (2008). Inhibition of Rac by the GAP activity of centralspindlin is essential for cytokinesis. Science 322, 1543-1546.
Carvalho, A., Desai, A., and Oegema, K. (2009). Structural memory in the contractile ring makes the duration of cytokinesis independent of cell size. Cell 137, 926-937.
Castoldi, M., and Popov, A.V. (2003). Purification of brain tubulin through two cycles of polymerization-depolymerization in a high-molarity buffer. Protein Expr Purif 32, 83-88.
Chalfie, M., and Thomson, J.N. (1982). Structural and functional diversity in the neuronal microtubules of Caenorhabditis elegans. J Cell Biol 93, 15-23.
Chan, Y.H., and Marshall, W.F. (2010). Scaling properties of cell and organelle size. Organogenesis 6, 88-96.
Chan, Y.H., and Marshall, W.F. (2012). How cells know the size of their organelles. Science 337, 1186-1189.
Cheeseman, I.M., MacLeod, I., Yates, J.R., 3rd, Oegema, K., and Desai, A. (2005). The CENP-F-like proteins HCP-1 and HCP-2 target CLASP to kinetochores to mediate chromosome segregation. Curr Biol 15, 771-777.
Clandinin, T.R., and Mains, P.E. (1993). Genetic studies of mei-1 gene activity during the transition from meiosis to mitosis in Caenorhabditis elegans. Genetics 134, 199-210.
Clark-Maguire, S., and Mains, P.E. (1994). Localization of the mei-1 gene product of Caenorhaditis elegans, a meiotic-specific spindle component. J Cell Biol 126, 199-209.
Crowder, M.E., Strzelecka, M., Wilbur, J.D., Good, M.C., von Dassow, G., and Heald, R. (2015). A comparative analysis of spindle morphometrics across metazoans. Curr Biol 25, 1542-1550.
Davidson, E.H., Cameron, R.A., and Ransick, A. (1998). Specification of cell fate in the sea urchin embryo: summary and some proposed mechanisms. Development 125, 3269-3290.
Davies, T., Jordan, S.N., Chand, V., Sees, J.A., Laband, K., Carvalho, A.X., Shirasu-Hiza, M., Kovar, D.R., Dumont, J., and Canman, J.C. (2014). High-resolution temporal analysis reveals a functional timeline for the molecular regulation of cytokinesis. Dev Cell 30, 209-223.
Decker, F., Oriola, D., Dalton, B., and Brugues, J. (2018). Autocatalytic microtubule nucleation determines the size and mass of Xenopus laevis egg extract spindles. Elife 7.
Decker, M., Jaensch, S., Pozniakovsky, A., Zinke, A., O'Connell, K.F., Zachariae, W., Myers, E., and Hyman, A.A. (2011). Limiting amounts of centrosome material set centrosome size in C. elegans embryos. Curr Biol 21, 1259-1267.
Desai, A., and Mitchison, T.J. (1997). Microtubule polymerization dynamics. Annu Rev Cell Dev Biol 13, 83-117.
Dogterom, M., and Yurke, B. (1997). Measurement of the force-velocity relation for growing microtubules. Science 278, 856-860.
Dumont, S., and Mitchison, T.J. (2009a). Compression regulates mitotic spindle length by a mechanochemical switch at the poles. Curr Biol 19, 1086-1095.
Dumont, S., and Mitchison, T.J. (2009b). Force and length in the mitotic spindle. Curr Biol 19, R749-761.
Encalada, S.E., Willis, J., Lyczak, R., and Bowerman, B. (2005). A spindle checkpoint functions during mitosis in the early Caenorhabditis elegans embryo. Mol Biol Cell 16, 1056-1070.
Espiritu, E.B., Krueger, L.E., Ye, A., and Rose, L.S. (2012). CLASPs function redundantly to regulate astral microtubules in the C. elegans embryo. Dev Biol 368, 242-254.
Faire, K., Waterman-Storer, C.M., Gruber, D., Masson, D., Salmon, E.D., and Bulinski, J.C. (1999). E-MAP-115 (ensconsin) associates dynamically with microtubules in vivo and is not a physiological modulator of microtubule dynamics. J Cell Sci 112 ( Pt 23), 4243-4255.
Fire, A., Xu, S., Montgomery, M.K., Kostas, S.A., Driver, S.E., and Mello, C.C. (1998). Potent and specific genetic interference by double-stranded RNA in Caenorhabditis elegans. Nature 391, 806-811.
Foe, V.E., and von Dassow, G. (2008). Stable and dynamic microtubules coordinately shape the myosin activation zone during cytokinetic furrow formation. J Cell Biol 183, 457-470.
Frokjaer-Jensen, C., Davis, M.W., Hopkins, C.E., Newman, B.J., Thummel, J.M., Olesen, S.P., Grunnet, M., and Jorgensen, E.M. (2008). Single-copy insertion of transgenes in Caenorhabditis elegans. Nat Genet 40, 1375-1383.
Gadde, S., and Heald, R. (2004). Mechanisms and molecules of the mitotic spindle. Curr Biol 14, R797-805.
Goehring, N.W., and Hyman, A.A. (2012). Organelle growth control through limiting pools of cytoplasmic components. Curr Biol 22, R330-339.
Good, M.C., Vahey, M.D., Skandarajah, A., Fletcher, D.A., and Heald, R. (2013). Cytoplasmic volume modulates spindle size during embryogenesis. Science 342, 856-860.
Goshima, G., Nedelec, F., and Vale, R.D. (2005a). Mechanisms for focusing mitotic spindle poles by minus end-directed motor proteins. J Cell Biol 171, 229-240.
Goshima, G., Wollman, R., Stuurman, N., Scholey, J.M., and Vale, R.D. (2005b). Length control of the metaphase spindle. Curr Biol 15, 1979-1988.
Greenan, G., Brangwynne, C.P., Jaensch, S., Gharakhani, J., Julicher, F., and Hyman, A.A. (2010). Centrosome size sets mitotic spindle length in Caenorhabditis elegans embryos. Curr Biol 20, 353-358.
Hara, Y., and Kimura, A. (2009). Cell-size-dependent spindle elongation in the Caenorhabditis elegans early embryo. Curr Biol 19, 1549-1554.
Hara, Y., and Kimura, A. (2013). An allometric relationship between mitotic spindle width, spindle length, and ploidy in Caenorhabditis elegans embryos. Mol Biol Cell 24, 1411-1419. Hazel, J., Krutkramelis, K., Mooney, P., Tomschik, M., Gerow, K., Oakey, J., and Gatlin, J.C. (2013). Changes in cytoplasmic volume are sufficient to drive spindle scaling. Science 342, 853-856.
Holmfeldt, P., Brannstrom, K., Stenmark, S., and Gullberg, M. (2006). Aneugenic activity of Op18/stathmin is potentiated by the somatic Q18-->e mutation in leukemic cells. Mol Biol Cell 17, 2921-2930.
Hyman, A.A. (1991). Preparation of marked microtubules for the assay of the polarity of microtubule-based motors by fluorescence. J Cell Sci Suppl 14, 125-127.
Inoue, S., and Sato, H. (1967). Cell motility by labile association of molecules. The nature of mitotic spindle fibers and their role in chromosome movement. J Gen Physiol 50, Suppl:259-292. Ishihara, K., Korolev, K.S., and Mitchison, T.J. (2016). Physical basis of large microtubule aster growth. Elife 5.
Kamath, R.S., Martinez-Campos, M., Zipperlen, P., Fraser, A.G., and Ahringer, J. (2001). Effectiveness of specific RNA-mediated interference through ingested double-stranded RNA in Caenorhabditis elegans. Genome Biol 2, RESEARCH0002.
Kirschner, M., and Mitchison, T. (1986). Beyond self-assembly: from microtubules to morphogenesis. Cell 45, 329-342.
Komarova, Y.A., Vorobjev, I.A., and Borisy, G.G. (2002). Life cycle of MTs: persistent growth in the cell interior, asymmetric transition frequencies and effects of the cell boundary. J Cell Sci 115, 3527-3539.
Labbe, J.C., McCarthy, E.K., and Goldstein, B. (2004). The forces that position a mitotic spindle asymmetrically are tethered until after the time of spindle assembly. J Cell Biol 167, 245-256. Lacroix, B., and Maddox, A.S. (2014). Microtubule dynamics followed through cell differentiation and tissue biogenesis in C. elegans. Worm 3, e967611.
Lacroix, B., Ryan, J., Dumont, J., Maddox, P.S., and Maddox, A.S. (2016). Identification of microtubule growth deceleration and its regulation by conserved and novel proteins. Mol Biol Cell 27, 1479-1487.
Lancaster, O.M., Le Berre, M., Dimitracopoulos, A., Bonazzi, D., Zlotek-Zlotkiewicz, E., Picone, R., Duke, T., Piel, M., and Baum, B. (2013). Mitotic rounding alters cell geometry to ensure efficient bipolar spindle formation. Dev Cell 25, 270-283.
Letort, G., Nedelec, F., Blanchoin, L., and Thery, M. (2016). Centrosome centering and decentering by microtubule network rearrangement. Mol Biol Cell 27, 2833-2843.
Levy, D.L., and Heald, R. (2012). Mechanisms of intracellular scaling. Annu Rev Cell Dev Biol 28, 113-135.
Loughlin, R., Wilbur, J.D., McNally, F.J., Nedelec, F.J., and Heald, R. (2011). Katanin contributes to interspecies spindle length scaling in Xenopus. Cell 147, 1397-1407.
Lu, C., Srayko, M., and Mains, P.E. (2004). The Caenorhabditis elegans microtubule-severing complex MEI-1/MEI-2 katanin interacts differently with two superficially redundant beta-tubulin isotypes. Mol Biol Cell 15, 142-150.
Maddox, P., Straight, A., Coughlin, P., Mitchison, T.J., and Salmon, E.D. (2003). Direct observation of microtubule dynamics at kinetochores in Xenopus extract spindles: implications for spindle mechanics. J Cell Biol 162, 377-382.
Maiato, H., Rieder, C.L., and Khodjakov, A. (2004). Kinetochore-driven formation of kinetochore fibers contributes to spindle assembly during animal mitosis. J Cell Biol 167, 831-840.
Marshall, W.F. (2015a). How Cells Measure Length on Subcellular Scales. Trends Cell Biol 25, 760-768.
Marshall, W.F. (2015b). Subcellular size. Cold Spring Harb Perspect Biol 7.
Maton, G., Edwards, F., Lacroix, B., Stefanutti, M., Laband, K., Lieury, T., Kim, T., Espeut, J., Canman, J.C., and Dumont, J. (2015). Kinetochore components are required for central spindle assembly. Nat Cell Biol 17, 697-705.
McBeath, E., and Fujiwara, K. (1990). Microtubule detachment from the microtubule-organizing center as a key event in the complete turnover of microtubules in cells. Eur J Cell Biol 52, 1-16. Mitchison, T., and Kirschner, M. (1984). Dynamic instability of microtubule growth. Nature 312, 237-242.
Mitchison, T.J., Ishihara, K., Nguyen, P., and Wuhr, M. (2015). Size Scaling of Microtubule Assemblies in Early Xenopus Embryos. Cold Spring Harb Perspect Biol 7, a019182.
Muller-Reichert, T., Greenan, G., O'Toole, E., and Srayko, M. (2010). The elegans of spindle assembly. Cell Mol Life Sci 67, 2195-2213.
Nance, J. (2005). PAR proteins and the establishment of cell polarity during C. elegans development. Bioessays 27, 126-135.
Nedelec F, F.D. (2007). Collective Langevin dynamics of flexible cytoskeletal fibers. New J Phys 9, 427–427.
Nogales, E., Wolf, S.G., and Downing, K.H. (1998). Structure of the alpha beta tubulin dimer by electron crystallography. Nature 391, 199-203.
O'Farrell, P.H., Stumpff, J., and Su, T.T. (2004). Embryonic cleavage cycles: how is a mouse like a fly? Curr Biol 14, R35-45.
Parisi, E., Filosa, S., De Petrocellis, B., and Monroy, A. (1978). The pattern of cell division in the early development of the sea urchin. Paracentrotus lividus. Dev Biol 65, 38-49.
Parsons, S.F., and Salmon, E.D. (1997). Microtubule assembly in clarified Xenopus egg extracts. Cell Motil Cytoskeleton 36, 1-11.
Picone, R., Ren, X., Ivanovitch, K.D., Clarke, J.D., McKendry, R.A., and Baum, B. (2010). A polarised population of dynamic microtubules mediates homeostatic length control in animal
Raff, R.A., Brandis, J.W., Green, L.H., Kaumeyer, J.F., and Raff, E.C. (1975). Microtubule protein pools in early development. Ann N Y Acad Sci 253, 304-317.
Raff, R.A., and Kaumeyer, J.F. (1973). Soluble microtubule proteins of the sea urchin embryo: partial characterization of the proteins and behavior of the pool in early development. Dev Biol 32, 309-320.
Reber, S., and Goehring, N.W. (2015). Intracellular Scaling Mechanisms. Cold Spring Harb Perspect Biol 7.
Reber, S., and Hyman, A.A. (2015). Emergent Properties of the Metaphase Spindle. Cold Spring Harb Perspect Biol 7, a015784.
Reber, S.B., Baumgart, J., Widlund, P.O., Pozniakovsky, A., Howard, J., Hyman, A.A., and Julicher, F. (2013). XMAP215 activity sets spindle length by controlling the total mass of spindle microtubules. Nat Cell Biol 15, 1116-1122.
Rebhun, L.I., Jemiolo, D., Ivy, N., Mellon, M., and Nath, J. (1975). Regulation of the in vivo mitotic apparatus by glycols and metabolic inhibitors. Ann N Y Acad Sci 253, 362-377.
Redemann, S., Baumgart, J., Lindow, N., Shelley, M., Nazockdast, E., Kratz, A., Prohaska, S., Brugues, J., Furthauer, S., and Muller-Reichert, T. (2017). C. elegans chromosomes connect to centrosomes by anchoring into the spindle network. Nat Commun 8, 15288.
Rose, L.S., and Kemphues, K.J. (1998). Early patterning of the C. elegans embryo. Annu Rev Genet 32, 521-545.
Schmoller, K.M., and Skotheim, J.M. (2015). The Biosynthetic Basis of Cell Size Control. Trends Cell Biol 25, 793-802.
Sonnichsen, B., Koski, L.B., Walsh, A., Marschall, P., Neumann, B., Brehm, M., Alleaume, A.M., Artelt, J., Bettencourt, P., Cassin, E., et al. (2005). Full-genome RNAi profiling of early embryogenesis in Caenorhabditis elegans. Nature 434, 462-469.
Srayko, M., Buster, D.W., Bazirgan, O.A., McNally, F.J., and Mains, P.E. (2000). MEI-1/MEI-2 katanin-like microtubule severing activity is required for Caenorhabditis elegans meiosis. Genes Dev 14, 1072-1084.
Srayko, M., Kaya, A., Stamford, J., and Hyman, A.A. (2005). Identification and characterization of factors required for microtubule growth and nucleation in the early C. elegans embryo. Dev Cell 9, 223-236.
Stiernagle, T. (2006). Maintenance of C. elegans. WormBook, 1-11.
Sulston, J.E., and Horvitz, H.R. (1977). Post-embryonic cell lineages of the nematode, Caenorhabditis elegans. Dev Biol 56, 110-156.
Sulston, J.E., Schierenberg, E., White, J.G., and Thomson, J.N. (1983). The embryonic cell lineage of the nematode Caenorhabditis elegans. Dev Biol 100, 64-119.
Tanimoto, H., Kimura, A., and Minc, N. (2016). Shape-motion relationships of centering microtubule asters. J Cell Biol 212, 777-787.
Tirnauer, J.S., Canman, J.C., Salmon, E.D., and Mitchison, T.J. (2002). EB1 targets to kinetochores with attached, polymerizing microtubules. Mol Biol Cell 13, 4308-4316.
Tournebize, R., Popov, A., Kinoshita, K., Ashford, A.J., Rybina, S., Pozniakovsky, A., Mayer, T.U., Walczak, C.E., Karsenti, E., and Hyman, A.A. (2000). Control of microtubule dynamics by the antagonistic activities of XMAP215 and XKCM1 in Xenopus egg extracts. Nat Cell Biol 2, 13-19.
Verde, F., Dogterom, M., Stelzer, E., Karsenti, E., and Leibler, S. (1992). Control of microtubule dynamics and length by cyclin A- and cyclin B-dependent kinases in Xenopus egg extracts. J Cell Biol 118, 1097-1108.
Verde, F., Labbe, J.C., Doree, M., and Karsenti, E. (1990). Regulation of microtubule dynamics by cdc2 protein kinase in cell-free extracts of Xenopus eggs. Nature 343, 233-238.
Walczak, C.E., and Heald, R. (2008). Mechanisms of mitotic spindle assembly and function. Int Rev Cytol 265, 111-158.
Walker, R.A., O'Brien, E.T., Pryer, N.K., Soboeiro, M.F., Voter, W.A., Erickson, H.P., and Salmon, E.D. (1988). Dynamic instability of individual microtubules analyzed by video light microscopy: rate constants and transition frequencies. J Cell Biol 107, 1437-1448.
Waters, J.C., and Salmon, E. (1997). Pathways of spindle assembly. Curr Opin Cell Biol 9, 37-43.
West, G.B., and Brown, J.H. (2005). The origin of allometric scaling laws in biology from genomes to ecosystems: towards a quantitative unifying theory of biological structure and organization. J Exp Biol 208, 1575-1592.
Wieczorek M, C.S., Brouhard G.J. (2013). Macromolecular Crowding Pushes Catalyzed Microtubule Growth to Near the Theoretical Limit. Cellular and Molecular Bioengineering 6, 383-392.
Wilbur, J.D., and Heald, R. (2013). Mitotic spindle scaling during Xenopus development by kif2a and importin alpha. Elife 2, e00290.
Wuhr, M., Chen, Y., Dumont, S., Groen, A.C., Needleman, D.J., Salic, A., and Mitchison, T.J. (2008). Evidence for an upper limit to mitotic spindle length. Curr Biol 18, 1256-1261.
FIGURE LEGENDS
Figure 1. Astral and Spindle Microtubule Dynamics Vary During C. elegans Embryo Cleavage.
(A) Still frames from confocal live imaging of C. elegans embryos expressing GFP-tagged β-tubulin during the first five embryonic divisions (1- to 16-cell stage). Images correspond to a single focal plane. Scale bar, 20 µm.
(B) Schematic representation of parameter extraction for microtubule dynamics from individual astral (green) or spindle (red) microtubule kymographs. One representative example of a kymograph shown of an individual astral microtubule tracked over time. Horizontal scale bars, 1 µm, vertical scale bar (kymograph), 5 s.
(C) Microtubule dynamics parameters for astral (green) and spindle (red) microtubules plotted at each cleavage stage (1- to 16-cell stage). Each dot corresponds to an individual microtubule. For both microtubule populations, each parameter significantly varies between stages (one-way ANOVA: p<0.01). Only microtubule growth rates of both microtubule populations exhibit significant and continuous decrease at each stage (one-way ANOVA with Tukey’s multiple comparison tests: p<0.01). All parameters including sample size, mean, and SD for the four astral and spindle microtubule dynamics parameters at the different stages are listed in Table S1. (Horizontal bars, mean; error bars, SD; n(microtubules)≥288 per cleavage stage; n (embryos)≥12).
(D) Kymographs extracted from confocal live imaging of C. elegans embryos expressing GFP-tagged β-tubulin during the first embryonic division (one-cell stage) treated with DMSO
diluted in DMSO, bottom) to inhibit the metaphase-to-anaphase transition. Spindles poles (black arrowheads) are visible as two dark stripes that separate during anaphase in controls and stay at the same distance over time in CLβL-treated embryos. Timings relative to NEBD monitored by diffusion of free GFP-tagged β-tubulin in the nuclear area. Horizontal scale bar, 50s; Vertical scale bar, 5 µm.
(E) Spindle length (aster-to-aster distance) plotted over time in DMSO (colors) and CLβL (grey) treated embryos at each cleavage stage (1- to 16-cell stage). Timings relative to NEBD. (n≥5 spindles per stage in each condition; error bars, SD).
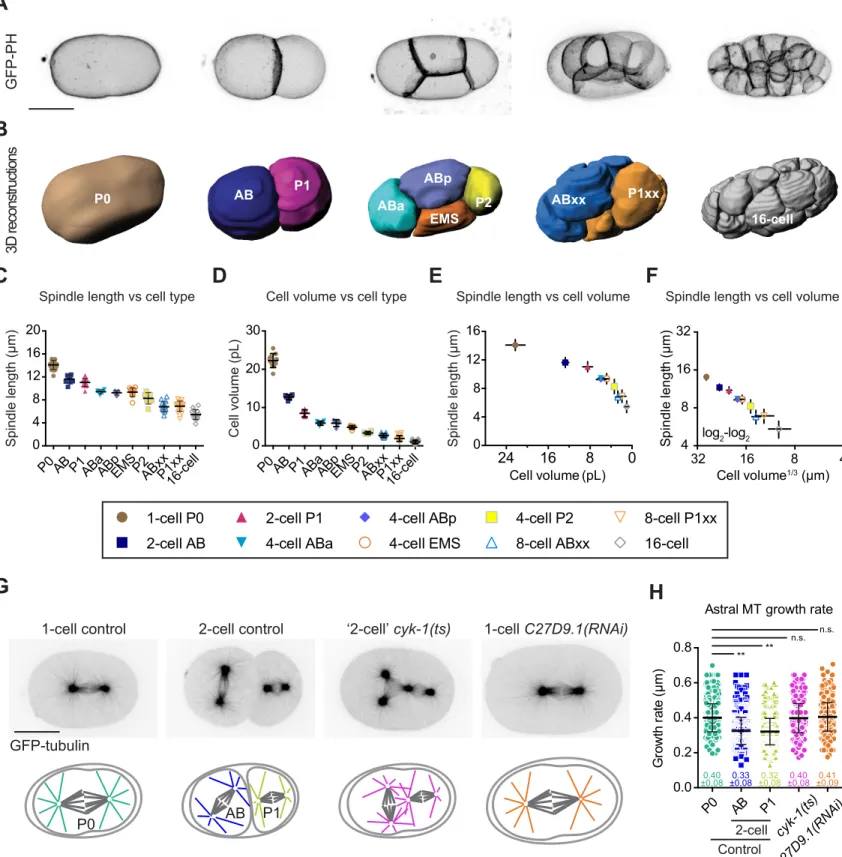
Figure 2. Astral and Spindle Microtubule Dynamics Vary with Cell Volume During C.
elegans Embryo Cleavage
(A) Still frames from live 2-photon imaging of C. elegans embryos expressing a GFP-tagged plasma membrane probe (Pleckstrin Homology (PH) domain) during the first five embryonic divisions (1- to 16-cell stage). Images correspond to maximal projections of z-stacks covering the entire thickness of the embryo. Scale bar, 20 µm. Blastomere names are indicated except for the 16-cell stage. At the 8-cell stage, progeny of AB and P1 were grouped together as ABxx and P1xx respectively.
(B) Mean astral (green) and spindle (red) microtubule dynamics parameters: mean microtubule growth rate, catastrophe frequency, shrinkage rate and rescue frequency (from Figure 1C) for each type of blastomere plotted over the corresponding average cell volumes (from Figure S1). Key for different blastomeres shown in the top box. Dotted lines correspond to the linear
regression curves. Pearson correlation coefficient (r2) is indicated at the top of each graph if p ≤ 0.01 (no corr. is indicated otherwise).
(C) From left to right, still images from confocal live imaging of C. elegans control one-cell embryo, control 2-cell embryo, thermosensitive (ts) mutant embryo of the formin cyk-1 at the ‘2-cell’ stage after P0 cytokinesis failure and abnormally large C27D9.1(RNAi)-treated embryo. All express GFP-tagged β-tubulin. Corresponding schematics with color-coding for spindle microtubules in different conditions shown at the bottom. Scale bar, 20 µm.
(D) Spindle microtubule growth rates measured at 25°C (restrictive temperature for the cyk-1(ts) mutant) for the indicated conditions. Color-coding for the different conditions corresponds to the schematics in (C). (Error bars, SD; one-way ANOVA with Dunnett’s multiple comparisons test, **: p≤0.01, n.s.: p>0.05).
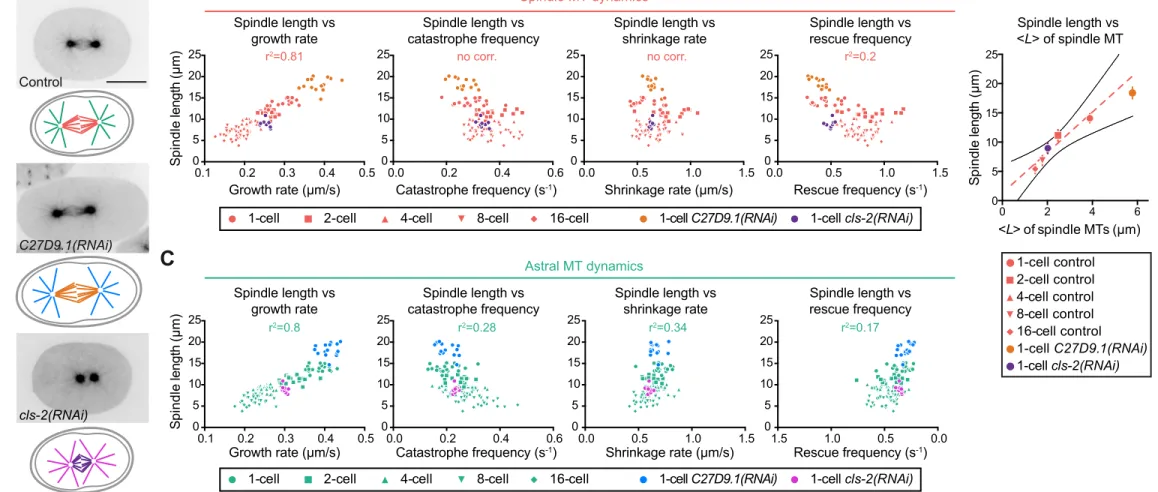
Figure 3. Spindle Length Scales with Spindle, but not Astral, Microtubule Growth Rate
(A) From top to bottom (left to right), still images from confocal live imaging of C. elegans control one-cell embryo, abnormally large C27D9.1(RNAi)-treated embryo and cls-2(RNAi)-treated embryo. All expressing GFP-tagged β-tubulin. Corresponding schematics with color-coding for astral and spindle microtubules in the different conditions shown underneath each image. Scale bar, 20 µm.
(B) Spindle length plotted over spindle microtubule dynamics parameters in the indicated cleavage stage or condition. Key for different stages and conditions indicated at the bottom of the graphs. (Control: red, C27D9.1(RNAi): orange, cls-2(RNAi): purple). Each dot represents the
individual blastomere. (n(cells)≥10 with n(events/cell)≥60). Pearson correlation coefficient (r2) for the control condition indicated at the top of each graph if p≤0.01 (no corr. is indicated otherwise).
(C) Same as (B) for astral microtubules. (Control: green, C27D9.1(RNAi): blue, cls-2(RNAi): magenta).
(D) Average theoretical microtubule length <L> plotted over experimentally measured average spindle length in the indicated conditions (Control: red, C27D9.1(RNAi): orange, cls-2(RNAi): purple). < ! >=!"×!"!!"×!"!"×!" with Vg: Growth rate, Vs: Shrinkage rate, fc: Catastrophe frequency, fr: Rescue frequency. Dotted red line and black lines represent the linear regression and 95% confidence interval respectively.
Figure 4. Spindle Length Scales with Cell Volume and Microtubule Growth Rate During Embryo Cleavage in the Sea Urchin P. lividus
(A) (Top)(Left) Schematic representations of early embryonic divisions of the sea urchin
Paracentrotus lividus. Top views schematized for the 2- and 4-cell stages. All other schemes
represent side views with the animal pole at the bottom. At the 16-cell stage, micromeres highlighted in orange. (Bottom)(Right) Still frames from confocal live imaging of P. lividus embryos microinjected with ATTO 565-labelled pig brain tubulin during the first six embryonic divisions (1- to >44-64-cell stage). Scale bar, 20 µm.
(B) Microtubule dynamics parameters for spindle microtubules plotted at each cleavage stage (1- to >44-64-cell stage). Each dot corresponds to an individual microtubule. Microtubule growth
tests: p<0.0001), except between the 16-cell micromeres, the 32-cell and the >44-64-cell macromeres (p>0.5 in all cases). However, the 16-cell micromeres and the 32-cell macromeres, as well as the 32-cell and the >44-64-cell macromeres differ significantly using a Student t-test (p=0.0004 and 0.0039 respectively), but the 16-cell micromeres do not when compared to the >44-64-cell macromeres (p=0.85). All parameters including sample size, mean and SD are listed
in Table S2. (Horizontal bars, means; error bars, SD; n(cells/stage)≥5,
n(microtubules/stage)≥55).
(C) Mean growth rate for spindle microtubules plotted at each cleavage stage (1- to >44-64-cell stage) over the average corresponding cell volume. (Error bars, SD).
(D) Mean spindle length plotted at each stage (1- to >44-64-cell stage) over the corresponding average spindle microtubule growth rate. Dotted blue line and black lines represent the linear regression and 95% confidence interval respectively. Pearson correlation coefficient (r2) is indicated at the top of the graph because p ≤ 0.01. (Error bars, SD).
Figure 5. Microtubule Growth Rate Scales Spindle Length in Computational 3D Spindle Models
(A) Spindle length scaling with microtubule growth rate and cell volume. Astral and spindle microtubules and a cell boundary are included in these simulations. Images correspond to steady state spindles obtained after running the simulations for 200 s. The input growth rate indicated at the bottom left of each image. Scale bar, 5 µm.