*Corresponding author: Dr. Lanja Saleh, Institute of Clinical Chemistry, University Hospital of Zurich and University of Zurich, Raemistr. 100, 8091 Zurich, Switzerland, Phone: +41-(0)44-255 2293, Fax: +41-(0)44-255 4590, E-mail: [email protected] Daniel Mueller and Arnold von Eckardstein: Institute for Clinical Chemistry, University Hospital of Zurich and University of Zurich, Zurich, Switzerland
Lanja Saleh*, Daniel Mueller and Arnold von Eckardstein
Analytical and clinical performance of the new
Fujirebio 25-OH vitamin D assay, a comparison with
liquid chromatography-tandem mass spectrometry
(LC-MS/MS) and three other automated assays
DOI 10.1515/cclm-2015-0427
Received May 6, 2015; accepted August 26, 2015; previously published online October 10, 2015
Abstract
Background: We evaluated the analytical and clinical per-formance of the new Lumipulse® G 25-OH vitamin D assay
from Fujirebio, and compared it to a liquid chromatogra-phy-tandem mass spectrometry (LC-MS/MS) method and three other commercial automated assays.
Methods: Total 25 hydroxy vitamin D (25(OH)D) levels were measured in 100 selected serum samples from our routine analysis with Fujirebio 25(OH)D assay. The results were compared with those obtained with LC-MS/MS and three other automated 25(OH)D assays (Abbott, Beckman, and Roche). The accuracy of each assay tested was eval-uated against a Labquality reference serum panel for 25(OH)D (Ref!25OHD; University of Ghent).
Results: Intra- and inter-day imprecision of the Fujire-bio 25(OH)D assay was < 5%. FujireFujire-bio 25(OH)D assay showed the highest correlation among the assays tested with the LC-MS/MS method (R = 0.986). The mean relative bias obtained was –15.6% (Fujirebio), –12.7% (Beckman), –2.1% (Abbott) and 9.7% (Roche) as compared to LC-MS/ MS. Comparison with the Labquality certified reference serum panel yielded a mean bias of –11.8% (Fujirebio), –14.1% (Beckman), 4.4% (Abbott) and 3.2% (Roche), respectively. Compared to LC-MS/MS, the sensitivity of different methods in detecting vitamin D insufficiency ( < 50 nmol/L) varied from 100% for the Fujirebio assay to 72.7% for Roche, and specificity ranged from 94.4% for Roche to 87.6% for Beckman.
Conclusions: The Lumipulse G 25-OH vitamin D assay from Fujirebio demonstrated a good correlation with LC-MS/MS and some immunoassays. The performance of the assay is well-suited for routine 25(OH)D measurement in clini-cal serum samples. A correction for the observed negative bias vs. LC-MS/MS could be considered.
Keywords: 25-hydroxy vitamin D; immunoassays; liquid chromatography-tandem mass spectrometry (LC-MS/MS); method comparison; vitamin D assays.
Introduction
25-Hydroxy vitamin D (25(OH)D) is the predominant cir-culating form of vitamin D, and reflects vitamin D status [1, 2]. Currently, there is no consensus on the optimum threshold concentration of 25(OH)D, but the Institute of Medicine (IOM) recommends a threshold of 50 nmol/L for bone health [3], whereas the International Osteoporosis Foundation (IOF) [4] and the Endocrine Society [5] recom-mend a threshold of 75 nmol/L for optimal reductions in fall or fracture risk. However, the question of whether this higher threshold is associated with improvements in other health outcomes remains controversial [6].
In addition to the classical role of vitamin D in the maintenance of bone health, vitamin D deficiency has been associated with increased risks of a number of chronic conditions, including cardiovascular disease, dia-betes, hypertension, some cancers, autoimmune diseases, and infectious diseases [3–8]. This growing awareness that adequate vitamin D status has potentially beneficial effects on a variety of health outcomes has led to a marked increase in research in this field. In clinical practice, this has been reflected in a substantial rise in requests for vitamin D testing. Reliable high-throughput assay systems are essential to meet this increasing demand.
Current methods for the measurement of 25(OH)D include immunoassays, high performance liquid chroma-tography (HPLC), competitive protein binding assays and
liquid chromatography with tandem mass spectrometry (LC-MS/MS). Automated assay systems have been devel-oped by a number of manufacturers. However, studies have shown significant variability, both between assays and between laboratories, with these systems [9, 10]. Such variability makes the reliability of clinical decisions based on absolute cut-off values questionable. Recently, the National Institute of Standards and Technology (NIST) and the University of Ghent have released standard ref-erence materials (SRMs) in an attempt to improve the performance of currently available 25(OH)D assays. Nev-ertheless, discrepancies between the results of immuno-logical assays and reference LC-MS/MS methods persist [11–15]. Unacceptable levels of assay bias have been dem-onstrated in samples from a number of patient groups at risk of vitamin D deficiency, including pregnant women, haemodialysis patients and patients in intensive care units [16, 17].
Recently, Fujirebio introduced the Lumipulse G 25-OH vitamin D assay on the LUMIPULSE G 1200 System to the European markets. The assay provides a unique assay design being the first automated non-competitive sand-wich assay for measuring 25(OH)D. In this study, we aimed to 1) evaluate the analytical performance of the Fujirebio 25(OH)D assay; 2) evaluate the correlation and agreement of the Fujirebio assay with the LC-MS/MS method and three other automated total 25(OH)D assays available on the market (Abbott, Beckman and Roche; the Beckman assay was launched in January 2014); 3) evaluate the accuracy of Fujirebio and other selected assays tested against the certified reference serum panel for 25(OH)D (Ref!25OHD; Labquality, University of Ghent).
The study also investigated the impact of assay vari-ability on the classification of patients’ vitamin D status as insufficiency ( < 50 nmol/L), sufficient (50–75 nmol/L) or optimal ( > 75 nmol/L). In addition, the sensitivity, spec-ificity of each assay in detecting vitamin D insufficiency ( < 50 nmol/L) were also investigated.
Materials and methods
Study samples
Residual serum samples from 100 patients over 18 years of age submit-ted to the Institute of clinical chemistry, University Hospital of Zurich for routine 25(OH)D measurement were collected after the requested tests had been performed. All samples were blinded to patient identi-fication and information. From each serum sample, five aliquots were generated, frozen and stored at –20 °C until re-analysis. At the time of analysis, one aliquot of each sample was tested in each assay.
For the accuracy assessment of each assay, we used Labqual-ity certified reference serum panel “Ref!25OHD”; obtained from Bio-clin Oy-Labquality, Helsinki. The reference serum panel contains 20 native serum samples from single donors that have been quantified for 25(OH)D by reference measurement procedure (RMP) based on the Joint Committee for Traceability in Laboratory Medicine (JCTLM) approved isotope dilution mass spectrophotometry (ID-LC-MS/MS) ref-erence method procedure (RMP) developed at the University of Ghent by Prof. Linda Thienpont. Moreover, the accuracy of to the LC-MS/MS assay was assessed using standard reference material (SRM) 972a from the National Institute of Standards and Technology (NIST).
The study protocol had been approved by the local Zurich Can-tonal Ethical Committee. No patient informed consent was required. Measurement of circulating 25(OH)D concentrations This study assessed the analytical and clinical performance of the Fujirebio Lumipulse G 25-OH vitamin D assay applied on the LUMIPULSE G 1200 System. The assay is a two-step non-competitive sandwich assay based on Chemiluminescent Enzyme Immunoassay (CLEIA) that uses a novel steroid compound (X) to extract the 25(OH) D from VDBP by the effect of a similar steroid compound (X), which can extract vitamin D from VDBP. The capture sheep monoclonal antibody then specifically recognizes the released 25(OH)D with equimolar sensitivity for 25-OH vitamin D2 (25(OH)D2) and 25-OH vitamin D3 (25(OH)D3) [18].
Intra- and inter-day imprecision was assessed using 3 levels of human serum based quality control materials provided with the kit. Other commercially automated assays
Serum samples (n = 100) were analysed by means of three compara-tive commercially available automated assays: from Abbott Diag-nostics (Abbott Park, IL, USA, Architect 25-OH vitamin D assay, Lot. Nr. 00114A000), Beckman Coulter (Beckman Coulter Inc., CA, USA, Access 25(OH) vitamin D Total assay, Lot. Nr. 433754) and Roche Diagnostics (Mannheim, Germany, total vitamin D assay, Lot Nr. 17526200).
All 25(OH)D measurements were performed according to the manufacturer’s instructions in our ISO 17025 accredited laboratory. Characteristics of selected assays according to the package insert of each assay are summarized in Table 1. Intra- and inter-day impreci-sion of each assay (expressed as coefficients of variation) for 20 repli-cates of 3 levels of quality control materials over 20 subsequent days are listed in Table 1.
LC-MS/MS method
The LC-MS/MS method established in our laboratory used commer-cial standards (ClinCal® 25-OH-vitamin D2/D3; Level 0–3, RECIPE,
Muenchen, Germany; order number MS7013) that were traceable to NIST SRM 972 standards. The calibration standards covered con-centration ranges of 23.2–180.0 nmol/L for 25(OH)D3 and 17.2–153.0 nmol/L for 25(OH)D2. The lower limit of quantification (LLOQ) was 3.75 nmol/L for both 25(OH)D2 and 25(OH)D3, respectively.
No matrix effect could be observed in the relevant time ranges. Details of the LC-MS/MS method are provided in the online Supple-mentary Data 1.
Statistical analysis
All statistical analyses were performed using Analyse-it Method Evaluation Edition (Analyse-it Software, Ltd., Leeds, UK) for Micro-soft Excel. Concordance between Fujirebio and the other assays with in house developed LC-MS/MS method was assessed by means of Passing-Bablok regression analysis [19]. Correlation coefficients (R) were calculated. Systematic bias and proportional bias were derived from the intercept (a) and slope (b), respectively, of the regression equations (y = a+bx). Bland-Altman plots [20] were used to assess the relative mean difference (bias) and corresponding 95% limit of agree-ment (±1.96*SD differences).
Agreement between assays in the classification of vitamin D sta-tus was assessed by Cohn’s kappa coefficient (κ < 0.4 poor agreement; κ = 0.4–0.7 fair to good agreement; κ > 0.75 excellent agreement). Dif-ferences in mean 25(OH)D concentrations between the reference method and other methods were analysed by paired t-tests. p-Values of < 0.05 were considered statistically significant. 25(OH)D concen-tration values are given in molar units (nmol/L); for conversion to mass units (ng/mL), divide these by 2.5.
Results
Performance of the in-house LC-MS/MS
method
Intra-assay and inter-assay imprecision were assessed by measuring seven replicates of quality control samples over 7 days. Intra-assay CV% was 2.9% and 3.0% for mean 25(OH)D3 concentrations of 52.5 nmol/L and 206.9 nmol/L, respectively. The corresponding inter-assay CV% was 2.8% and 3.1%. Intra assay CV% was 2.8% and 3.1% for mean 25(OH)D2 concentrations of 50.8 and 205.5 nmol/L, respectively. The corresponding inter-assay CV% was 3.2 and 2.9%.
For accuracy testing of our LC-MS/MS method, the standard reference material (SRM) 972a from national institute of standards and technology (NIST) was used. A unit of SRM 972a consists of four vials (level 1–4) of frozen serum with different concentration levels of 25(OH)D. Levels 1–3 of SRM 972a were prepared from pools of human serum with endogenous concentrations of vitamin D metabolites. Level 4 consist of a pool of human serum for-tified with 3-epimer 25-hydroxy vitamin D3 (3-epi-25(OH) D3). Level 4 was excluded from the accuracy assessment, because our LC-MS/MS method does not separate the 3-epi-25(OH)D3 metabolite. The accuracy obtained for total 25(OH)D was 100.1%±3.1% for level 1 (target value
Ta ble 1: P er form anc e d at a and ch ar act er is tic s of the f ou r c ommer ci al ly 25(OH)D a ss ay s u sed in thi s s tudy . As sa y Pr inc ip le An alyz er Cr oss r ea ct ivi ty a D2, D3, 3-ep i D3 Anti body u sed a La bel a Samp le vo lu me, μL Lo Q a , nmo l/L Repor ta ble r ang e a, nmo l/L In tra -ass ay b, CV% In te r-ass ay b, CV% Rang e t es ted , nmo l/L Fujir eb io CLEIA LUMIPULS E G 1200 D3 –100% D2 –100% 3ep i-D3-19.9% Sheep monoc lon al Al ka line pho sp hat ase (ALP) 20 8.7 10–375 < 3.4 < 4.6 27.4–179.2 Ab bott CMIA Ar chit ect/ i2000S R D3 –105% D2 –82% 3ep i-D3-2.7% Sheep po ly clon al Ac ridiniu m 60 20 20–400 < 6.6 < 9.2 22.1–187.5 Bec km an CLIA Acce ss 2 D3 –100% D2 –100% 3ep i-D3-N/A Sheep monoc lon al Lu mi-Pho s*530 30 7.5 5.0–418 < 6.5 < 9.4 17.7–156.3 Roc he EC LIA Co ba s e602 D3–100% D2–92% 3ep i-D3–91% VDBP Rutheniu m 35 12.5 7.5–150 < 7.6 < 9.7 21.3–122.7 aDat a der iv ed fr om p ac kag e in ser ts pr ov ided b y m anuf act ur er s. bPr ec is ion s tudie s. C LEIA , c hemi lu mine sc enc e enzy me immu no as sa y; CMIA , c hemi lu mine sc enc e mic rop ar tic le immu no as sa y; CLIA , c hemi lu mine sc enc e immu no as sa y; E CLIA , elect ro- c hemi lu mine sc enc e immu no as sa y; VDBP , v itamin D b inding pr ot ein.
76.4±2.9 nmol/L) and 96.6%±1.7% for level 2 (target value 50.3±1.5 nmol/L).
The SRM 972a level three contains significant amounts of both native 25(OH)D2 and 25(OH)D3. The accuracy obtained for SRM 972a level 3 was 101.5%±0.9% for 25(OH) D2 (target value of 32.8±0.8 nmol/L), and 103%± 2.1% for 25(OH)D3 (target value of 49.4±1.1 nmol/L), as shown in Supplementary Table 1.
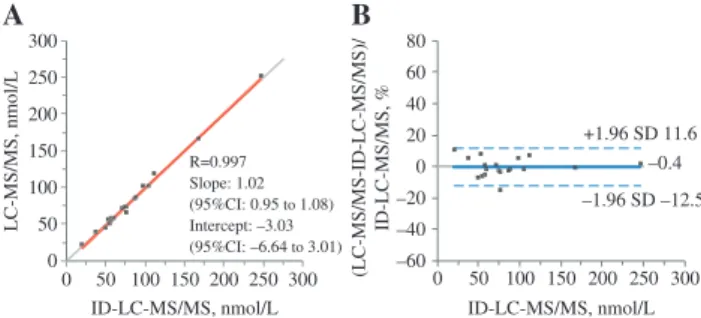
The correlation and the agreement between in-house LC-MS/MS method and the reference ID-LC-MS/ MS method for the Labquality reference serum panel are shown in Figure 1. The two methods showed excellent cor-relation and agreement with a relative mean bias of –0.4% [95% limits of agreement (±1.96 SD); –12.5 to 11.6)] as shown in Figure 1B. The estimated bias was clearly under the limit of bias ( ≤ 5%) as recommended by Stöckl et al. [21] and the Vitamin D Standardization Program (VDSP).
Five of the reference serum samples contained signifi-cant concentrations of 25(OH)D2 ranging from 5.1 nmol/L to 55.4 nmol/L corresponding to 9.6% to 48.8% of the total 25(OH)D. For those 5 samples, our in-house LC-MS/MS method agreed with the ID-LC-MS/MS with a mean bias of 3.6% [95% limits of agreement (±1.96 SD); –5.8 to 13.0)]. The mean accuracy of 25(OH)2 for those five samples was 107% (95% CI 96.6–118.2).
Precision of the Fujirebio 25-OH vitamin D
assay
Intra-assay CV% for 20 replicates of quality control samples was 3.4%, 1.6%, and 1.3% for mean 25(OH)D
values 27.4 nmol/L, 79.4 nmol/L and 179.2 nmol/L, respec-tively. The corresponding inter-assay CV% for 20 subse-quent days was 4.6%, 2.6%, and 2.4%.
Correlation and agreement of Fujirebio
25-OH vitamin D assay with 3 other
automated assays
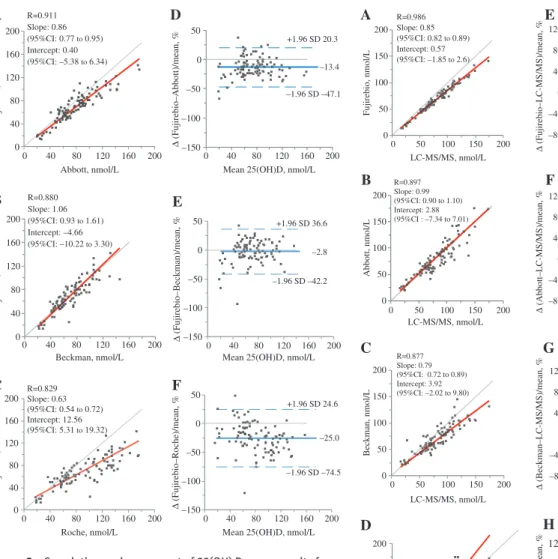
The results of 100 serum samples measured with the Fujirebio 25(OH)D assay were compared with those obtained with other automated assays using Passing-Bablok regression analyses and Bland-Altman agreement analysis as demonstrated in Figure 2. According to the LC-MS/MS method, only one sample out of 100 serum patient samples tested contained quantifiable level of 25(OH)D2. The concentration of 25(OH)D2 measured was 5.3 nmol/L, equaling 7.3% of the total 25(OH)D.
The results of 25(OH)D obtained with the Fujirebio assay were well correlated with those obtained for both Abbott [slope 0.86 (95% CI 0.77–0.95), intercept 0.40 nmol/L (95% CI –5.38 to 6.34), R = 0.911], and Beckman [slope 1.06 (95% CI 0.93–1.61), intercept –4.66 nmol/L (95% CI –10.22 to 3.30), R = 0.880] and less correlated with Roche [slope 0.63 (95% CI 0.54–0.72), intercept 12.56 nmol/L (95% CI 5.31–19.32), R = 0.829] as shown in Figure 2. Among the compared automated assays, excessive proportional bias was observed with Roche assay, the mean bias was –25% [(95% limits of agreement (±1.96 SD); –74.5 to 24.6)], as shown in Figure 2F.
Correlation and agreement of Fujirebio
25-OH vitamin D assay and 3 other
automated assays with the in-house
LC-MS/MS method
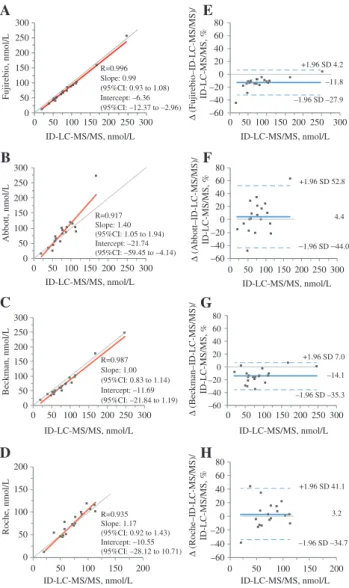
In comparison to the LC-MS/MS method, the Fujirebio assay demonstrated a strong correlation (R = 0.986) with a significant relative mean bias of –15.6% [(95% limits of agreement (±1.96 SD); –28.3 to –2.9)] (Figure 3A and E). To appraise the noticed negative bias, we compared the three other automated assays with the LC-MS/MS method.
As shown in Figure 3, the Fujirebio vitamin D assay showed stronger correlations with the in-house LC-MS/ MS as compared to the other three automated immunoas-says. Both Abbott and Beckmann underestimated 25(OH) D values with a mean bias of –2.1% [(95% limits of agree-ment (±1.96 SD); –36.8 to 32.6)] and –12.7% [(95% limits of agreement (±1.96 SD); –52.1 to 26.8)], respectively. The B –0.4 –1.96 SD –12.5 +1.96 SD 11.6 A ID-LC-MS/MS, nmol/L –60 –40 –20 0 20 40 60 80 0 50 100 150 200 250 300 (LC-MS/MS-ID-LC-MS/MS) / ID-LC-MS/MS, % ID-LC-MS/MS, nmol/L LC-MS/MS, nmol/L 0 50 100 150 200 250 300 0 50 100 150 200 250 300 R=0.997 Slope: 1.02 (95%CI: 0.95 to 1.08) Intercept: –3.03 (95%CI: –6.64 to 3.01)
Figure 1: Correlation and accuracy testing of in-house LC-MS/MS method using Labquality Reference Serum Panel for Total 25(OH)D (sum of 25(OH)D2 and 25(OH)D3) (n = 20).
(A) Passing-Bablok regression analyses for comparison between LC-MS/MS method (y-axis) and the reference ID-LC-MS/MS method. (x-axis). (B) Bland-Altman bias plot for comparisons between the LC-MS/MS method and the reference ID-LC-MS/MS method. The blue solid line represents the relative mean difference between paired measurements; dashed blue lines indicate upper and lower limits of agreement (±1.96 SD).
F D E ∆ (Fujirebio–Abbott)/mean, %
Mean 25(OH)D, nmol/L –150 –100 –50 0 50 0 40 80 120 160 200 –13.4 +1.96 SD 20.3 –1.96 SD –47.1 A Fujirebio, nmol/L Abbott, nmol/L 0 40 80 120 160 200 0 40 80 120 160 200 R=0.911 Slope: 0.86 (95%CI: 0.77 to 0.95) Intercept: 0.40 (95%CI: –5.38 to 6.34) Fujirebio, nmol/L Beckman, nmol/L B 0 40 80 120 160 200 0 40 80 120 160 200 R=0.880 Slope: 1.06 (95%CI: 0.93 to 1.61) Intercept: –4.66 (95%CI: –10.22 to 3.30) Fujirebio, nmol/L Roche, nmol/L C 0 40 80 120 160 200 0 40 80 120 160 200 R=0.829 Slope: 0.63 (95%CI: 0.54 to 0.72) Intercept: 12.56 (95%CI: 5.31 to 19.32)
Mean 25(OH)D, nmol/L
∆ (Fujirebio–Beckman)/mean, % –150 –100 –50 0 50 0 40 80 120 160 200 –2.8 +1.96 SD 36.6 –1.96 SD –42.2
Mean 25(OH)D, nmol/L
∆ (Fujirebio–Roche)/mean, % –150 –100 –50 0 50 0 40 80 120 160 200 –25.0 +1.96 SD 24.6 –1.96 SD –74.5
Figure 2: Correlation and agreement of 25(OH) D assay results from the Fujirebio assay against 3 other commercial automated assays using residual patient serum samples (n = 100).
Left panel: Passing-Bablok regression analyses for comparisons between Fujirebio method (y-axis) and (A) Abbott, (B) Beckman and (C) Roche assay (x-axis). Right panel: Bland-Altman bias plots for comparisons between the Fujirebio method and (D) Abbott, (E) Beckman and (F) Roche assay. The blue solid line represents the relative mean difference between paired measurements; dashed blue lines indicate upper and lower limits of agreement (±1.96 SD).
LC-MS/MS, nmol/L Fujirebio, nmol/L 0 50 100 150 200 0 50 100 150 200 0 50 100 150 200 0 50 100 150 200 Abbott, nmol/L Beckman, nmol/L Roche, nmol/L LC-MS/MS, nmol/L LC-MS/MS, nmol/L LC-MS/MS, nmol/L –80 –40 0 40 80 120 0 50 100 150 200
Mean 25(OH)D, nmol/L
–80 –40 0 40 80 120 0 50 100 150 200 –80 –40 0 40 80 120 0 50 100 150 200 0 50 100 150 200 0 50 100 150 200 0 50 100 150 200 0 50 100 150 200
Mean 25(OH)D, nmol/L
Mean 25(OH)D, nmol/L
Mean 25(OH)D, nmol/L
B A C D E F H G –80 –40 0 40 80 120 0 50 100 150 200 9.7 –15.6 +1.96 SD –2.9 –1.96 SD –52.1 –12.7 +1.96 SD 26.8 –1.96 SD –36.8 –2.1 +1.96 SD 32.6 +1.96 SD 60.8 –1.96 SD –41.4 ∆ (Fujirebio –LC-MS/MS)/mean, % ∆ (Abbott –LC-MS/MS)/mean, % ∆ (Roche–LC-MS/MS)/mean, % ∆ (Beckman –LC-MS/MS)/mean, % –1.96 SD –28.3 R=0.986 Slope: 0.85 (95%CI: 0.82 to 0.89) Intercept: 0.57 (95%CI: –1.85 to 2.6) R=0.897 Slope: 0.99 (95%CI: 0.90 to 1.10) Intercept: 2.88 (95%CI : –7.34 to 7.01) R=0.877 Slope: 0.79 (95%CI: 0.72 to 0.89) Intercept: 3.92 (95%CI: –2.02 to 9.80) R=0.832 Slope: 1.34 (95%CI: 1.17 to 1.56) Intercept: –16.89 (95%CI: –33.49 to –5.64)
Figure 3: Correlation and agreement of 25(OH) results from Fujirebio and three other automated assays versus LC-MS/MS total 25(OH)D (sum of 25(OH)D2 and 25(OH)D3) using residual patient serum samples (n = 100).
Left panel: Passing-Bablok regression analyses for comparisons between the LC-MS/MS method (x-axis) and (A) Fujirebio, (B) Abbott, (C) Beckman and (D) Roche assay (y-axis). Right panel: Bland-Altman bias plots for comparisons between the LC-MS/MS and (E) Fujirebio, (F) Abbott, (G) Beckman and (H) Roche assay. The blue solid line represents the relative mean difference between paired measurements, dashed blue lines indicate upper and lower limits of agreement (±1.96 SD).
Roche assay demonstrated a negative bias at concentra-tions lower than 50 nmol/L, while at concentraconcentra-tions above 50 nmol/L, the negative bias turned to a positive bias. The relative mean bias was 9.7% [(95% limits of agreement (±1.96 SD; –41.4 to 60.8)], as shown in Figure 3D and H.
Accuracy assessment for 25(OHD)2
and 25(OH)D3 testing using Labquality
reference serum panel (Ref!25OHD)
The correlation and the agreement between Fujirebio and the other automated assays and the reference ID-LC-MS/MS
method for the Labquality reference serum panel are shown in Figure 4. The Fujirebio method demonstrated high correlation [R = 0.996, slope 0.99 (95% CI 0.93–1.08), intercept –6.36 nmol/L (95% CI –12.37 to –2.96)] with
a negative relative mean bias of –11.8% [(95% limits of agreement (±1.96 SD); –27.9 to 4.2)].
The three other automated assays revealed different biases when compared to the reference ID-LC-MS/MS method as shown in Figure 4.
The Beckman assay underestimated 25(OH)D values, however the Roche assay yielded a positive bias which at
11 19 12 21 13 36 41 39 38 28 53 40 49 41 59 0 20 40 60 80 100
LC-MS/MS Fujirebio Abbott Beckman Roche
Proportion of participant samples,
%
Insufficient (<50 nmol/L) Sufficient (50–75 nmol/L) Optimal (>75 nmol/L)
Figure 5: Classification of vitamin D status according to 25(OH)D measurements performed by the different methods.
Data are presented as the proportion of patients (n = 100) with insuffi-cient ( < 50 nmol/L), suffiinsuffi-cient (50–75 nmol/L) or optimal ( > 75 nmol/L) 25(OH)D levels, with the number of patients shown within each bar. least in part due to overestimation at high values. Like-wise, the Abbott assay revealed a substantial positive bias at high 25(OH)D values. For one reference serum sample with a target value of 246.5 nmol/L, the measured 25(OH) D value obtained with Abbott assay exceeded the upper measuring limit of the assay ( > 400 nmol/L) giving a per-centage error of > 61.5%.
Five of the reference serum samples contained sig-nificant concentrations of 25(OH)D2 ranging from 5.1 to 55.4 nmol/L and making 9.6 to 48.8% of the total 25(OH)D.
For those five samples, all automated assays tested demonstrated a negative mean bias as compared to the reference method (ID-LC-MS/MS). The relative mean bias for each automated method was –11.1% [(95% limits of agreement (±1.96 SD); –14.5 to –7.8)], –11.2% [(95% limits of agreement (± 1.96 SD); –37.2 to 14.8)], –15.8% (95% limits of agreement (±1.96 SD); –27.7 to –4.0)], and –3.2% [(95% limits of agreement (±1.96 SD); –20.2 to 13.7)] for Fujirebio, Abbott, Beckman and Roche, respectively. The mean bias of both Fujirebio and Beckman differed significantly from the results obtained with ID-LC-MS/MS method.
Impact of assay performance on clinical
assessment of vitamin D status
The impact of variability in 25(OH)D results from different automated assays on the classification of patients’ vitamin D status as insufficient ( < 50 nmol/L), sufficient (50–75 nmol/L) or optimal ( > 75 nmol/L) are shown in Figure 5.
According to the LC-MS/MS results, 11/100 patients (11%) were classified having vitamin D insufficiency ( < 50 mol/L), the proportion with Fujirebio method was 19% [sensitivity: 100% (95% CI: 71.3%–100%), specificity
Fujirebio, nmol/L Abbott, nmol/L Roche, nmol/L ID-LC-MS/MS, nmol/L ID-LC-MS/MS, nmol/L ID-LC-MS/MS, nmol/L ID-LC-MS/MS, nmol/L A B C E G F 0 50 100 150 200 250 300 0 50 100 150 200 250 300 –60 –40 –20 0 20 40 60 80 0 50 100 150 200 250 300 3.2 –1.96 SD –34.7 +1.96 SD 41.1 4.4 +1.96 SD 52.8 –1.96 SD –44.0 0 50 100 150 200 250 300 0 50 100 150 200 250 300 –60 –40 –20 0 20 40 60 80 0 50 100 150 200 250 300 +1.96 SD 4.2 –11.8 –1.96 SD –27.9 –60 –40 –20 0 20 40 60 80 0 50 100 150 200 250 300 0 50 100 150 200 250 300 0 50 100 150 200 250 300 D H
ID-LC-MS/MS, nmol/L ID-LC-MS/MS, nmol/L
ID-LC-MS/MS, nmol/L ID-LC-MS/MS, nmol/L
Beckman, nmol/L 0 50 100 150 200 0 50 100 150 200 –60 –40 –20 0 20 40 60 80 0 50 100 150 200 –14.1 –1.96 SD –35.3 +1.96 SD 7.0 ∆ (Fujirebio–ID-LC-MS/MS)/ ID-LC-MS/MS, % ∆ (Abbott–ID-LC-MS/MS)/ ID-LC-MS/MS, % ∆ (Beckman–ID-LC-MS/MS)/ ID-LC-MS/MS, % ∆ (Roche–ID-LC-MS/MS)/ ID-LC-MS/MS, % R=0.996 Slope: 0.99 (95%CI: 0.93 to 1.08) Intercept: –6.36 (95%CI: –12.37 to –2.96) R=0.917 Slope: 1.40 (95%CI: 1.05 to 1.94) Intercept: –21.74 (95%CI: –59.45 to –4.14) R=0.987 Slope: 1.00 (95%CI: 0.83 to 1.14) Intercept: –11.69 (95%CI: –21.84 to 1.19) R=0.935 Slope: 1.17 (95%CI: 0.92 to 1.43) Intercept: –10.55 (95%CI: –28.12 to 10.71)
Figure 4: Correlation and accuracy testing of each assay using Labquality reference serum panel (n = 20).
Left panel: Passing-Bablok regression analyses for comparisons between reference total 25(OH)D (sum 25(OH) D2 and D3) values meas-ured with ID-LC-MS/MS method (x-axis) and (A) Fujirebio, (B) Abbott, (C) Beckman and (D) Roche assay (y-axis). Right panel: Bland-Altman bias plots for comparisons between the reference ID-LC-MS/MS (x-axis) and (E) Fujirebio, (F) Abbott, (G) Beckman and (H) Roche assay (y-axis). The blue solid line represents the relative mean difference between paired measurements, dashed blue lines indicate upper and lower limits of agreement (±1.96 SD). One and two reference samples were excluded for the Abbott and Roche assay, respectively, because the values obtained exceeded the linear measuring range of the assay.
91% (95% CI: 83.1%–96%)]. The corresponding propor-tions with the three other automated methods was 12% with the Abbott assay [sensitivity: 90.9% (95% CI: 58.7%– 98.5%), specificity 97.8% (95% CI: 92.1%–99.7%)], 21% with the Beckman method [sensitivity: 90.9% (95% CI: 58.7%–98.5%), specificity 87.6% (95% CI: 79%–93.7%)] and 13% with the Roche method [sensitivity: 72.7% (95% CI: 39.1%–93.7%), specificity 94.4% (95% CI: 87.4%– 98.1%)], as shown in Figure 5.
Considering 50 nmol/L threshold for insufficiency, the Abbott assay results demonstrated a good agreement with the LC-MS/MS method (κ = 0.85), whereas the Fujire-bio and the two other automated methods showed mod-erate agreement; Fujirebio (κ = 0.66), Roche κ = 0.62) and Beckman (κ = 0.56).
Discussion
This study was conducted to evaluate the analytical and clinical performance of Fujirebio’s Lumipulse G 25-OH vitamin D assay and to compare it to an in-house LC-MS/ MS method and three other automated assays. The Fujire-bio assay showed an acceptable imprecision over the entire measuring range. Among the immunoassays tested, the Fujirebio assay demonstrated the highest correlation with the LC-MS/MS method, however with a consistent negative mean bias. Similar performance of the assay was observed in the assay accuracy testing using the Labquality reference serum panel vs. the reference ID-LC-MS/MS method. For the observed negative bias of the Fujirebio 25(OH)D assay vs. both LC-MS/MS methods, a correction could be considered.
In general, the Fujirebio assay demonstrated an acceptable correlation with other automated assays tested in this study except for the Roche assay.
This study adds to a growing literature [9–17, 22–28] that has shown marked variations in the performance of commercial assays for 25(OH)D. Compared to LC-MS/MS, each of Fujirebio, Beckman and Abbott assays underes-timated 25(OH)D values in the serum samples measured, whereas the Roche method resulted in overestimation of 25(OH)D particularly at values above 50 nmol/L. Overes-timation of 25(OH)D values with both Abbott Architect and Roche Elecsys in the upper part of the measuring range has been reported previously which may in part due to calibration problem of these two assays at high 25(OH)D concentrations [13, 15, 23]. In the accuracy per-formance testing using Labquality reference serum panel, both Roche and Abbott displayed a similar bias at higher 25(OH)D concentrations as with study serum samples.
These differences in assay performance translated into marked discrepancies in the classification of patients’ vitamin D status. The proportion of patients who were classified as being vitamin D insufficient was consider-ably overestimated with automated assays as compared to the LC-MS/MS method. This has clear implications for clinical decision making, as it can lead to over-treatment. For example, with the Beckman assay, almost one in two patients was wrongly classified as being vitamin D insuf-ficient, compared to the results obtained with the LC-MS/ MS method. Such discrepancies have been documented previously for currently available 25(OH)D assays [11, 15] and it is clear that results may not be directly comparable if assays are performed in different laboratories using dif-ferent methods.
Although LC-MS/MS is widely accepted as the ‘gold standard’ for the measurement of 25(OH)D [24], and is the only method capable of measuring all known vitamin D metabolites, automated systems such as those evaluated in this study have an important place in clinical labora-tory practice, particularly in view of the current growth in demand for vitamin D assays. They offer a number of advantages over LC-MS/MS assays, particularly in terms of turn-around and convenience. Furthermore, LC-MS/ MS assays require specialized equipment and expertise. However, the development of automated assays for 25(OH) has proved to be problematic [12]. Vitamin D is difficult to measure, for a number of reasons. It is a small hydro-phobic molecule, and therefore subject to matrix effects resulting from interference by lipids: this problem is not encountered with chromatographic or competitive protein binding assays. In addition, it is tightly bound to vitamin D binding protein (VDBP), which can compete with captur-ing antibodies used in immunoassays, or with other com-petitive binding proteins; inaccuracy in some of Abbott’s Architect assay, has been shown to be largely dependent on VDBP concentrations [16, 17, 22].
A further problem is the difficult extraction of the vitamin from VDBP by automated assays. Fujirebio uses novel steroid compound (X) to extract the 25(OH)D from VDBP by the effect of a similar steroid compound (X), which can extract vitamin D from VDBP. Whether this novel extraction procedure leads to a better release of VDBP and more accurate 25(OH)D measurement remains to be proven. Further studies are needed to evaluate the performance of Fujirebio assay in patient populations with various amounts of VDBP like pregnant women and hemodialysis patients.
Furthermore, antibodies used in the different assays have varying cross-reactivities with other vitamin D metabolites, and this presents another source of variation
between assays. As shown in Table 1, some automated immunoassays and protein binding assay exhibit non-equimolar detection of 25(OH)D3 and the less active metabolite 25(OH)D2; however, the concentration of 25(OH)D2 relative to total vitamin D concentrations in our routine specimens is minor. It is noteworthy that with our LC-MS/MS method, only one sample out of 100 serum samples tested in this study contained quantifi-able amounts of 25(OH)D2. The concentration of 25(OH) D2 measured was 5.29 nmol/L, equaling 7.25% of the total 25(OH)D. In the accuracy testing using Labqualtiy refer-ence serum samples that contained significant amounts of 25(OH)D2, all automated assays tested underestimated total 25(OH)D values as compared with the reference ID-LC-MS/MS values. The mean differences ranged from –3.24% (Roche) to –15.83% (Beckman). In Switzerland and several European countries, vitamin D2 is irrelevant because vitamin D2 supplements are not used, in contrast to United States, where vitamin D2 supplementation is typically used. Further studies are needed to assess the performance of Fujirebio assay in samples containing varies amounts of endogenous 25(OH)D2.
The cross-reactivity toward the recently identified 3-epi 25(OH)D3, as reported by the assay manufacturers, varies between 2.7% with the Abbott method to 91% with the Roche method. However, it was shown that Roche assay recognizes 3-epimer metabolite when added by spiking, but not when it is native [25]. The impact of 3-epi-25(OH)D3 has been shown to be significant in infants, where it accounts for 15%–41% of the total 25(OH)D, compared with 2.5%–17% in adults [26]. Currently, there are no recommendations for routine measurement and reporting the 3-epimer metabo-lite, as the physiological importance of the C3-epimerization pathway is not fully understood. It is noteworthy that sepa-ration of the 3-epimer of 25(OH) vitamin D3 is not possible with our LC-MS/MS method as the 3-epimer has an identical mass/charge ratio to 25(OH)D3, and was thus falsely meas-ured as this metabolite. However, this limitation is unlikely to explain the significant negative biases observed against our LC-MS/MS because both Beckman and Fujirebio assays demonstrated similar negative bias in the assay accuracy testing as compared to target values measured with the ref-erence ID-LC/MS/MS method (sum of 25(OH)2 and 25(OH) D3 excluding the 3-epimer metabolite values).
The recent introduction of SRMs such as SRM 972a, which was used to standardize the calibrators of the LC-MS/MS assay used in this study, has reduced variabil-ity between assays, but the performance of many assays remains suboptimal particularly in patients containing different amounts of VDBP like pregnant women and hemodialysis patients [27].
For the current study, correlation coefficients obtained between automated assays and LC-MS/MS methods are higher for the Labquality samples (20 serum samples from healthy donors) than those for our study samples from routine clinical practice (n = 100). Interest-ingly, no difference was observed when comparing the Fujirebio results with the LC-MS/MS method for Labqual-ity samples (R = 0.996) vs. study samples (R = 0.986), which may indicate that Fujirebio assay is less sensitive to serum matrix effects than other automated assays tested. Further studies are needed to confirm this observation.
In conclusion, measuring 25(OH)D is still challeng-ing for clinical laboratories. Generally, the new Fujirebio 25-OH vitamin D assay correlates well with most auto-mated assays tested and with the LC-MS/MS method. The performance of the assay is well-suited for routine 25(OH) D measurement in clinical serum samples.
Acknowledgments: We are grateful to Abbott, Beckman Coulter, Fujirebio and Roche for having provided their reagents for this study free of charge. We thank Tanja Wiedemann, Anuschka Beccato, Ursula Gutteck, and Beate Jaworek from Institute of clinical chemistry for their excellent technical assistance.
Author contributions: All the authors have accepted responsibility for the entire content of this submitted manuscript and approved submission.
Research funding: We thank Fujirebio Europe N.V for financial sponsorship of this study. 25-Hydroxy vitamin D assay kits from Roche, Beckmann, and Abbott were pro-vided by the respective companies without cost and the involvement of the companies in the study design, analysis and interpretation of data and writing of the manuscript. Employment or leadership: None declared.
Honorarium: None declared.
Competing interests: The funding organization(s) played no role in the study design; in the collection, analysis, and interpretation of data; in the writing of the report; or in the decision to submit the report for publication.
References
1. Holick MF. Vitamin D deficiency: a worldwide problem with health consequences. Am J Clin Nutr 2008;87:10805–65.
2. Holick MF. Vitamin D status: measurement, interpretation and clinical application. Ann Epidemiol 2009;19:73–8.
3. Ross AC, Manson JE, Abrams SA, Aloia JF, Brannon PM, Clinton SK, et al. The 2011 report on dietary reference intakes for calcium and vitamin D from the Institute of Medicine: what clinicians need to know. J Clin Endocrinol Metab 2011;96:53–8.
4. Dawson-Hughes B, Mithal A, Bonjour JP, Boonen S, Burckhardt P, Fuleihan GE, et al. IOF position statement: vitamin D recommen-dations for older adults. Osteoporos Int 2010;21:1151–4. 5. Holick MF, Binkley NC, Bischoff-Ferrari HA, Gordon CM,
Hanley DA, Heaney RP, et al. Evaluation, treatment, and pre-vention of vitamin D deficiency: an Endocrine Society clinical practice guideline. J Clin Endocrinol Metab 2011;96:1911–30. 6. Bischoff-Ferrari HA, Dawson-Hughes B, Stöcklin E, Sidelnikov E,
Willett WC, Edel JO, et al. Oral supplementation with 25(OH)D3 versus vitamin D3: effects on 25(OH)D levels, lower extremity function, blood pressure, and markers of innate immunity. J Bone Miner Res 2012;27:160–9.
7. Souberbielle JC, Body JJ, Lappe JM, Plebani M, Shoenfeld Y, Wang TJ, et al. Vitamin D and musculoskeletal health, cardiovas-cular disease, autoimmunity and cancer: recommendations for clinical practice. Autoimmun Rev 2010;9:709–15.
8. Pittas AG, Sun Q, Manson JE, Dawson-Hughes B, Hu FB. Plasma 25-hydroxy vitamin D concentration and risk of incident type 2 diabetes in women. Diabetes Care 2010;33:2021–3.
9. Holmes EW, Garbincius J, McKenna KM. Analytical variability among methods for the measurement of 25-hydroxyvitamin D: still adding to the noise. Am J Clin Pathol 2013;140:550–60. 10. Fraser WD, Milan AM. Vitamin D assays: past and present
debates, difficulties, and developments. Calcif Tissue Int 2013;92:118–27.
11. Farrell CJ, Martin S, McWhinney B, Straub I, Williams P, Herrmann M. State-of-the-art vitamin D assays: a comparison of automated immunoassays with liquid chromatography-tandem mass spectrometry methods. Clin Chem 2012;58:531–42. 12. Farrell CJ, Soldo J, Williams P, Herrmann M. 25-Hydroxyvitmain
D testing: challenging the performance of current automated immunoassays. Clin Chem Lab Med 2012;50:1953–63. 13. Schöttker B, Jansen EH, Haug U, Schomburg L, Köhrle J,
Brenner H. Standardization of misleading immunoassay based 25-hydroxyvitamin D levels with liquid chromatography tandem-mass spectrometry in a large cohort study. PLoS One 2012;7:e48774.
14. Janssen MJ, Wielders JP, Bekker CC, Boesten LS, Buijs MM, Heijboer AC, et al. Multicenter comparison study of current methods to measure 25-hydroxyvitamin D in serum. Steroids 2012;77:1366–72.
15. Moon HW, Cho JH, Hur M, Song J, Oh GY, Park CM, et al. Comparison of four current 25-hydroxyvitamin D assays. Clin Biochem 2012;45:326–30.
16. Depreter B, Heijboer AC, Langlois MR. Accuracy of three automated 25-hydroxyvitamin D assays in hemodialysis patients. Clin Chim Acta 2013;415:255–60.
17. Cavalier E, Lukas P, Crine Y, Peeters S, Carlisi A, Le Goff C, et al. Evaluation of automated immunoassays for 25(OH)-vitamin D
determination in different critical populations before and after standardization of the assays. Clin Chim Acta 2014;431:60–5. 18. Omi K, Ando T, Sakyu T, Shirakawa T, Uchida Y, Oka A, et al.
Noncompetitive immunoassay detection system for hap-tens on the basis of antimetatype antibodies. Clin Chem 2015;61:627–35.
19. Passing H, Bablok. A new biometrical procedure for testing the equality of measurements from two different analytical meth-ods. Application of linear regression procedures for method comparison studies in clinical chemistry, Part I. J Clin Chem Clin Biochem 1983;21:709–20.
20. Bland JM, Altman DG. Statistical methods for assessing agree-ment between two methods of clinical measureagree-ment. Lancet 1986;1:307–10.
21. Stöckl D, Sluss PM, Linda M. Thienpont. Specifications for trueness and precision of a reference measurement system for serum/plasma 25-hydroxyvitamin D analysis. Clinica Chimica Acta 2009;408:8–13.
22. Heijboer AC, Blankenstein MA, Kema IP, Buijs MM. Accuracy of 6 routine 25-hydroxyvitamin D assays: influence of vitamin D binding protein concentration. Clin Chem 2012;58:543–8. 23. Cavalier E, Carlisi A, Bekaert AC, Rousselle O, Chapelle JP,
Souberbielle JC. Analytical evaluation of the new Abbott Architect 25-OH vitamin D assay. Clin Biochem 2012;45: 505–8.
24. Kobold U. Approaches to measurement of vitamin D concen-trations – mass spectrometry. Scand J Clin Lab Invest Suppl 2012;243:54–9.
25. Van Den Ouweland JM, Beijers AM, Van Daal H, Elisen MG, Steen G, Wielders PM. Evaluation of 3-epi-25-hydroxyvitamin D3 cross-reactivity in the Roche Elecsys Vitamin D Total protein binding assay. Clin Chem Lab Med 2013;52:373–80.
26. Bailey D, Veljkoviic K, Yazdanpanah M, Adeli K. Analytical measurement and clinical relevance of vitamin D3 C3-epimer. Clin Biochem 2013;46;190–6.
27. Bedner M, Lippa KA, Tai SS. An assessment of 25-hydroxyvita-min D measurements in comparability studies conducted by the Vitamin D Metabolites Quality Assurance Program. Clin Chim Acta 2013;15:426:6–11.
28. Stepman HC, Vanderroost A, Van Uytfanghe K, Thienpont LM. Candidate reference measurement procedures for serum 25-hydroxyvitamin D3and 25-hydroxyvitamin D2 by using isotope dilution liquid chromatography-tandem mass spectro-photometry. Clin Chem 2011;57:441–8.
Supplemental Material: The online version of this article (DOI: 10.1515/cclm-2015-0427) offers supplementary material, available to authorized users.