1
Environmental-mediated relationships between tree growth of black spruce and 1
abundance of spruce budworm along a latitudinal transect in Quebec, Canada 2
3
Angelo Fierravanti1,2, Claudia Cocozza1, Caterina Palombo1, Sergio Rossi2, Annie 4
Deslauriers2, Roberto Tognetti1,3 5
1 Dipartimento di Bioscienze e Territorio, Università degli Studi del Molise, Contrada Fonte
6
Lappone, Pesche, I-86090, Italy
7
2 Departement des Sciences Fondamentales, Université du Québec à Chicoutimi, 555
8
boulevard de l’Université, Chicoutimi, QC-G7H2B1, Canada
9
3 The EFI Project Centre on Mountain Forests (MOUNTFOR), Edmund Mach Foundation,
10
San Michele all’Adige, I-38010, Italy
11 12
Corresponding author: claudia.cocozza@unimol.it
13 14
Abstract 15
Changes in tree growth and insect distribution are projected due to climate warming. The
16
expected effects of climate change on forest disturbance (e.g., insect outbreak) regime call for
17
a better insight into the growth responses of trees to varying environmental conditions over
18
geographical regions in eastern North America. In this study, the effects of a latitudinal thermal
19
gradient and spruce budworm (SBW) outbreaks on the tree growth of black spruce (Picea
20
mariana Mill.) were investigated along a 400 km transect from 48° N to 51° N across the
21
continuous boreal forest in Quebec, Canada. Time series data were analyzed to synchronize
22
climatic factors (temperature and precipitation trends), insect dynamics (SBW population
23
frequency) and tree growth (ring-width chronology). Radial growth resulted as being
24
synchronized with climate patterns, highlighting a positive effect of maximum temperatures on
25
tree growth, especially in the northernmost site. Increasing temperatures and precipitation had
26
a more positive effect on tree growth during epidemic periods, whereas the detrimental effects
27
of SBW outbreaks on tree growth were observed with climate patterns characterized by
28
lowered temperature. The lag between time series, synchrony and/or frequency of synchrony
29
between tree growth and SBW outbreak were considered in order to link the growth of host
30
trees and the dynamics of insect populations. The proposed analytical approach defined damage
2
severity on tree growth in relation to population dynamics and climate fluctuations at the
32
northern distribution limit of the insect.Overall, a decline in tree growth was observed in these
33
boreal forests, due to SBW outbreaks acting in combination with other stress factors.
34 35
Keywords: tree growth dynamics; insect population outbreaks; synchronicity analysis; climate 36
change; black spruce
37
1. Introduction 38
In addition to the stressful conditions commonly experienced by boreal trees during extreme
39
events, climate change is modifying disturbance regimes, increasing tree mortality and
40
affecting species composition in boreal ecosystems (Candau and Fleming et al. 2011). In
41
Canada, spruce budworm (Choristoneura fumiferana Clemens) (SBW) outbreaks cause
42
recurrent growth declines of balsam fir (Abies balsamea L. Mill.), the main host of this
43
defoliator (Boulanger et al. 2012). However, during epidemic periods, when the SBW
44
population density is higher, other coniferous species, such as white spruce (Picea glauca
45
Moench Voss), black spruce (Picea mariana Mill.) and red spruce (Picea rubens Sarg.), can
46
also be severely defoliated (Simard et al. 2012). In spring, the feeding activity of the larvae is
47
perfectly synchronized with balsam fir needle emergence. However, the currently increasing
48
temperatures could advance insect and plant phenology, mismatching the synchronisms with
49
balsam fir and making black spruce a more suitable host for SBW. This could modify the SBW
50
target host, dramatically increasing the outbreak severity in the northern boreal zone, the black
51
spruce domain, whereas the southern parts of the range would become too warm to sustain high
52
SBW population levels (Régnière et al. 2012). In Quebec, Canada, three major SBW outbreaks
53
occurred during the 20th century, in 1915–1929, 1946–1959 (Boulanger et al. 2012) and
1974-54
1988 (Boulet et al. 1996). The latter caused the defoliation of 55 million ha of black spruce
55
stands. The first outbreak of the 21st century is still ongoing in eastern Canada, where the
56
defoliated area has doubled every year since 2005. In 2012, more than 2 million ha of forest
57
were affected (Direction de la protection des forêts 2012).
58
The SBW periodicity is defined by migrations and local population dynamics (Shlichta and
59
Smilanich 2012). Jardon et al. (2003) studied this periodicity, synchronism and impact of SBW
60
in Quebec, observing cyclical outbreaks occurring with frequency of 25-28 years at a
supra-61
regional level and lasting 8 years or more (Jardon et al. 2003; Tremblay et al. 2011). Climate
62
is the main factor that drives SBW dynamics, and the range of the outbreaks is predicted to
63
shift beyond the traditional limits as the climate becomes more favorable (Bouchard and
3
Pothier 2010; Régnière et al. 2012; Zhang et al. 2014). Warmer winter temperatures can lead
65
to overwintering survival, significantly increasing the abundance of insect populations (Han
66
and Bauce 2000), and longer summers in Eastern Canada may make northern sites more
67
suitable for SBW attacks. The fluctuations in insect survival, caused by a poor synchronism
68
between larval and bud phenology, seem to affect black spruce, whose bud flush is later than
69
that of balsam fir and white spruce (Régnière et al. 2012). An increase in mean annual
70
temperature of 2–5 °C across eastern Canada in the next 50 years, as projected by current
71
climate models (Christensen et al. 2007), may induce phenological changes and trophic
72
interactions among host trees, herbivorous insects and their natural enemies in boreal forests
73
(Pureswaran et al. in press). Indeed, northern expansion of SBW in Quebec and
climate-74
induced narrowing of the phenological mismatch between the insect and its secondary host
75
may trigger more severe defoliation and mortality in black spruce forests.
76
Climatic factors play an important role in defining the severity and duration of outbreaks , as
77
well as their synchrony (Gray 2008; Williams and Liebhold 2000). The degree of biological
78
synchrony between host (black spruce) and parasite (SBW) depends on the overlap of the
79
potential distribution of trees (as source of needles) and insect populations (Régnière et al.
80
2012). Therefore, the synchrony between tree growth and SBW dynamics is useful in order to
81
understand the evolution and intensity of outbreaks, and the effect of severe infestation on
82
stand productivity (Boulanger et al. 2012). Using the predictions of the effects of climate
83
change on SBW outbreaks, models are required that describe how SBW defoliation dynamics
84
interact with tree growth patterns across seasons and landscapes, and how they could affect the
85
future productivity of forests (Krause et al. 2012). Moreover, Candau and Fleming (2011)
86
found that the spatial distribution of past defoliation was related to winter and spring
87
temperatures, and stand composition. However, the role of climate in determining the spatial
88
and temporal distribution of defoliation caused by SBW and the interactions with stand
89
productivity are still uncertain, as is the relative importance of the various causes of tree
90
mortality (insect outbreaks vs. drought spells).
91
An innovative approach was applied in this paper, with the aim of examining the dynamics of
92
black spruce growth in relation to the role of climatic factors in determining the severity and
93
duration of SBW outbreaks, rather than reconstructing the history of SBW outbreaks using
94
dendrochronology. We applied a mathematical function on time series data (Cocozza et al.
95
2012) to synchronize climatic factors (temperature and precipitation trends), insect dynamics
96
(SBW populations), and tree growth (ring-width chronologies) obtained in black spruce stands
97
along a latitudinal gradient in Quebec. We expected that 1) changes in monthly temperatures
4
and precipitation during the 20th century have progressively amplified the sensitivity of black
99
spruce to SBW incidence, increasing synchrony between time series (tree rings and SBW
100
outbreaks) and growth reduction during outbreaks, and 2) tree growth patterns have also varied
101
along a latitudinal gradient under the influence of changing SBW synchrony, with growth of
102
northern trees benefiting from warming and with greater phenological synchrony between
103
black spruce and SBW in warmer sites.
104 105
2. Materials and methods 106
2.1. Study area 107
The study was conducted in black spruce stands from 48 to 51° N within the continuous boreal
108
forest of Quebec, Canada (Fig. 1). The climate is subhumid-subpolar continental with mean
109
annual temperatures ranging between -0.9 and 2.0 °C. The region has long winters with
110
temperatures below zero, January being the coldest month with extremes of –47 °C, and short
111
summers with maximum absolute temperatures exceeding 30 °C (Lugo et al. 2012). The
112
landscape is characterized by glacial till deposits and an undulating morphology with many
113
gently-sloping hills reaching 500–700 m a.s.l. (Rossi et al. 2011).
114
Four permanent sites were selected along a latitudinal gradient, Simoncouche (abbreviated as
115
SIM) at the lowest latitude, Bernatchez (BER) at the highest altitude, Mistassibi (MIS), and
116
Camp Daniel (DAN), the coldest site (Fig. 1) (Lugo et al. 2012).
117 118
2.2. Dendrochronological analysis 119
Fieldwork was carried out in summer 2013.In each site, the trees were selected to maximize
120
the temporal and spatial extent of the time series. Care was also taken to select trees with
121
canopies well separated from each other to reduce the effect of competition on tree growth.
122
Two increment cores were extracted from 21 (SIM), 18 (BER and DAN) and 20 (DAN) black
123
spruce trees with an increment borer 0.5 cm in diameter, at breast height (1.3 m) and at an angle
124
of 120° from one another. Cores were mounted on channeled wood sticks, seasoned in a
fresh-125
air dry store and sanded.
126
Tree ring widths (TRW) were measured to the nearest 0.01 mm using the
LINTAB-127
measurement equipment at 60× magnifications. The Time Series Analysis Programme
128
(TSAPWin) software package (Frank Rinn, Heidelberg, Germany) was used for statistical
129
analyses on tree rings. TRW chronologies of each tree were cross-dated first visually and then
130
statistically by the percentage agreement in the signs of the first-differences of the two time
5
series (the Gleichläufigkeit, Glk) (Kaennel and Schweingruber 1995). The Glk is a measure of
132
the year-to-year agreement calculated as the number of times that two series show the same
133
upward or downward trend relative to the previous year. With an overlap of 10 years, Glk
134
becomes significant (p < 0.05) at 76% and highly significant (p < 0.01) at 87%. In this study,
135
the analyzed time series were mostly longer than 50 years and cross dating was considered
136
successful if Glk was higher than 60%. The statistical significance of the Glk (GSL) was also
137
computed. In addition, the TVBP, a Student’s t value, and the cross date index (CDI) were used
138
to investigate the significance of the best match; acceptable comparability is assumed with
t-139
value higher than 3, and values of CDI > 10 were considered as being significant. The TVBP
140
is a statistical tool commonly used to compare and cross-date ring-width series, which
141
determines the degree of correlation between curves and eliminates low-frequency variations
142
within the time series as each value is divided by the corresponding 5-year moving average.
143
The software ARSTAN was used to standardize individual chronologies, producing
tree-144
growth index (TRI) chronologies for each study area (Cook et al. 1990). A spline function with
145
a 50% frequency response of 32 years was fitted to each tree ring raw series, computed by
146
dividing observed by expected values. Mean standard chronologies were then used to analyze
147
climate–growth relationships.
148
Descriptive statistics were applied to compare key properties of each chronology and included
149
mean sensitivity (MS) and tree ring width SD, useful to assess high-frequency variations; mean
150
inter-series correlation (rbar) for all possible pairings of tree ring series from individual cores
151
over a common time interval (Briffa 1995); first order serial autocorrelation (AC), measuring
152
the persistence retained before and after standardization and expressed population signal (EPS;
153
Wigley et al. 1984), which was determined by calculating the chronology signal as a fraction
154
of the total chronology variance, quantifies the degree to which a particular sample chronology
155
portrays a hypothetically perfect chronology. An EPS > 0.85 is considered a generally
156
acceptable threshold for reliable chronologies.
157 158
2.3. Climate and pupae frequency 159
A dataset of climate, including total precipitation (Pc), mean maximum temperature (Tx), mean
160
minimum temperature (Tn), and instar pupae relative frequency (SBW) was obtained by the
161
interpolation of the 100 weather stations closest to the study sites and adjusted considering the
162
geographical coordinates of each site by means of BioSIM 10 - Canada 1901-2011 package
163
(Régnière and St-Amant 2007; Anderson and Sturtevant 2011; Jobidon et al. 2015). BIOSIM
6
is a reliable tool that has been repeatedly tested (Anderson and Sturtevant 2011; Simard et al.
165
2011; Régnière et al. 2012; Sturtevant et al. 2013). The BioSIM database was used to determine
166
the frequency and time of the SBW phenological phases (Régnière et. al. 2014). The relative
167
frequency of SBW instar pupae was used to determine the mortality of instar larvae. The
168
average frequencies of pupae were used to represent the relative presence of this stage.
169
Therefore, an increase in the frequency of pupae was assumed to correspond to a decrease in
170
SBW mortality.
171
The epidemic and endemic periods were derived from the dendrochronological reconstruction
172
of Boulanger et al. (2012), which represents a model exercise to determine the negative interval
173
of SBW outbreaks during long-period trends. In time series analysis, it is essential to consider
174
autocorrelation or serial correlation, defined as the correlation of a variable with itself over
175
successive time intervals. Temporal autocorrelation of climate variables and SBW patterns was
176
accounted (p < 0.05) and performed in JMP 11 (SAS Institute, Cary, NC). Autocorrelation
177
increases the chances of detecting significant trends, even if they are absent. However, the
178
autocorrelation was not removed from the standardized chronologies in order to preserve the
179
outbreak signal (Boulanger and Arseneault 2004). Climate and SBW time series were not
180
standardized to maintain the long-term signal of chronologies.
181 182
2.4. Climate, tree growth and SBW relationships 183
The influence of climate on tree growth was assessed using the BootRes package (Zang and
184
Biondi 2013) in R environment (R Foundation for Statistical Computing, Vienna, Austria). The
185
climate-growth relationship was studied by correlation function (CF) analysis using the
186
climatic variables from June of the previous year to August of the current year as independent
187
variables, and the four standard mean chronologies as dependent variables. In order to analyze
188
time series lags and correlations, cross dating of curves was performed using TSAPWin and
189
considering TRW as reference, and Pc, Tx, Tn or SBW (instar pupae frequency) as sample for
190
every epidemic and endemic period. Time series curves, sorted in epidemic and endemic
191
periods, were moved into TSAPwin to determine the Glk and GSL, considering time lags
192
between 0 (no lag) and 5 years. The percentage of agreement between time series was
193
calculated taking into account a minimum of 65% overlapping at lag of 5 years (a GSL
194
threshold for maximum statistical significance).
195 196
2.5. Trend analysis 197
7
The trend detection in tree growth and environmental parameters at the four sites was
198
considered. Pearson’s correlation coefficient was used to determine significant relationships
199
between the climatic variables and tree growth.
200
Mean rank differences (Kruskal and Wallis 1952) was performed using OriginalPRO 8
201
software, considering the non parametric distribution statistically significant when p < 0.05, in
202
order to test the similarity of different samples (time series).
203
The Mann-Kendall test, nonparametric test for monotonic trends, provided indication of
204
whether a trend exists and if the trend is positive or negative, using the Kendall R-statistical
205
package (McLeod 2013; Tognetti et al. 2014). Subsequent calculation of the rank correlation
206
coefficient, Kendall’s tau, allowed the comparison of the strength of the correlation between
207
two data series; tau ranges between -1 and 1 and measures the degree of similarity between
208
ranks of pairs of chronologies. The resultant Mann-Kendall test statistic (S) indicated how
209
strong the trends in ring width and environmental variables are and whether they are increasing
210 or decreasing. 211 212 2.6. Synchronicity analysis 213
Long intervals of synchrony (> 4 years) between tree growth patterns and SBW population
214
dynamics were taken into account in order to verify the timing of events, quantify the extent
215
and strength of temporal and spatial variability in outbreak frequency and duration, determine
216
the nature of populationfluctuations, as well as the presence and strength of spatial synchrony.
217
The synchronism between the trends of tree-ring width, climate and SBW during 1901-2011
218
(CID - complete interval derivative) was performed applying the derivative function approach
219
on time-series data (Cocozza et al. 2012). The derivative analysis was conducted with
220
TSAPWin software. The derivative of the function describes the best linear approximation with
221
respect to time of the function for each chosen value. This analysis allowed the rate of variation
222
of a function to be emphasized: when the derivative is positive the input function is increasing,
223
otherwise the function is decreasing. Moreover, the higher the value of the derivative, the faster
224
is the change in the value of the function. The derivative approach was used to study the length
225
and frequency of synchronized intervals, in order to verify the occurrence of positive SBW
226
outbreaks and negative tree growth.
227
Climate patterns were defined combining the derivative values of the climatic trends in CID,
228
epidemic and endemic periods. The most frequent patterns were then correlated to tree growth
229
and SBW trends in epidemic and endemic periods. The comparison of tree growth with climate
8
patterns and SBW derivative series was made computing Pearson correlation coefficients.
231
Derivative functions were applied on the standardized time series.
232 233
3. Results 234
3.1. Time series patterns 235
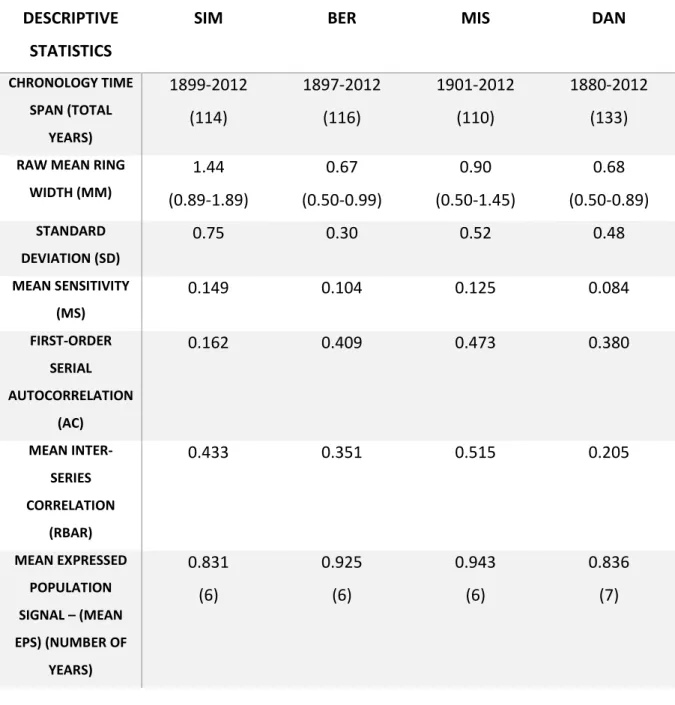
Descriptive statistics of the mean standard chronologies of each study area were above the
236
minimum significance (Glk > 60; TVBP > 5; CDI > 10). The statistical cross-dating between
237
individual standard chronologies with the same latitude led to a 5% discard of the total cores,
238
giving significant EPS values (> 0.85) in each site. TRW series spanned from 50 (SIM) to 133
239
(DAN) years with a mean tree age of 101 years. Common trends of tree growth were found in
240
all sites, negative behaviors of series were particularly visible during the outbreaks in
1946-241
1959 and 1974-1988 (Fig. 2); the 2005-2012 outbreak is ongoing and has not been considered
242
for further analysis. Mean TRW was 0.92 mm, ranging from 0.50, in the northern sites, to 1.89
243
mm, in SIM. Mean sensitivity and tree ring width SD were 0.115 and 0.51, respectively (Table
244
1).
245
The bootstrapped correlation coefficients were significant for total precipitation in December
246
of the previous year for BER and MIS, and in May of the current year for DAN (Fig. 3). Total
247
precipitation was not significant for SIM (Fig. 3). Mean Tx and Tn affected tree growth,
248
especially in DAN, showing a positive significant correlation with most of the spring and
249
summer months of the current year (April, June and July). Mean Tx and Tn of December of
250
the previous year also correlated positively with tree growth in DAN (Fig. 3).
251
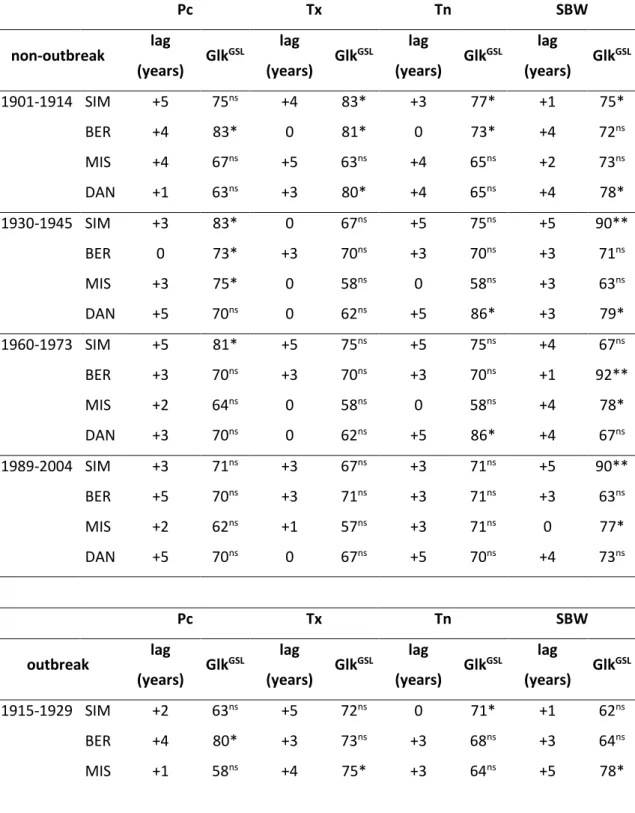
Time lags between time series were found in endemic and epidemic periods with values from
252
+1 to +5 years (Glk ranged between 56 and 92); whereas, no lags (0) were found in some cases
253
(Glk ranging between 57 and 83) (Table 2). High values (GSL > 95%) of statistical significance
254
of time lags were found between tree growth and SBW in endemic periods (Table 2).
255
Mann–Kendall test showed a significant decreasing trend of TRW in all sites (p < 0.01) (Table
256
3). Significant increasing trends of Pc and Tn were found in all sites (p = 0.001); a significant
257
increasing trend of SBW was found in SIM (p = 0.001); instead, a significant increasing trend
258
of Tx was found in MIS (p = 0.001), and a significant decreasing trend of Tx in BER (p = 0.01)
259
(Table 3). 260
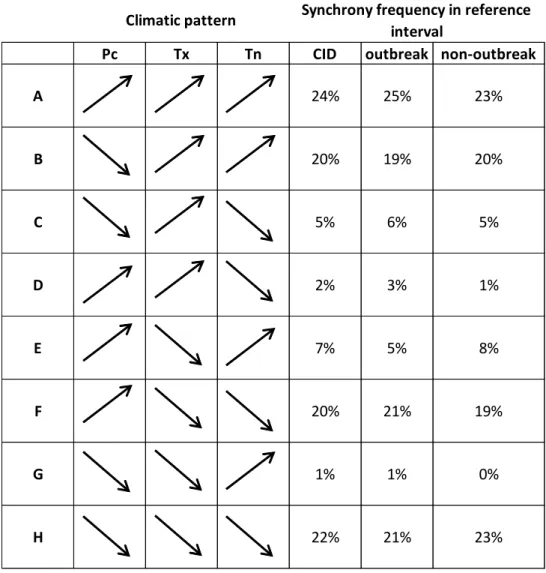
Patterns of climatic variables were obtained by the combination of increasing or decreasing
261
trends of the variables considered (Table 4). The frequency of each climate pattern was defined
262
for CID, endemic and epidemic periods. The most frequent climate patterns were defined by:
263
increase of Pc, Tx and Tn, with values of synchrony frequency of 24, 25, and 23% in CID,
9
outbreak and non-outbreak intervals/periods, respectively (pattern A); decrease of Pc and
265
increase of Tx and Tn, with synchrony frequency of 20, 19, and 20% in CID, outbreak and
266
non-outbreak periods, respectively (pattern B); increase of Pc and decrease of Tx and Tn, with
267
synchrony frequency of 20, 21 and 10% in CID, outbreak and non-outbreak periods,
268
respectively (pattern F); decrease of Pc, Tx and Tn, with synchrony frequency of 22, 21 and
269
23% in CID, outbreak and non-outbreak periods, respectively (pattern H) (Table 4).
270 271
3.2. Synchronicity output 272
According to the results of the homogeneity test (Kruskal-Wallis test), non-significant
273
differences were found between time series (Table 3), indicating a similarity between TRW
274
time series and each environmental variable. Greater synchrony was recorded between TRI and
275
Tx for non-outbreak periods in the intervals 1928-38 and 1995-2003 for SIM, 1923-31 and
276
1907-16 for BER, and 1910-20 for DAN (these results were determined as shown for SIM in
277
Fig. 4, for the sake of representativeness). Synchrony was also observed between TRI and Tn
278
in 1912-21 for DAN, between TRI and Tn, and Tx, in 1964-71 for MIS, and Pc in 1964-71 for
279
DAN (data not shown). This analysis highlighted synchrony and asynchrony periods, as the
280
correspondence of increasing TRI with increasing SBW and vice versa, and detecting time lags
281
between TRI and SBW, as reported in Figure 4 for SIM (as an example for all sites). High
282
frequency was recorded for synchrony intervals from 1 to 6 years, for all the variables. The
283
intervals of 2 and 3 consecutive years were the most representative for the synchrony of TRI
284
with Pc, Tx and Tn, while intervals of 2 and 4 consecutive years were relevant in the case of
285
the synchrony of TRI with SBW (instar pupae frequency) (Fig. 5).
286
Pearson’s correlation showed significantly different relationships between TRI and climatic
287
variables and SBWat each site, as defined by the relative mean frequency of synchronization
288
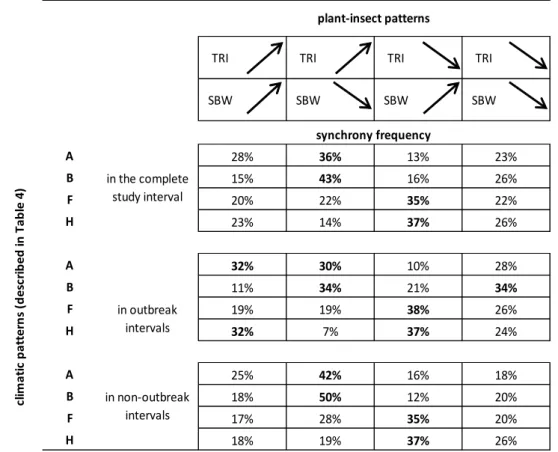
(Table 3). Relationships between climate patterns and TRI and SBW (instar pupae relative
289
frequency) were defined in CID (Table 5). Patterns showed high synchrony percentage in the
290
considered intervals; however, plant-insect patterns did not always change with the same
291
outline. Patterns of increasing TRI and SBW were detected with higher frequency in the
292
outbreak periods. Patterns of increasing TRI and decreasing SBW were observed in the three
293
considered intervals, as well as patterns of decreasing TRI and increasing SBW. Instead,
294
patterns of decreasing TRI and SBW were more frequent in epidemic periods, in the climate
295 pattern B (Table 5). 296 297 4. Discussion 298
10 4.1. Tree growth and climate responses 299
The growth of black spruce responded positively to increasing precipitation during the growing
300
season and temperature in spring (Fig. 3). Tree–ring width was synchronized with climate
301
patterns, highlighting a positive effect of maximum temperatures on the growth of black spruce,
302
especially in the northernmost site (DAN) (Table 3). The controlling role of water availability
303
and heat accumulation for radial increments in conifers of the eastern Canadian boreal forest
304
has previously been documented (Genries et al. 2012; Drobyshev et al. 2013). Air temperature
305
plays an important role in triggering the onset of spring photosynthesis in boreal conifers,
306
which may affect the overall tree carbon assimilation (Tanja et al. 2003). In the same
307
populations, Rossi et al. (2014) found that warmer sites had earlier onset and later ending of
308
growth, resulting in longer durations and higher intensity of cell production. Moreover, high
309
spring temperatures can also advance soil thawing for the growth resumption, resulting in an
310
earlier availability of water for roots (Goodine et al. 2008). By contrast, a reduction in the
311
period and amount of xylem production along the thermal gradient is associated with both later
312
resumptions of growth in spring and earlier conclusions of xylem differentiation in autumn
313
(Rossi et al. 2007).
314
A positive effect of increased summer precipitation was observed on tree growth of the
315
following year (Fig. 3). Instead, high temperatures in later summer negatively affected the
316
growth of black spruce the following year, by enhancing stand evapotranspiration and water
317
deficit. The period of wood production, from mid-May to the end of August, likely benefits
318
from a combination of late season increase in water availability and summer warmth,
319
particularly at high latitudes (Ko Heinrichs et al. 2007). Nevertheless, the influence of
320
temperature on the cambial activity of Norway spruce changes during the year, with a
321
culmination in early spring (Gričar et al. 2007). At the same sampling sites as the current study,
322
the onset of xylem growth in black spruce occurred from late May to mid-June (DOY
146-323
169), covering a range of more than 20 days (Rossi et al. 2011); the ending of xylem growth
324
varied by more than a month, from early September in DAN and MIS to early October in SIM.
325
Rossi et al. (2011) estimated longer durations of xylogenesis at higher temperatures, with
326
increases of 8–11 days °C-1 and a lengthening of 25% with a 3 °C increase in mean annual
327
temperature, with potentially larger tree rings and stand productivity. Nevertheless, our results
328
showed a tree growth decline in these boreal forests, regardless of the rising atmospheric CO2
329
levels during the past century. Trees growing on these thin and unstructured soils might suffer
330
from drought stress and nutrient limitation (Silva et al. 2010), which add to SBW disturbance.
11
A longer period for primary and secondary tree growth can result in disproportional resource
332
requirements, particularly at lower latitudes of the closed black-spruce forest. If water supply
333
is not sufficient to sustain evaporative demand, because saturation vapor pressure increases
334
exponentially with increasing temperature, vapor pressure deficit increases exponentially when
335
temperature increases and absolute humidity remains constant (Centritto et al. 2011).
336
Consistent growth decreases or minor growth changes have been forecast in southern forest
337
stands of Quebec (below 49° N) by modeling studies (Huang et al. 2013). At these latitudes, a
338
significant amount of the precipitation generally falls in the form of rain in summer, allowing
339
relatively constant water availability during the growing season. Although no detrimental
340
decrease of soil water availability has been observed in the studied area (Rossi et al. 2014), and
341
the occurrence of drought-induced reduction in xylem growth has been considered unlikely in
342
black spruce (Krause et al. 2010; Belien et al. 2012), the southern closed boreal forest may
343
experience water stress and composition shift with warming over time.
344 345
4.2. Relationships between tree growth and climate and SBW 346
Increases of temperature and precipitation (climate pattern A, Table 4) had more positive
347
effects on tree growth during the epidemic periods (Table 5). The positive effect of warm
348
summer temperature and late season precipitation on tree radial growth probably decreased the
349
susceptibility of black spruce to insect damage in SBW outbreaks, as shown in the plant-insect
350
pattern defined by increasing trends of tree growth and SBW (instar pupae frequency).
351
However, Simard et al. (2008) found that carbon isotope enrichment and tree ring width
352
decreased synchronicity in A. balsamea and P. mariana, which strongly supports a
353
photosynthetic compensation induced by defoliation. Consequently, foliage availability might
354
have sustained insect feeding and oviposition. This would have substantially increased the
355
number of potential offspring of the following generation. Instead, the role of precipitation in
356
winter was limited, mainly falling as snow that only melts successively.
357
Tree growth reduction induced by SBW outbreaks was comparable to previous studies (e.g.,
358
Kneeshaw et al. 2011). They showed more intense growth declines in correspondence to
mid-359
century outbreaks than at the beginning and end of the century (e.g., Jardon et al. 2003). The
360
effect of SBW increasing trend on the tree growth decline was observed when climate patterns
361
F and H occurred (Table 5). This may suggest a different damage severity in relation to
362
population dynamics and climate fluctuations at the northern distribution limit of the insect,
363
and the eventual shift of SBW feeding preferences towards other primary producers (Gray
364
2008).
12
Alternating synchronous or asynchronous time series highlighted a temporal lag in the response
366
of tree growth to SBW outbreaks, which induced a marked reduction in tree growth during the
367
following year. This may be misleading about the harmfulness of SBW infestations in the
368
current year and on projecting a negative trend in black spruce growth. However, an ecological
369
link between host tree growth and insect population dynamics does exist and, in the long term,
370
may evolve towards an altered frequency of SBW outbreaks in association with changes in
371
climate and other external factors affecting black spruce.
372
The derivative analysis of synchronous cycles in tree growth trends and insect population
373
dynamics suggests repeated and rapid SBW outbreaks, inducing marked growth reductions.
374
The excessive feeding on buds and foliage produced a distinctive tree-ring signal.
375
Consequently, a cyclic decrease of the insect population might be triggered by a hunger induced
376
migration of moths to neighboring stands. Tree-ring studies in eastern Canada have shown that
377
large SBW outbreaks usually develop over several years, and may expand from epicenters
378
becoming less suitable for SBW (Jardon et al. 2003). However, the identification of SBW
379
outbreaks did not always involve an impact on black spruce growth in the current year (Fig. 4).
380
A delay in tree growth reduction was observed with lags from 1 to 4 years (Table 2), suggesting
381
an effect of SBW outbreak on tree growth after the outbreak period when the insect population
382
was decreasing. It may be assumed that the SBW outbreak was not immediately visible but that
383
the insects brought about a progressive deterioration of the tree health after 3-4 years. SBW
384
showed short (1-2 years) and negative intervals of synchrony, defined by simultaneous
385
decreasing of the tree growth and SBW (instar pupae frequency) after four years, when food
386
resources were exhausted. This implies that insect population dynamics may further
387
differentiate tree growth patterns, in association with climate driven-factors (Gray 2008).
388
The lag between time series has been debated in the last decade, synchrony and/or frequency
389
synchrony being observed between tree growth and SBW outbreak (Jardon et al. 2003;
390
Boulanger and Arseneault 2004). It has been suggested that lags are based on growth patterns,
391
e.g., the growth reduction in mature trees did not necessarily occur during the first year of a
392
moderate to severe defoliation, which appears earlier in the upper canopy and depends on tree
393
height (e.g., Krause et al. 2012). The branches can be defoliated at different intensity and times,
394
resulting in a gradual loss of biomass and, consequently, a marked reduction in secondary
395
growth and tree-ring width (Krause et al. 2012).
396
Generally, stand characteristics (forest type, stand structure, tree age, etc.) in the insect
397
inventory can vary between locations, leading to incomplete assessment of insect disturbances
398
and dynamics (Cooke and Roland 2007). Spatial and temporal factors affect outbreak dynamics
13
in forest ecosystems, inducing an overestimation of defoliated areas or species (Huang et al.
400
2008). Careful identification of synchrony between the growth of host trees and the occurrence
401
of SBW outbreaks might provide valid information in order to expand the insect inventory
402
database and tree disturbance responses at temporal and spatial scales. This approach will be
403
useful in evaluating tree growth responses to climate and potential divergences. In the far north,
404
weather stations are typically sparse, and often located some distance from and at different
405
elevations than the tree-ring sites, which can cause decoupling of climatic conditions between
406
the tree-ring sites and weather stations, making comparisons and homogenization difficult
407 (D’Arrigo et al. 2008). 408 409 5. Conclusions 410
Tree growth in boreal forests was subjected to the additive interaction of SBW recurrent
411
outbreaks with the environment. The synchronization of tree-ring chronologies with insect
412
outbreaks provided a practical tool for the reconstruction of pest events and plant responses, as
413
proxy for population dynamics. The assessment of the temporal and spatial variability of events
414
was demonstrated to be useful in determining the frequency of SBW outbreaks and interactions
415
with other disturbances, as well as the presence and strength of spatial autocorrelation, and
416
describing the nature of population fluctuations. Increasing temperature and precipitation had
417
more positive effects on tree growth in epidemic periods. Warm summer temperature and late
418
season precipitation favored radial growth, probably decreasing the susceptibility of black
419
spruce to insect damage during outbreaks.
420
This approach combining black spruce growth patterns and SBW population dynamics can
421
help to disentangle the external forces, namely ongoing climate change, regulating periodicity
422
and variability in time and space of insect outbreak regimes. In order to reduce the uncertainty
423
in regional predictions, models using climate indexes at the global scale could incorporate the
424
synchronization analysis of population dynamics and local drivers in Eastern Canada. Although
425
the results are specific to black spruce and SBW in Quebec, we expect that a synchronization
426
analysis of time series (climate patterns, tree growth and defoliation cycles) will be equally
427
useful in explaining temporal fluctuations and defining hazard rates in other areas and on
428
different trees, caused by outbreaks of other insect species.
429 430
ACKNOWLEDGEMENTS 431
14
The authors thank A. De Cristofaro and F. Lombardi (Università degli Studi del Molise) for
432
their suggestions on insect traits and dendrochronology, and A. Garside for editing the English
433
text. The research is linked to activities conducted within the COST FP1106 (STReESS -
434
Studying Tree Responses to extreme Events: a SynthesiS).
435
436
REFERENCES 437
Anderson, D.P., Sturtevant, B.R., 2011. Pattern analysis of eastern spruce budworm
438
Choristoneura fumiferana dispersal. Ecography 34, 488497.
439
Belien, E., Rossi, S., Morin, H., Deslauriers, A., 2012. Xylogenesis in black spruce subjected
440
to rain exclusion in the field. Can. J. For. Res. 42, 1306–1315.
441
Bouchard, M., Pothier, D., 2010. Spatiotemporal variability in tree and stand mortality caused
442
by spruce budworm outbreaks in eastern Quebec. Can. J. For. Res. 40, 86–94.
443
Boulanger, Y., Arseneault, D., 2004. Spruce budworm outbreaks in eastern Quebec over the
444
last 450 years. Can. J. For. Res. 34, 1035-1043.
445
Boulanger, Y., Arseneault, D., Morin, H., Jardon, Y., Bertrand, P., Dagneau, C., 2012.
446
Dendrochronological reconstruction of spruce budworm (Choristoneura fumiferana) outbreaks
447
in southern Quebec for the last 400 years. Can. J. For. Res. 42, 1264-1276.
448
Boulet, B., Chabot, M., Dorais, L., Dupot, A., Gagnon, R., 1996. Entomologie forestière. Dans
449
Manulle de foresterie. Sous la direction de Bérard, J.A., Côté, M., Les Presses de l’Universitè
450
Laval, Quèbec, pp. 1008-1043.
451
Briffa, K.R., 1995. Statistical aspects of the interpretation of high-resolution proxy climate
452
data: the example of dendroclimatology. In: Von Storch, H. Navarra, A. (eds.), Analysis of
453
climate variability: applications of statistical techniques, Springer, Berlin, pp. 77-94.
454
Candau, J-N., Fleming, R.A., 2011. Forecasting the response of spruce budworm defoliation
455
to climate change in Ontario. Can. J. For. Res. 41, 1948-1960.
456
Centritto, M., Tognetti, R., Leitgeb, E., Střelcová, K., Cohen, S., 2011. Above ground processes
457
- anticipating climate change influences. In: Bredemeier, M., Cohen, S., Godbold, D., Lode,
458
E., Pichler, V., Schleppi, P. (eds.), Forest management and the water cycle, Springer, Berlin,
459
Ecological Studies 212: 31–64.
460
Christensen, J.H., Carter, T.R., Rummukainen, M., Amanatidis, G., 2007. Evaluating the
461
performance and utility of regional climate models: The PRUDENCE project. Climatic Change
462
81(Suppl.), 1–6.
15
Cocozza, C., Giovannelli, A., Lasserre, B., Cantini, C., Lombardi, F., Tognetti, R., 2012. A
464
novel mathematical procedure to interpret the stem radius variation in olive trees. Agric. For.
465
Meteorol. 161, 80-93.
466
Cook, E.R., Briffa, K, Shiyatov, S., Mazepa, V., 1990. Tree standardization and growth-trend
467
estimation. In: Cook, E.R., Kairiukstis, L. (eds.), Methods of dendrochronology, Kluwer,
468
Amsterdam, pp. 104-132.
469
Cooke, B.J., Roland, J., 2007. Trembling aspen responses to drought and defoliation by forest
470
tent caterpillar and reconstruction of recent outbreaks in Ontario. Can. J. Forest Res. 37,
1586-471
1598.
472
D’Arrigo, R., Wilson, R., Liepert, B., Cherubini, P., 2008. On the ‘divergence problem’ in
473
Northern forests: a review of the tree-ring evidence and possible causes. Glob. Planet. Change
474
60, 289–305.
475
Direction de la protection des fôrets, 2012. Aires infestées par la tordeuse des bourgeons de
476
l’epinette au Québec en 2012. In: MRNF (ed.), Gouvernement du Québec, p. 21.
477
Drobyshev, I., Gewehr, S., Berninger, F., Bergeron, Y., 2013. Species specific growth
478
responses of black spruce and trembling aspen may enhance resilience of boreal forest to
479
climate change. J. Ecol. 101, 231-242.
480
Genries, A., Drobyshev, I., Bergeron, Y., 2012. Growth-climate response of jack pine on clay
481
soils in northeastern Canada. Dendrochronologia 30, 127-136.
482
Goodine, G.K., Lavigne, M.B., Krasowski, M.J., 2008. Springtime resumption of
483
photosynthesis in balsam fir (Abies balsamea). Tree Physiol. 28, 1069-1076.
484
Gray, D.R., 2008. The relationship between climate and outbreak characteristics of the spruce
485
budworm in eastern Canada. Climatic Change 87, 361–383.
486
Gričar, J., Zupančič, M., Čufar, K., Oven, P., 2007. Regular cambial activity and xylem and
487
phloem formation in locally heated and cooled stem portions of Norway spruce. Wood Sci.
488
Technol. 41, 463 – 475.
489
Han, E.N., Bauce, E., 2000. Dormancy in the life cycle of the spruce budworm: physiological
490
mechanisms and ecological implications. Rec. Res. Dev. Entomol. 3, 43–54.
491
Huang, J.-G., Bergeron, Y., Berninger, F., Zhai, L., Tardif, J.C., et al., 2013. Impact of future
492
climate on radial growth of four major boreal tree species in the eastern Canadian boreal forest.
493
PLoS ONE 8, e56758.
494
Huang, J.G., Tardif, J., Denneler, B., Bergeron, Y., Berninger, F., 2008. Tree-ring evidence
495
extends the historic northern range limit of severe defoliation by insects in the aspen stands of
496
western Quebec, Canada. Can. J. For. Res. 38, 2535–2544.
16
Jardon, Y., Morin, H., Dutilleul, P., 2003. Périodicité et synchronisme des épidémies de la
498
tordeuse des bourgeons de l’épinette au Québec. Can. J. For. Res. 33, 1947–1961.
499
Jobidon, R., Bergeron, Y., Robitaille, A., Raulier, F., Gauthier, S., Imbeau, L., Saucier, J.-P.,
500
Boudreault, C., 2015. A biophysical approach to delineate a northern limit to commercial
501
forestry: the case of Quebec’s boreal forest. Can. J. For. Res. 45, 515–528.
502
Kaennel, K., Schweingruber, F.H., 1995. Multilingual glossary of dendrochronology. Terms
503
and definitions in English, German, French, Spanish, Italian, Portuguese, and Russian. Swiss
504
Federal Institute for Forest, Snow and Landscape Research, Birmensdorf. Paul Haupt
505
Publishers, Berne, p. 467.
506
Kneeshaw, D., Bergeron, Y., Kuuluvainen, T., 2011. Forest ecosystem dynamics across the
507
circumboreal forest. In: Millington, A.C., Blumler, M.A., MacDonald, G., Shickhoff, U.,
508
(eds.), Handbook of biogeography, Sage, Washington, Chapter 14, pp. 261–268.
509
Ko Heinrichs, D., Tardif, J.C., Bergeron, Y., 2007. Xylem production in six tree species
510
growing on an island in the boreal forest region of western Quebec. Canada. Can. J. Bot. 85,
511
518-525.
512
Krause, C., Luszczynski, B., Morin, H., Rossi, S., Plourde, P.Y., 2012. Timing of growth
513
reductions in black spruce stem and branches during the 1970s spruce budworm outbreak. Can.
514
J. For. Res. 42, 1220–1227.
515
Krause, C., Rossi, S., Thibeault-Martel, M., Plourde, P.-Y., 2010. Relationships of climate and
516
cell features in stems and roots of black spruce and balsam fir. Ann. For. Sci. 67, 402.
517
Kruskal, W.H., Wallis, W.A., 1952. Use of ranks in one criterion variance analysis. J. Am. Stat.
518
Ass. 47, 583-621.
519
Lugo, J.L., Deslauriers, A., Rossi, S., 2012. Duration of xylogenesis in black spruce lengthened
520
between 1950 and 2010. Ann. Bot. 110, 1099-1108.
521
McLeod, A.I., 2013. Kendall rank correlation and Mann-Kendall trend test, Package ‘Kendall’,
522
CRAN R statistical software.
523
Pureswaran, D.S., De Grandpré, L., Paré, D., Taylor, A., Barrette, M., Morin, H., Régnière, J.,
524
Kneeshaw, D.D., in press. Climate-induced changes in host tree-insect phenology may drive
525
ecological state-shift in boreal forest. Ecology. http://dx.doi.org/10.1890/13-2366.1.
526
Régnière, J., Saint-Amant, R., Bechard, A., 2014. BioSIM 10 – User’s Manual. Natural
527
Resources Canada, Canadian Forest Service, Laurentian Forestry Centre, Québec, Canada.
528
Régnière, J., St. Amant, R., Duval, P., 2012. Predicting insect distributions under climate
529
change from physiological response: spruce budworm as an example. Biol. Invasions 14,
1571-530
1586.
17
Régnière, J., St-Amant, R., 2007. Stochastic simulation of daily air temperature and
532
precipitation from monthly normals in North America north of Mexico. Int. J. Biometeorol. 51,
533
415–430.
534
Rossi S., Deslauriers A., Anfodillo T., Carraro V. (2007) Evidence of threshold temperatures
535
for xylogenesis in conifers at high altitudes. Oecologia 152, 1–12.
536
Rossi, S., Girard, M.-J., Morin, H., 2014. Lengthening of the duration of xylogenesis engenders
537
disproportionate increases in xylem production. Glob. Change Biol. 20, 2261–2271.
538
Rossi, S., Morin, H., Deslauriers, A., Plourde, P.Y., 2011. Predicting xylem phenology in black
539
spruce under climate warming. Glob. Change Biol. 17, 614-625.
540
Shlichta, J.G., Smilanich, A.M., 2012. Immune responses and their potential role in insect
541
outbreaks. In: Barbosa, P., Letourneau, D.K., Agrawal, A.A. (eds.), Insect outbreaks revisited,
542
Blackwell Publishing Ltd., pp. 47-70.
543
Silva, L.C.R., Anand, M., Leithead, M.D., 2010. Recent widespread tree growth decline despite
544
increasing atmospheric CO2. PLoS ONE 5, e11543.
545
Simard, S., Elhani, S., Morin, H., Krause C., Cherubini, P., 2008. Carbon and oxygen stable
546
isotopes from tree-rings to identify spruce budworm outbreaks in the boreal forest of Québec.
547
Chem. Geol. 252, 80–87
548
Simard, S., Morin, H., Krause, C., 2011. Long-term spruce budworm outbreak dynamics
549
reconstructed from subfossil trees. J. Quatern. Sci. 26, 734–738.
550
Simard, S., Morin, H., Krause, C., Buhay, W.M., Treydte, K., 2012. Tree-ring widths and
551
isotopes of artificial defoliated balsam firs: A simulation of spruce budworm outbreaks in
552
Eastern Canada. Env. Exp. Bot. 81, 44-54.
553
Sturtevant, B.R., Achtemeier, G.L., Charney, J.J., Anderson, D.P., Cooke, B.J., Townsend,
554
P.A., 2013. Long-distance dispersal of spruce budworm (Choristoneura fumiferana Clemens)
555
in Minnesota (USA) and Ontario (Canada) via the atmospheric pathway. Agric. For. Meteorol.
556
168, 186– 200.
557
Tanja, S., Berninger, F., Vesala, T., Markkanen, T., Hari, P., Mäkelä, A., Ilvesniemi, H.,
558
Hänninen, H., Nikinmaa, E., Huttula, T., Laurila, T., Aurela, M., Grelle, A., Lindroth, A.,
559
Arneth, A., Shibistova, O., Lloyd, J., 2003. Air temperature triggers the recovery of evergreen
560
boreal forest photosynthesis in spring. Glob. Change Biol. 9, 1410–1426.
561
Tognetti, R., Lombardi, F., Lasserre, B., Cherubini, P., Marchetti, M., 2014. Tree-ring stable
562
isotopes reveal twentieth-century increases in water-use efficiency of Fagus sylvatica and
563
Nothofagus spp. in Italian and Chilean mountains. PLoS ONE 9, e113136.
18
Tremblay, M.J., Rossi, S., Morin, H., 2011. Growth dynamics of black spruce in stands located
565
between the 51st and 52nd parallels in the boreal forest of Quebec, Canada. Can. J. For. Res.
566
41, 1769-1778.
567
Wigley, T.M.L., Briffa, K.R., Jones, P.D., 1984. One the average value of correlated time
568
series, with applications in dendroclimatology and hydrometeorology. J. Appl. Meteorol. Clim.
569
23, 201 -213.
570
Williams, D.W., Liebhold, A.M., 2000. Spatial synchrony of spruce budworm outbreaks in
571
eastern North America. Ecology 81, 2753–2766.
572
Zang, C., Biondi, F., 2013. Dendroclimatic calibration in R: the bootRes package for response
573
and correlation function analysis. Dendrocronologia 31, 68-74.
574
Zhang, X., Lei, Y., Ma, Z., Kneeshaw, D., Peng, C., 2014. Insect-induced tree mortality of
575
boreal forests in eastern Canada under a changing climate. Ecol. Evolut. 4, 2384–2394.
576 577
19 578
Tables 579
Table 1 – Descriptive statistics for tree-ring chronologies at the sampling sites (SIM, BER, MIS, 580
DAN). The raw mean ring width and SD were computed on the raw tree ring series; MS, AC, rbar and 581
EPS were computed on the indexed tree ring series. 582
DESCRIPTIVE STATISTICS
SIM BER MIS DAN
CHRONOLOGY TIME SPAN (TOTAL YEARS) 1899-2012 (114) 1897-2012 (116) 1901-2012 (110) 1880-2012 (133)
RAW MEAN RING WIDTH (MM) 1.44 (0.89-1.89) 0.67 (0.50-0.99) 0.90 (0.50-1.45) 0.68 (0.50-0.89) STANDARD DEVIATION (SD) 0.75 0.30 0.52 0.48 MEAN SENSITIVITY (MS) 0.149 0.104 0.125 0.084 FIRST-ORDER SERIAL AUTOCORRELATION (AC) 0.162 0.409 0.473 0.380 MEAN INTER-SERIES CORRELATION (RBAR) 0.433 0.351 0.515 0.205 MEAN EXPRESSED POPULATION SIGNAL – (MEAN EPS) (NUMBER OF YEARS) 0.831 (6) 0.925 (6) 0.943 (6) 0.836 (7) 583
20
Table 2 - Statistical values of the cross-timing procedure in non-outbreak and outbreak periods. The 584
Glk (Gleichlaeüfigkeit) is a measure of year-to-year sign of agreement between the interval trend of 585
two chronologies, or the sum of the equal slope intervals as a percentage. Glk is significant, p < 0.05, 586
at 62%, and highly significant, p < 0.01, at 61%. The GSL is the statistical significance of the Glk 587
significance for the Glk value: * = 95%; ** = 99%. Lag represents the number years of shifts in 588
chronologies (adding or subtracting years from 0 to 5), this procedure was required to obtain the 589
maximum level of Glk and GSL by cross-dating. 590 591 Pc Tx Tn SBW non-outbreak lag (years) Glk GSL lag (years) Glk GSL lag (years) Glk GSL lag (years) Glk GSL 1901-1914 SIM +5 75ns +4 83* +3 77* +1 75* BER +4 83* 0 81* 0 73* +4 72ns MIS +4 67ns +5 63ns +4 65ns +2 73ns DAN +1 63ns +3 80* +4 65ns +4 78* 1930-1945 SIM +3 83* 0 67ns +5 75ns +5 90** BER 0 73* +3 70ns +3 70ns +3 71ns MIS +3 75* 0 58ns 0 58ns +3 63ns DAN +5 70ns 0 62ns +5 86* +3 79* 1960-1973 SIM +5 81* +5 75ns +5 75ns +4 67ns BER +3 70ns +3 70ns +3 70ns +1 92** MIS +2 64ns 0 58ns 0 58ns +4 78* DAN +3 70ns 0 62ns +5 86* +4 67ns 1989-2004 SIM +3 71ns +3 67ns +3 71ns +5 90** BER +5 70ns +3 71ns +3 71ns +3 63ns MIS +2 62ns +1 57ns +3 71ns 0 77* DAN +5 70ns 0 67ns +5 70ns +4 73ns Pc Tx Tn SBW outbreak lag (years) Glk GSL lag (years) Glk GSL lag (years) Glk GSL lag (years) Glk GSL 1915-1929 SIM +2 63ns +5 72ns 0 71* +1 62ns BER +4 80* +3 73ns +3 68ns +3 64ns MIS +1 58ns +4 75* +3 64ns +5 78*
21 DAN +4 75* +3 77* +3 82* +4 75* 1946-1959 SIM +3 65ns +2 68ns +4 72ns +4 67ns BER +5 56ns +5 75ns +1 79* +5 75ns MIS +4 78* +1 67ns +1 79* +5 81* DAN +5 81* 0 69ns +2 73ns +1 67ns 1974-1988 SIM +1 65ns 0 79* 0 75* +1 81* BER +4 60ns 0 57ns +2 58ns +4 80* MIS +4 70ns 0 57ns +3 55ns +4 80* DAN +4 70ns +4 65ns +4 65ns +5 72ns 592
22
Table 3 - Trend series analysis for the complete time interval (1901-2011): Pearson's correlation coefficients between TRI and climatic variables (Pc, Tx and 593
Tn) and SBW (instar pupae frequency); Mann–Kendall rank correlation test of tree ring width (TRW), total precipitation (Pc), mean maximum temperature 594
(Tx), mean minimum temperature (Tn), and insect data, instar pupae frequency (SBW) (S and tau values); Kruskal-Wallis test of TRI between sites for Pc, 595
Tx, Tn, and SBW (instar pupae frequency) (the significance level of the test is 5%) (p-values are shown). 596
597
SIM BER MIS DAN
Pearson correlation coefficient p-value correlation coefficient p-value correlation coefficient p-value correlation coefficient p-value
Pc 0.01 0.90 0.14 0.16 -0.20 0.03 0.04 0.69
Tx 0.20 0.02 0.15 0.13 0.19 0.05 0.25 0.08
Tn 0.14 0.14 0.10 0.27 0.11 0.25 0.23 0.02
SBW -0.18 0.06 0.00 0.97 0.03 0.79 -0.10 0.29
Kruskal-Wallis χ2 p-value χ2 p-value χ2 p-value χ2 p-value
Pc 45.8 0.71 67.8 0.04 45.4 0.66 36.6 0.44
Tx 56.6 0.31 19.7 0.45 60.4 0.15 40 0.30
Tn 51.6 0.49 53.5 0.31 56.1 0.26 36.4 0.45
SBW 56.8 0.30 50.2 0.43 61.4 0.13 33.8 0.57
Mann Kendhall tau S p-value tau S p-value tau S p-value tau S p-value
TRW -0.87 -1174 0.00 -0.74 -4932 0.00 -0.74 -4842 0.00 -0.74 -7581 0.00 Pc 0.22 1365 0.00 0.40 2447 0.00 0.33 1999 0.00 0.36 1303 0.00 Tx 0.07 427 0.28 -0.18 -1083 0.01 0.15 925 0.02 0.07 415 0.29 Tn 0.44 2673 0.00 0.28 1680 0.00 0.32 1945 0.00 0.41 2518 0.00 SBW 0.22 1303 0.00 0.06 360 0.36 0.06 380 0.33 -0.11 -675 0.09 598
23
Table 4 – Frequency (expressed in percentage) of climate patterns (expressed by letters), defined by 599
all trend combinations for climatic variables (Pc, Tx, Tn), where arrows refer to trend functions, in 600
CID (complete interval derivative), outbreak and non-outbreak periods. 601
602
Pc Tx Tn CID outbreak non-outbreak
A 24% 25% 23% B 20% 19% 20% C 5% 6% 5% D 2% 3% 1% E 7% 5% 8% F 20% 21% 19% G 1% 1% 0% H 22% 21% 23%
Synchrony frequency in reference interval
24
Table 5 – Relationships (expressed as frequency in percentage) between TRI and SWB (instar pupae 603
frequency) patterns and most frequent climate patterns (A, B, F, H) in CID, outbreak and non-604
outbreak periods (patterns with a frequency of more than 30% are expressed in bold). Patterns are 605
defined by arrows for increasing and decreasing trends. 606
607 608
TRI TRI TRI TRI
SBW SBW SBW SBW A B F H A B F H A B F H in outbreak intervals plant-insect patterns synchrony frequency 38% 21% 10% 37% 35% 16% 13% 23% 26% 22% cl im a ti c p a tt e rn s (d e sc ri b e d in T a b le 4 ) in non-outbreak intervals in the complete study interval 28% 15% 20% 23% 32% 11% 19% 32% 25% 18% 17% 18% 36% 43% 22% 14% 30% 34% 19% 7% 42% 50% 28% 19% 37% 35% 12% 16% 37% 26% 20% 20% 26% 28% 34% 26% 24% 18%
25 Figure captions
609
Fig. 1 - Map of the study area, with altitude (Alt.), latitude (Lat.) and longitude (Lon.) described for 610
each site. 611
Fig. 2 – Mean tree-ring width chronologies of black spruce (Picea mariana Mill.) trees in four 612
latitudinal plots within the boreal forest of Quebec (SIM is the lowest in latitude, DAN is the highest). 613
The dark gray windows (a), (b) and (c) correspond to outbreaks (1914-1929), (1946-1954) and (1974-614
1988); the light gray window shows the outbreak still in progress and not yet studied, from 2005 615
onwards. The white background shows the intervals without outbreak. The reference to 1901 is the 616
starting year of the analysis. 617
Fig. 3 – Correlation coefficients between tree growth and monthly climatic variables, Pc, Tx and Tn. 618
Correlations were calculated separately for each month for the period from June of the previous year 619
(lowercase letters) to August of the current year (uppercase letters), along the latitudinal transect from 620
SIM to DAN. 621
Fig. 4 - Derivative trends of tree-growth index (TRI) and instar pupae frequency (SBW) (a), and TRI 622
and mean maximum temperature (Tx) (d) at SIM (as representative of all sites) during the considered 623
period. Details of periods of asynchrony between derivative trends (b), where the time shift of the 624
series is detectable (c), and periods of synchrony between trends (c, e, f), where the overlap of the 625
curves are highlighted. 626
Fig. 5 – Frequency (expressed in number of cases) of the synchrony per number of consecutive years 627
between derivative values of TRI and Pc, Tx, Tn, and SBW (instar pupae frequency) in each site. 628