Science Arts & Métiers (SAM)
is an open access repository that collects the work of Arts et Métiers Institute of
Technology researchers and makes it freely available over the web where possible.
This is an author-deposited version published in: https://sam.ensam.eu Handle ID: .http://hdl.handle.net/10985/7621
To cite this version :
Sabeur MEZGHANI, Ibrahim DEMIRCI, Mohammed YOUSFI, Mohamed EL MANSORI -Running-in wear modeling of honed surface for combustion engine cylinder liners - Wear - Vol. 302, p.1360-1369 - 2013
Any correspondence concerning this service should be sent to the repository Administrator : archiveouverte@ensam.eu
Running-in wear modeling of honed surface for combustion engine
cylinder liners
S. Mezghani
1,*, I. Demirci
1, M. Yousfi
1,2, M. El Mansori
1 1 Arts et Métiers ParisTech, MSMP, Rue Saint Dominique, BP 508, 51006 Châlons-en-Champagne, Cedex, France2 RENAULT S.A.S., Direction de la Mécanique/Direction de l’Ingénierie Process, Rueil Malmaison (Paris), France
Abstract
The texture change during running-in alters the performance and efficiency of a tribo-mechanical system. During mass production of cylinder liners, a final finishing stage known as “plateau honing” is commonly added to reduce the running-in wear process of the liner surface. The majority of researchers think that this operation improves the engine efficiency and decreases oil consumption. It was believed that there are close links between the surface topography of honed cylinders change and their wear resistance during running-in. However, these interactions have not yet been established. Some running-in wear models were developed in the open literature to predict topographical surface changes without considering the running-in conditions.
The present paper thus investigates the various aspects of the wear modeling that caused running-in problems in honed surfaces and its implications on ring-pack friction performance. To illustrate this, plateau honing experiments under different conditions were first carried out on an instrumented vertical honing machine. The plateau honing experiments characterize the surface modifications during running-in wear of cast-iron engine bores using advanced characterization method. Based on the experimental evidence, a running-in wear model was developed. Finally, a numerical extension of the developed model was applied to solve the Reynolds equation by taking into account the real surface topographies of the engine bore. This enables us to predict realistic friction performance within the cylinder ring-pack tribosystem.
Keywords:Plateau honing, running-in, wear model, surface topography.
1. Introduction
Running-in is the beneficial wear of relatively moving interacting surfaces resulting in their gradual conformance and improved performance [1-3]. It helps piston rings/cylinder liners assemblies to reduce friction, oil consumption and the blow-by [4, 5]and to increase wear resistance, load carrying capacity and the scuffing resistance between mating surfaces [6].
Initial surface roughness is a dominant factor affecting running-in wear [3, 7]. An initial surface finish of the cylinder of 0.8 µm Ra for diesel engine was recommended before running-in to promote quick conformance [3]. According to Pawlus [8], wear during running-in depends on both the roughness height and the shape of the roughness profile ordinate distribution. Moreover, he suggests that plateau honing pressure on cylinder liner roughness parameters is negligible [8, 9]. Different previous studies highlight a strong connection between the topography of honed surfaces and their wear resistance during running-in [1, 5, 6]. In addition, some researchers claim that smooth plateau honing is more effective than rougher non-plateaued surfaces so it is not clear whether enhanced performance is due to the plateauing or to the fact that the surface is smoother. The wear process and surface smoothing mechanism during running-in is predominantly due to the removal of material without plastic deformation [5]. Sreenath suggests that the surfaces are smoothed further mostly by filling the valleys by wear debris in the later stage of in engine running-in test [5]. Horng founds that all running-in procedures transform the large valleys to many small valleys [6]. This allows to accommodate lubrication oil and protect relative surfaces. However, the total quantity of fluid retention as void volume per unit sampling area remains practically constant. The interdependence of various process factors (contact pressure, lubrication, temperature…) gave rise to different interpretations of the phenomenon. Rozeanu suggested indeed that running-in is an in situ machining that is complementary to production processes [10].
During mass production of cylinder liners, a final finishing stage known as “plateau honing” is commonly added to reduce the costly running-in period of the liner surface [3, 11, 12]. It generates plateaued surfaces that resemble a running-in surfaces and significantly reduced the wear process of the liner surface. The relationship between surface topography parameters contained in ISO 13565-2 (Rk family) and ISO 13565-3 (Rq family) standards and plateau honing process variables were analyzed in [8, 13, 14]. It found that the three dimensional Rq family parameters are more correlated to honing operating conditions than Rk family. Rpq and Rvq can control independently the surface topography changes when varying plateau honing time [8].
Thus, the optimization of the honed surface texture of cylinder liners to reduce the running-in wear process requires several running-in engine tests. As alternative to these costly experimental tests, several running-in model for prediction of wear and surface finish by neglecting plastic deformation were developed [1, 4, 15-20]. King et al. proposed the prediction of the changes of surface height distribution during wear process by a simple successive truncation of the initial surface profile by a plane [21]. Sugimura et al. developed a sliding wear model limited to Gaussian height distribution [22]. An extension of this model for general surface distribution was proposed by Jeng et Gao [7]. It is based on Johnson translatory system to describe surfaces with different height distribution [1]. The disadvantages of those models are the luck of their connection to the running-in operating conditions.
The aim of this research is to understand surface topographic changes during the stage of plateau honing of cylinder bores in connection with the operating process conditions. This allows, first to identify optimal working variables that produce surface finish comparable to that obtained after running-in process and reduce therefore the costly running-in period. Secondly, since like running-in performance generated by plateau honing stage, a comprehensive parametric running-in model can be devised from experimental plateau honing tests. It will take in consideration the contact variables such as honing pressure and sliding distance. Finally, the functional impact of the topographical changes of cylinder surfaces on the piston ring-pack system was simulated and analyzed.
Nomenclature
ah Hertzian contact radius (m) H Dimensionless film thickness
H0 Dimensionless rigid body displacement M, L Moes dimensionless parameters ph Hertzian pressure, Pa
hon
p
Abrasif/workpiece contact pressure (bar) pr Constant, pr = 1.96.108P Dimensionless pressure
pq
S
Root-mean square of the superficial plateau roughness of cylinder surface after plateau honing (µm)vq
S
Root-mean square of the valleys of cylinder surface after plateau honing (µm)pq i
S
Root-mean square of the superficial plateau roughness of cylinder surface before plateau honing (µm)vq i
S
Root-mean square of the valleys of cylinder surface before plateau honing (µm)hon
t
Number of plateau honing stroke (≡ plateau honing time) ui Velocity of surface ix,y,z Space coordonates
X,Y,Z Dimensionless space coordonates
zr Pressure viscosity index (Roelands), zr = pr /(ln(η0)+9.67) Dimensionless elastic deflection of the contacting bodies
Effective viscosities, dimensionless
µ
Viscosity, Pa.sDimensionless viscosity
µ
0 Ambient temperature zero-pressure viscosity, Pa.sµ
f Friction coefficientDimensionless lubricant density
0 Ambient temperature and pressure density, kg.m-3
Equivalent shear stress, Pa
Characteristic shear stress of Eyring fluid, Pa
Dimensionless mean shear stress
2. Experimental procedure
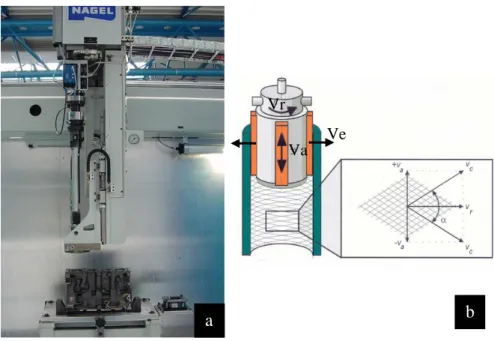
In this work, honing experiments were carried out on an instrumented vertical honing machine with an expansible tool (NAGEL n° 28-8470) (Figure 1). The workpiece consists of cylinder liner of lamellar gray cast iron engine crankcase. The young modulus and maximum tensile stress of the workpiece material are respectively 124 GPa and 200 MPa. These cylinders are typically usable in diesel engine for commercial vehicles. They are produced by an interrupted multistage abrasive finishing process, well known as the plateau-honing process. This very widely used process is a succession of three honing stages (rough, finish and plateau honing) [8,9, 23]. Table 1 shows the most important working variables applied for these tests.
The first stage often categorized as rough honing establishes the cylindricity of the bore (see table I). After rough honing, the cylinder liner diameter was Ø76.005 ±0.005. Then, the so called ″finish honing″ was performed using Vitrified Bonded Silicon Carbide (VBSC) stick. It is a IAS65/100I8S conventional stone where the average grit size was 107µm. This second honing operation creates the basic surface texture of the hole.
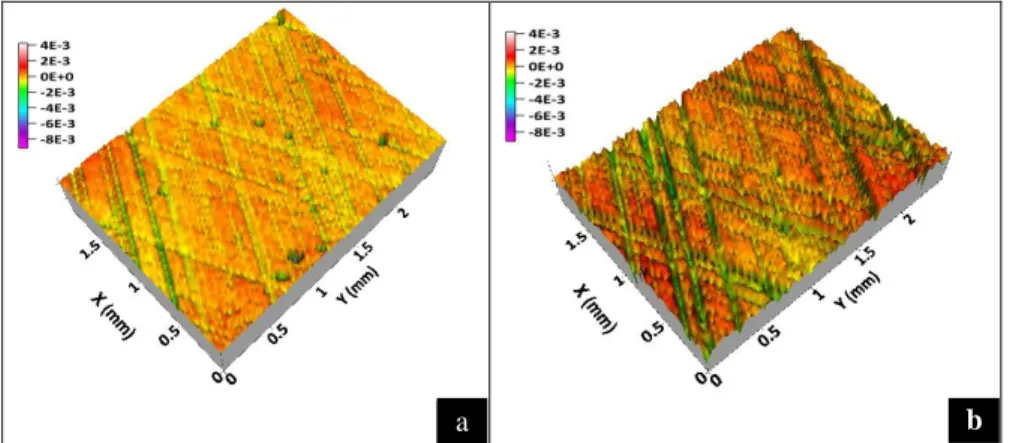
At this stage, two expansion velocities (1.5 and 6 µm/s) were considered while the other working variables were kept constant (see Table I). This variation in the fed system (the expansion mechanism in the honing head) allows generating two level of cylinder surface roughness with surface roughness parameter respectively Ra = 0.38µm ±0.1 and 0.70 µm ±0.06 (Figure 2).
Figure 1 (a) A vertical honing machine with expansible tool, (b) Schematic representation of the honing head in
continuous balanced movement.
Table I. Specific conditions of multistage surface production by honing
Honing parameters Rough Honing Finish Honing Plateau Honing
Axial speed (m/min) 28 28 23
Rotation speed (rpm) 230 230 230
Honing duration (sec) 20 15 2
Expansion type Mechanical Mechanical Hydraulic Expansion speed (µm/s) 5 3
Contact pressure (bar) 8 1.5, 6 2.3, 5.5, 10
Number of stones 6 6 6
Abrasive grit type Diamond Silicon Carbide Silicon Carbide
Grain size (µm) 125 107 30
Bond type Metallic Vitrified Vitrified Abrasive stone Dimensions (mm x mm x mm) 2x5x70 6x6x70 6x6x70
a
b
Ve
Vr
Figure 2 3D topographies of finish honed surface produced by using two different expansion velocity in finish
honing stage (a) 1.5 µm/s, (b) 6 µm/s and (Process working variables are given in Table I).
The final finishing stage known as “plateau honing” is commonly added to reduce the running-in wear process of the liner surface. Instrumented tests of the final plateau honing stage were performed with vitrified bonded silicon carbide stick where the average grit size was 30µm (see Table I). The selected average grit size is the commonly used one of plateau honing operation in the automotive industry. Honing oil was used to flow into the honing zone during the process. Plateau honing time and pressure were input variables in this study. Three plateau honing pressure (2.3, 5.5 and 10 bar) and five plateau honing durations (from 2 to 20 strokes) were considered while the other working variables were kept constant (see Table I).
For each plateau honing time, pressure, and initial surface roughness combination, experimental tests have been repeated three times. Scanning electron microscopy (SEM) observations were also performed to describe the obtained textured surface by honing. Negative surface replicas made of a silicon rubber material (Struers, Repliset F5) were used to assess the 3D texture of honed surfaces after the plateau-honing stage at the mid-height of the cylinder bore specimen [24]. Topographical features of replica surfaces were measured in three locations by a three-dimensional white light interferometer, WYKO 3300 NT (WLI). The surface was sampled at 640 × 480 points with the same step scale of 1.94 μm in the x and y directions. Form component is removed from acquired 3D data using least square method based on cubic Spline function.
The method of evaluation of cylinder liner wear volume during plateau honing process is based on the comparison of the surface bearing area curve of the original and the plateau honed surface [15]. The method is based on the fact that original surface depth is not removed when small amount of wear occurs. Experimental tests show that in the considered range of honing pressure, the wear still within the limits of the original surface topography when the range of stroke’s number of plateau honing process does not exceed 20 strokes. The average
power absorbed by the plateau honing process is calculated as the difference between on-load power recorded during the finishing and average off-loads power recorded before and after the test.
3 Numerical model for mixed elasto-hydrodynamic friction simulation in piston ring-pack system
The ring can experience three modes of lubrication – hydrodynamic (or elastohydrodynamic, elastic deformation of surface occurs due to high pressure), mixed and boundary. In pure hydrodynamic lubrication, there is no contact between the ring and liner, and the ring load is entirely support by hydrodynamic pressure in the oil film. In mixed lubrication regime, load is partially supported by the oil pressure and partially by contact asperities.
To take these phenomena into account, a numerical mixed elasto-hydrodynamic lubrication (EHL) model was developed to estimate the friction generated in the piston ring - cylinder contact. The model simulates the honed surface and the piston rings which constitute a tribological system that influences the longevity of the engine. The simulation was performed with piston ring and cylinder bore geometry. The piston ring surface was however considered smooth in comparison to cylinder bore surface. It is well known that the effect of the liner surface texture is predominated compared to this of the ring surface texture. The ring can be well approximated as smooth surface in the simulation [25]. The scope of this model is to qualitatively predict the friction coefficient obtained when the texture characteristics of surfaces are varied in order to optimize the performance.
2.1 Full-scale mixed EHL model
The generalized Reynolds’ equation introduced by Najji [26] has been used to estimate the pressure distribution, film thickness, and the friction coefficient. This equation has the advantage of not being restricted to a particular non-Newtonian law. The equation in the dimensionless form is given by:
where
,the boundary condition P = 0 and the cavitation P(X,Y) ≥ 0 must be satisfied during the simulation The effective viscosities could be calculated as considering the shear-thinning effect (Eyring fluid):
with, , where, τ0 is a reference shear stress and is the equivalent shear stress inside the lubricant film.
The lubricant’s viscosity and density are chosen to depend on pressure following the Dowson and Higginson formula [27] and Roelands law [28].
The film thickness equation is given in dimensionless form by the following equation:
Where, Zh is the height surface topography at each position (X,Y). The unknown constant H0 is determined by the force balance equation:
2.2 Numerical procedure
The Reynolds equation was solved by the finite difference method in order to obtain the film pressure distribution. The solution domain was determined as and . The computational grid covering the domain consisted of equally spaced 512x512 or 1024x1024 nodes. For more precision and validation, the reader can refer to the model described in [29].
The applied load FN was considered in the range of 10 to 100N. The sliding speeds varied between 0.5 and 5 m.s-1. The total friction µf in mixed lubrication is evaluated by summing up the boundary friction contributed by the contacted areas and the traction in the hydrodynamic regions:
where, τc is the shear stress between the contacting asperities at contact zone Ωc and τe is the shear stress of hydrodynamic films within the lubricated zone Ωc. τc is considered to be the shear stress of the boundary film which occurs when the local film thickness is less than 10nm in the present study. Hence τc can be determined by the Rabinowicz formula [30]:
Where, τs0 is the initial shear strength of the boundary film and γs is the pressure coefficient corresponding to the friction coefficient in boundary lubrication. In the present study γs and τs0 are equal to 0.1 and 2 MPa, respectively. If the local film thickness is equal to zero, solid-to-solid contacts occur and the friction coefficient is assumed to be constant [31]. It is equal to 0.25 in the present study.
3. Results and discussions
The analysis of the experimental results is based on the simultaneous characterization of the surface finish to understand the surface topography modification and the wear of the cylinder bore. Then, the correlation between surface texture change and predicted friction on cylinder ring-pack system is analyzed.
3.1 The effect of honing process variables on cylinder liner surface topography 3.1.1 SEM observations
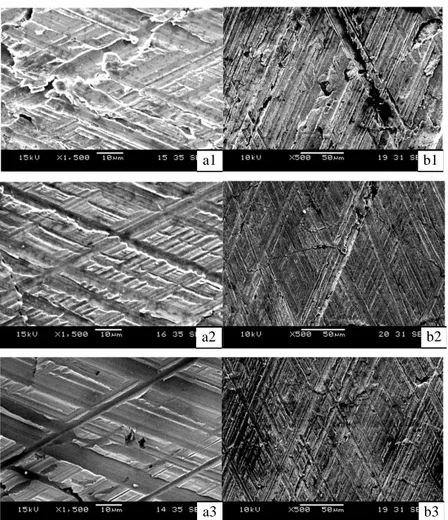
The surface textures of engine bores are examined after each plateau honing process. Figure 3 shows the evolution of surface topography of cylinder bore with initial roughness Ra equal to 0.7µm at different plateau honing time (≡ number of strokes) and with honing pressure of 5.5 bar.
Figure 3 SEM photographs x1500 (left) and x500 (right) of plateau honed surface topography where plateau
honing process operating conditions are 5.5 bar honing pressure at different number of stroke (honing time) : (a1-b1) 3 strokes, (a2-b2) 8 strokes and (a3-b3) 17 strokes.
a1
a2
a3 b3
b2 b1
As shown in this Figure, after 8 strokes, smear phenomenon was removed. The plateau honed surface (Figure 3-b2) presents more regular and smooth texture. Furthermore, we can observe a concentration of material near the top of the surface and the creation of finer grooves on the plateaus areas. After 17 strokes, the large grooves generated initially by finish honing began to disappear with the creation of some chatter marks and the presence of more graphite lamellas. Furthermore, the height of plateau region seems to be greater than the valleys depth.
3.1.2 Characterization of surface topography evolution
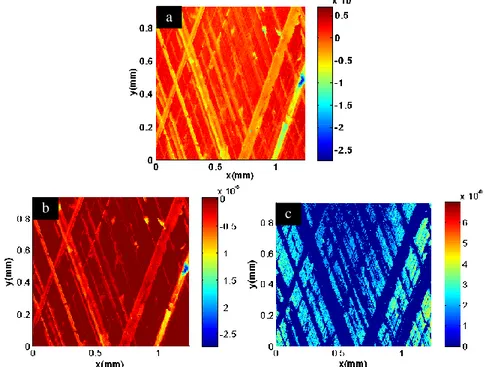
The surface texture of cylinder liners is composed of rough plateau separated by valleys. These elements play different roles in the cylinder-ring contact. It is then interesting to compute separately the characteristics of the plateau roughness and of the valleys. Thus, a morphological decomposition method that allows decomposition of a topographic surface into three components: the superficial roughness (i.e. plateaux roughness), valleys and reference surface (which includes form and waviness) has been applied to track the effect of plateau honing operating conditions. The methodology, described in [32], use an alternate sequential filter with a square structuring element, as non-linear image processing operator. The surface topography is filtered recursively with increasing the filter size after each filtering operation until reach the smallest form elements. Figure 4 shows an example of real topography decomposition.
Figure 4 Decomposition example of the surface topography of a cylinder liner using the alternate sequential
filtering; (a) Plateau honed surface topography, (b) superficial plateau component and (c) valleys surface component.
a
Then, the two fundamental parts of the cylinder surface (Superficial plateau and valleys components) are characterized by theirs root-mean square height respectively
S
pqandS
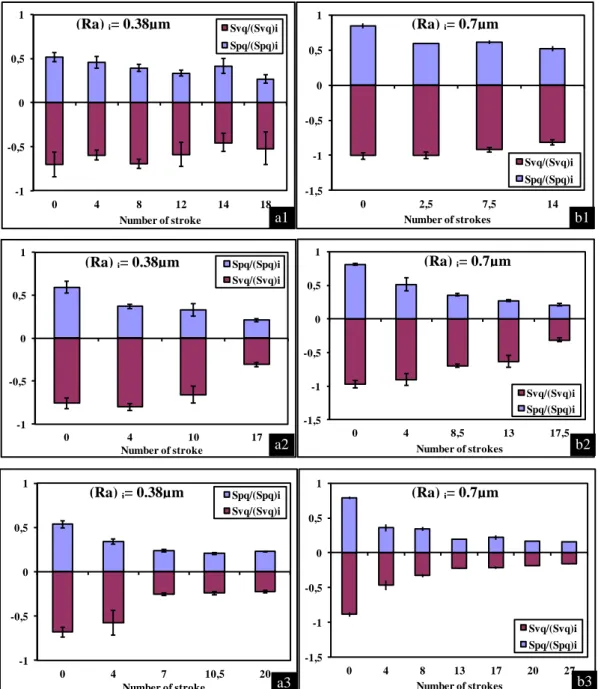
vq. These parameters are mutually independent and stable on cylinder surfaces.Figure 5 depicts the impact of plateau honing time (proportional to the number of axial stroke) and pressure on the surface topography of cylinder bore. It displays the evolution of the normalized root-mean square height of plateau and valleys component for different honing pressure and at various plateaus honing duration. One can see that the global roughness of honed surfaces decreases with increasing the plateau honing duration and rise to stable value. This stable value is reached more rapidly when honing pressure is higher and/or initial surface roughness is lower.
Figure 6 displays a contour map of the variations of the normalized root-mean square height of valleys component of cylinder bore surface topography vq
vq i
S
S
and the ratioS
pqS
vq function of the plateau honing pressure and the number of stroke (related to the honing duration). TheS
pqS
vqratio is relevant to performance quality of the honed texture at several industrial tests. The results are plotted for the two considered initial finish honed surface roughnessSa
equal to 0.38 µm andSa
equal to 0.70 µm.From Figure 6, the evolution map of the ratio
S
pqS
vqfunction of the two operating variables of the plateau honing process (number of stroke and pressure) can be decomposed into two zones of surface topography changes:- Zone (1) with a significant reduction of plateau roughness at the beginning of the plateau honing process which is greater than the valleys roughness reduction. This leads to a decrease of the ratio between plateau and valleys roughness. This zone takes the role, therefore, of the initial running-in operation for the Piston-Ring-Liner contact because the surface topography reaches a state of plateauedness surface [1]. It is expected that the lower plateau/valleys roughness ratio that can be reached by plateau honing is equal to 0.5. It’s attainable more quickly when the initial surface is smoother.
Moreover, contrarily to that affirmed in [8], the effect of plateau honing pressure on the surface roughness is not negligible. In fact, increase honing pressure, the running-in duration by plateau honing process is considerably reduced but lead to less plateauedness surface. Optimal plateauedness surfaces are obtained with honing pressure almost equal to 5 bar independently of the initial surface roughness. This suggests that a relatively severe contact condition is not suitable for the initial running-in process [9].
-1 -0,5 0 0,5 1 0 4 8 12 14 18 Number of stroke Svq/(Svq)i Spq/(Spq)i -1,5 -1 -0,5 0 0,5 1 0 2,5 7,5 14 Number of strokes Svq/(Svq)i Spq/(Spq)i -1 -0,5 0 0,5 1 0 4 10 17 Number of stroke Spq/(Spq)i Svq/(Svq)i -1,5 -1 -0,5 0 0,5 1 0 4 8,5 13 17,5 Number of strokes Svq/(Svq)i Spq/(Spq)i -1 -0,5 0 0,5 1 0 4 7 10,5 20 Number of stroke Spq/(Spq)i Svq/(Svq)i -1,5 -1 -0,5 0 0,5 1 0 4 8 13 17 20 27 Number of strokes Svq/(Svq)i Spq/(Spq)i
Figure 5 Changes of root-mean square height attenuation of plateau and valleys components of cylinder
surface during plateau honing stage for two different initial surface roughness (a1),(b1)
p
h=2.3 bar, (a2),(b2)h
p
=5.5 bar, (a3),(b3)p
h=10 bar.b3 a3 b2 a2 b1 a1 (Ra) i= 0.38µm (Ra) i= 0.38µm (Ra) i= 0.38µm (Ra) i= 0.7µm (Ra) i= 0.7µm (Ra) i= 0.7µm
0.25 0.25 0.3 0.3 0.35 0.35 0 .35 0.4 0.4 0.4 0 .45 0.45 0 .4 5 0.45 0.5 0.5 0 .5 0 .5 5 0.55 0 .5 5 0 .6 0.6 0 .6 0 .65 0.65 0 .65 0.65 0.7 0.7 0 .7 0 .7 0.7 0.75 0 .75 0.75 Number of stroke P la te a u h o n in g p re s s u re ( B a r) 0 5 10 15 3 4 5 6 7 8 9 10 0.3 0.4 0.5 0.6 0.7 0.8 0.9 1 0.3 0 .3 0.4 0.4 0 .4 0.5 0.5 0 .5 0 .6 0.6 0.6 0.6 0 .7 0.7 0.7 0.7 0 .8 0.8 0.8 0.8 0 .9 0.9 0 .9 1 Number of stroke P la te a u h o n in g p re s s u re ( B a r) 0 5 10 15 3 4 5 6 7 8 9 10 0.3 0.4 0.5 0.6 0.7 0.8 0.9 1 0.5 0.5 0.6 0.6 0.6 0 .6 0.6 0.6 0.6 0.7 0.7 0.7 0.7 0.7 0.7 0 .8 0.8 0 .8 0 .8 0.8 0.8 0 .9 1 0.9 0.9 Number of stroke P la te a u h o n in g p re s s u re ( B a r) 0 5 10 15 3 4 5 6 7 8 9 10 0.5 0.6 0.7 0.8 0.9 1
Figure 6 Variations of (a) the normalized root-mean square height of valleys component of cylinder bore
surface topography vq
vq i
S
S
and (b) the ratioS
pqS
vq function of the plateau honing pressure and the number of strokes (related to the honing duration). (a1,b1) obtained with initial finish honed surface roughnessSa
equal to 0.38 µm and (a2,b2) with initial finish honed surface roughnessSa
equal to 0.70 µm- zone (2) where the surface topography modifications concern both plateau and valleys components of cylinder bores. It shows that both plateau and valleys height decrease when the plateau honing time increases. Moreover, the surface texture tends to a steady state of plateau and valleys height. The same trend was found for the two initial surfaces roughness. In this honing duration range (number of stroke), the ratio between plateau and valleys roughness height increases. This suggests the generation of new finer grooves on the
0.5 0.5 0 .5 0.6 0 .6 0.6 0 .6 0.6 0.6 0 .6 0 .7 0 .7 0.7 0 .7 0.7 0.7 0 .7 0.7 0.7 0 .8 0.8 0.8 0 .8 0.8 0.9 0.9 Number of stroke P la te a u h o n in g p re s s u re ( B a r) 0 5 10 15 3 4 5 6 7 8 9 10 0.5 0.6 0.7 0.8 0.9 1 b1 a1 b2 a2 Zone (1) Zone (2) Zone (1) Zone (2)
cylinder surface texture (Figure 3). Moreover, this ratio tends to 1 showing the disappearance of the deep grooves.
3.2 Energetic analysis of Plateau honing process
In order to better understand the influence of contact pressure and honing time on the activation of the fundamental abrasion mechanisms (cutting, plowing, and sliding . . .), the energetic analysis of the plateau honing stage was performed. The consumed energy associated to the material removal is, by definition, the specific energy of honing. It characterizes the energy efficiency of the honing process. The overall value of this physical variable includes simultaneously the components induced by cutting action, plastic deformation "plowing" and frictional dissipation [33]. In energy terms, an abrasive machining process is efficient if material is removed quickly with low energy consumption.
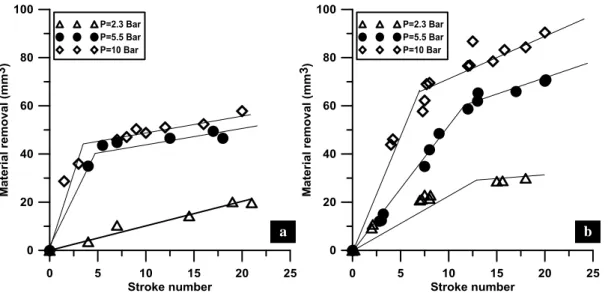
The Figure 7 and Figure 8 respectively illustrate the evolution of the material removal and specific energy of plateau honing stage with the number of stroke. They show that the increase of honing pressure provides higher material removal rate. However, the specific energy remains practically constant, especially at higher initial surface roughness. Then, during the plateau honing process, the cutting mechanism is the predominant activated mechanism.
Furthermore, they reveal a change of activated abrasion mechanisms versus the stroke number. The material removal rate is indeed reduced when the number of stroke increases (wear of abrasive grits). At the same time, the rate of specific energy remains constant. Thus, when number of stroke increases, the plateau honing process became less efficient due to the activation of plastic deformation "plowing" mechanism in detriment of the cutting one. Similar results are observed for the two different initial cylinder surfaces roughness.
We can conclude from these energetic analysis results that:
At the beginning of the plateau honing process, the material removal is due to the surface peaks removal. This corresponds to the running-in domain described above;
Then, a second regime takes place which is characterized by a lower material removal rate and considerable smoothing of the liner surface. Larger contact between the workpiece surface and the tool occurs leading simultaneously to plastic deformation of surface asperities and surface cutting.
Figure 7 Material removal vs stroke number of plateau honing process for two initial surfaces roughness (a)
Ra= 0.38 µm and (b) Ra = 0.70 µm.
Figure 8 Specific energy of plateau honing process vs stroke number for two initial surfaces roughness (a)
Ra= 0.38 µm and (b) Ra = 0.70 µm.
In conclusion, the smoothing of cylinder liner during plateau honing takes place into two stages as during running-in on a compression ignition engrunning-ine [5]. In the first stage, the peaks of the surfaces are flattened leading to a higher load carrying capacity. During this initial period, the same mechanism of material removal takes place both in plateau honing and in running-in engine test. In the second stage, the wear process during plateau honing consists on material removal and plastic deformation leading to the reduction of the valleys depth. However,
b
b a
during the secondary running-in period in engine test, the reduction of the valleys depth is mainly due to filling of the valleys by wear debris [5].
3.3 Modeling of the impact of plateau honing process variables on cylinder liner surface topography
To predict changes of surface topography during plateau honing, evolution laws were determined from the experimental data using multiple regression method. After removal of unsubstantial coefficient, the following regression equations of the two roughness parameters Spq and Svq were obtained:
0.49
p hont0.4
pq p hon pq iS
e
p
S
(7)0.70
v hon0.4
vq t v hon vq iS
e
p
S
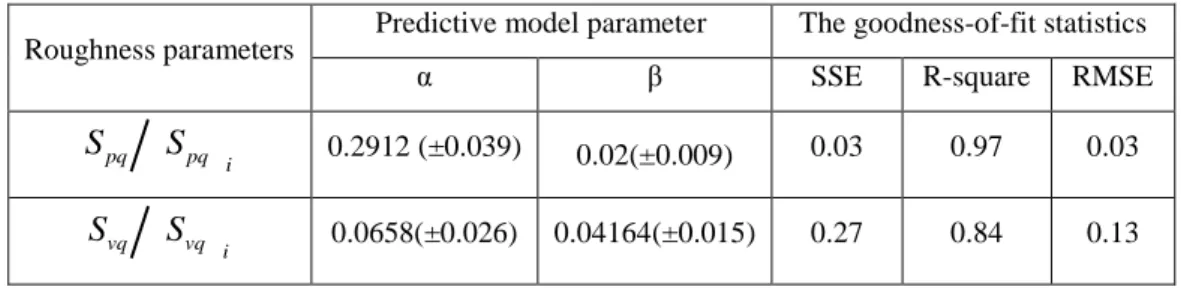
(8)The model expressed by equations 7 and 8 is very informative and quantifies experimental observations. The two model coefficients and determine the impact of the plateau honing time and pressure respectively on cylinder surface topography. The values of these coefficients are given in Table 2. The confidence ranges for regression coefficients were obtained with 95% confidence bounds. The following goodness-of-fit statistics of the developed parametric models were considered (Table 2):
The sum of squares due to error (SSE);
R-square : the square of the correlation between the response values and the predicted response values; Root mean squared error (RMSE).
They demonstrate the effectiveness of the proposed parametric model for roughness prediction after plateau honing process. The results show that the prediction of plateau and valley root-mean square height compares well with the experimental data.
Table 2. Model coefficients and statistics evaluation of model fitting with experimental data.
Roughness parameters Predictive model parameter The goodness-of-fit statistics
α β SSE R-square RMSE
pq pq i
S
S
0.2912 (±0.039) 0.02(±0.009) 0.03 0.97 0.03vq vq i
pq
S
andS
vqroughness parameters depend on both two plateau honing parameters and also on the initial surface roughness. They are proportional to plateau honing pressure and initial surface topography and inversely proportional to the plateau honing time (stroke number).From the coefficient of this model (Table 2), it can be observed that the exponential decrease of plateau roughness is almost five times faster than the decrease of the valleys component during plateau honing process. Moreover, to achieve running-in operation by plateau honing process, a low honing pressure need to be considered. In fact, the impact of honing pressure is twice important on valleys than on the superficial plateau roughness.
3.4 Friction prediction of plateau honed surfaces of cylinder liners
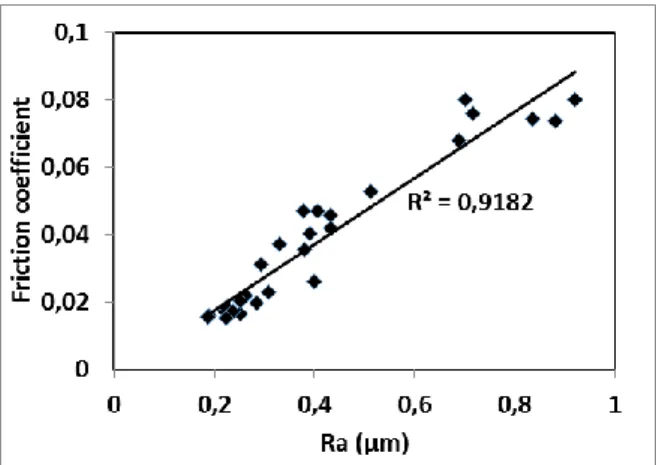
Figure 9 shows the predicted friction in the ring-liner–piston contact versus plateau honed cylinder liner roughness Ra. It shows clearly that friction is enhanced with surface smoothness.
Figure 9 Predicted friction coefficients versus arithmetic average roughness amplitude (Ra) of plateau honed
cylinder surfaces.
Figure 10 shows the maps of friction in ring-pack system of plateau honed surfaces of cylinder liner function of the plateau honing process variables (stroke number and honing pressure) for two initial surfaces roughness. We can observe that the friction in the ring-pack system decrease as the smoothing of the surface of cylinder liner during plateau honing. By comparing the Figure 10 to the Figure 6-a1,a2, we can remark that the tendency of the evolution of the friction coefficient function of the plateau honing variables is the same as the normalized root-mean square height of valleys component of cylinder bore surface topography vq
vq i
S
S
. Therefore, the friction performance evolves with the same manner as the reduction of the valleys depth.Besides, despite the increase of the amplitude of the plateau roughness compared to that of the valleys in the second phase of plateau honing i.e. the transition from plateaued surface to non-plateaued surface morphology, the friction still decreases. Therefore, it appears clearly that enhanced friction performance in elastohydrodynamic condition is due to the fact that the surface is smoother and not to the plateauing process. Nevertheless, the functional and industrial interest of this second phase running plateau needs further study. Indeed, first, at the functional level, engine tests are needed to investigate the impact of this phase on the oil consumption, galling, wear ... Secondly, at the industrial level, the increases of the machining cycle reduce the process efficiency.
Number of strokes P la te a u h o n in g p re s s u re ( B a r) 5 10 15 3 4 5 6 7 8 9 10 0.02 0.04 0.06 0.08 0.1 0.12 0.14 Number of strokes P la te a u h o n in g p re s s u re ( B a r) 5 10 15 3 4 5 6 7 8 9 10 0.02 0.04 0.06 0.08 0.1 0.12 0.14
Figure 10 friction prediction of plateau honed surfaces of cylinder liner vs stroke number and honing
pressure for two initial surfaces roughness (a) Ra= 0.38 µm and (b) Ra = 0.70 µm.
4. Conclusion
In this study, plateau honing experiments were conducted to understand the topographical changes of surface topography and wear during running-in process. A morphological decomposition method based on an alternate sequential filter was applied to characterize separately the superficial roughness and valleys depth component of cylinder bore surfaces. The root-mean squares of plateau and valleys height respectively were considered. The optimal plateau honing working conditions to reduce the running-in period can be determined using the ratio between plateau and valleys roughness as criteria. A plateau-honing parametric wear model was devised from results to predict surface finish modification during plateau honing process. The predictions are in good agreement with the measurement data of plateau and valleys surface-height parameters. Furthermore, a simulation model of piston ring-pack contact was developed to predict friction of cylinder surfaces after plateau honing. Results show that smooth surfaces lead to better friction performances despite the increases of the ratio between plateau and
Zone (1)
Zone (2)
Zone (1)
valleys height (non-plateaued surface). Finally, engine tests need to be achieved to compare the performance of cylinder surface texture of zone (1) and zone (2) in term of oil consumption, blow-by and seizure.
References
[1] Y.-R. Jeng, Z.-W. Lin, S.-H. Shyu, Changes of Surface Topography During Running-In Process, J. Tribol. 126(3) (2004) 620-625. [2] P. Andersson, J. Tamminen, C.-E. Sandström, Piston Ring Tribology ; Literature Survey, 2178 de VTT tiedotteita, Technical Research Centre of Finland, 2002.
[3] P. Pawlus, A study on the functional properties of honed cylinders surface during running-in, Wear 176 (2) (1994) 247-254.
[4] R. Reizer, P. Pawlus, L. Galda, W. Grabon, A. Dzierwa, Modeling of worn surface topography formed in a low wear process, Wear 278-279 (2012) 94-100.
[5] A. V. Sreenath, N. Raman, Mechanism of smoothing of cylinder liner surface during running-in, Tribology International (1976) 55-62. [6] J.-H. Horng, M.-L. Len, J.-S. Lee, The contact characteristics of rough surfaces in line contact during running-in process, Wear 253 (2002) 899-913.
[7] Y.-R. Jeng, C.-C. Gao, Changes of surface topography during wear for surfaces with different height distributions, Tribology Transactions 43(4) (2000) 749-757.
[8] P. Pawlus, T. Cieslak, T. Mathia, The study of cylinder liner plateau honing process, Journal of Materials Processing Technology 209 (2009) 6078-6086.
[9] R. Reizer, P. Pawlus, 3D surface topography of cylinder liner forecasting during plateau honing process, J. of Physics: Conference Series 311 (2011) 012021
[10] L. Rozeanu, O. Preotescu, A qualitative separation of wear factors’, Rev Roum. Sci. Tech. Ser. Mec. App., 2, No 1 (1957) 115-127.
[11] K.J. Stout and T.A. Spedding, The characterization of the combustion engine bore, Wear, 83 (1982) 311-327. [12] E. Willis, Surface finish in relation to cylinder liners, Wear, 109 (1986) 3.51-366.
[13] C. Anderberg, P. Pawlus, B. G. Rosen, T. Thomas, Alternative description of roughness for cylinder liner production, J. Mater. Process. Technol. 209 (4) (2009), 193601942.
[14] J.R. Clark, M.B. Grant, 1992, The effect of surface finish on component performance, Int. J. Mach. Tools Manuf. 32 (1/2), 57-66. [15] R. Kumar, S, Kumar, B. Prakash, A. Sethuramiah, Assessment of engine liner wear from bearing area curves., Wear 239-2 (2000) 282-286.
[16] I. Nogueira, A.M. Dias, R. Gras, R. Progri, An experimental model for mixed friction during running-in, Wear 253 (2002) 541-549. [17] G. Masouros, A. Dimarogonas, K. Lefas, A model for wear and surface roughness transients during the running-in of bearings, Wear 45 (1977) 375-382.
[18] V.V. Dunaevsky, Measurement of local microscopic wear, Journal of Tribology 108 (1986) 35-41.
[19] Y.-R. Jeng, Z.-W. Lin, S.-H. Shyu, A microscopic wear measurement method for general surfaces, Journal of Tribology 124 (2002) 829-833.
[20] P. Pawlus, Changes of cylinder surface topography in the initial stage of engine life, Wear 209 (1997) 69-83.
[21] T. G. King, W. Watson, K.J. Stout, Modeling the micro-geometry of lubricated wear, in Proc. of 4th Leeds/Lyon Symp. On Trib. In
Surface roughness effects in lubrication, D. Dowson, M. Godet and C. Taylor, Eds., Mechanical Engineering Publications, London, 1977. [22] J. Sugimura, Y. Kimura, K. Amino, 1986, Analysis of the topography changes due to wear – Geometry of the running-in process, JSLE, 31(11), pp. 813-820.
[23] M. El Mansori, S. Mezghani, L. Sabri, H. Zahouani, On the concept of process signature in the analysis of multi-stage surface formation. Surface Engineering (2010);26(3):216-223.
[24] L. Sabri, S. Mezghani, M. El Mansori, H. Zahouani, Multi-scale study of finish-honing process in mass production of cylinder liner. Wear (2011);271(3-4):509-513.
[25] J. Jocsak, V. Wong, T. Tian, The effects of cylinder liner finish on piston ring pack friction. In: Proceedings of the 2004 Fall technical conference of the ASME Internal Combustion Engine Division, vol. 84. 2004. p. 1–849.
[26] B. Najji, B. Bou-Said and D. Berthe, New Formulation for Lubrication with Non-Newtonian Fluids. Journal of Tribology 111(1989) 29-33.
[27] D. Dowson and G.R Higginson, Elastohydrodynamic Lubrication, The Fundamentals of Roller and Gear Lubrication, Pergamon, Oxford (1966).
[28] CJA. Roelands, Correlational aspects of the viscosity-temperature-pressure relationships of lubricant oil. Doctoral Thesis, Technische Hogeschol Delft, Nederlands (1966).
[29] I. Demirci, S. Mezghani, M. Yousfi, M. El Mansori, H. Zahouani, The Scale Effect of Roughness on Hydrodynamic Contact Friction, Tribology Transactions 55-5 (2012) 705-712.
[30] E. Rabinowicz, Friction-Especially Low Friction. Proceedings of the International Conference on the Fundamentals of Tribology, N.P. Suh and Saka, eds., The MIT Press, Cambridge, MA, 351-364 (1980).
[31] W. Wang, S. Wang, F. Shi, Y. Wang, H. Chen, H. Wang, Y. Hu, Simulation and measurements of sliding friction between rough surfaces in point contacts: From EHL to boundary lubrication. Journal of Tribology 129 (2007) 495-501.
[32] E. Decencière, D. Jeulin, Morphological decomposition of the surface topography of an internal combustion engine cylinder to characterize wear, Wear 249 (2001) 482–488.
[33] S. Mezghani, I. Demirci , M. El Mansori, H. Zahouani, Energy efficiency optimization of engine by frictional reduction of functional surfaces of cylinder ring-pack system. Tribology International 59 (2013) 240 – 247.