THÈSE
En vue de l’obtention du
DOCTORAT DE L’UNIVERSITÉ DE TOULOUSE
Délivré par I’Université Toulouse III Paul Sabatier (UT3 Paul Sabatier) Discipline ou Spécialité: Ecologie fonctionnelle
Présentée et soutenue par :
Eghbert Elvan AMPOU
Le 6 décembre 2016
Titre :
Caractérisation de la résilience des communautés benthiques
récifales par analyse d'images à très haute résolution multi-sources:
le cas du Parc National de Bunaken, Indonésie
JURY
Sylvain Ouillon DR, Institut de Recherche pour le Développement Directeur Serge Andréfouët CR, Institut de Recherche pour le Développement Co-Directeur
Laurent Barillé Pr, Université de Nantes Rapporteur
Christophe Proisy CR, Institut de Recherche pour le Développement Rapporteur
Gwenaelle Pennober Pr, Université de la Réunion Rapporteur
Corina Iovan CR, Institut de Recherche pour le Développement Examinateur
Philippe Gaspar HDR, Collecte Localisation Satellites Examinateur
Magali Gerino Pr, Université Paul-Sabatier Toulouse III Président du jury
Ecole doctorale:
Sciences De l’Univers, de l’Environnement et de l’Espace (SDU2E)
Unité de recherche :
Laboratoire d’Etudes en Géophysique et Océanographie Spatiales (LEGOS), Toulouse, France
Directeur(s) de Thèse :
Sylvain Ouillon, IRD, UMR LEGOS, Université Paul Sabatier Toulouse III Serge Andréfouët, IRD, UMR-ENTROPIE, Nouvelle Calédonie
ACKNOWLEDGEMENTS
This thesis would not have been possible completed without the assistance of a number of institutions and the guidance and help of several individuals, who contributed in various ways to the preparation and completion of this study.
First and foremost, I am indebted to the INfrastructure DEvelopment of Space Oceanography (INDESO) scheme, which funded my study and gave me the support I needed to produce and complete my thesis.
I would give many great full and appreciate to my supervisors, Dr. Serge Andréfouët. Thank you for inspiring discussion during research preparation, great and instructive field work and insightful comment during thesis writing; also Dr. Sylvain Ouillon and Dr. Corina Iovan for valuable suggestion and critical comment during the study.
I would like to acknowledge the Ministry of Marine Affairs and Fisheries, Institute for Marine Research and Observation for study leave permission and support during my study.
I would like also to give an appreciation to pak Berny Subki, mbak Yenung Secasari, Dr. Aulia Riza Farhan and team, Collecte Localisation Satellite (CLS) Dr. Philippe Gaspar and team, also IRD (Entropie & LEGOS laboratories), Ecole Doctorale SDU2E (Sciences de l’Univers, de l’Environnement et de l’Espace) University of Paul Sabatier (UPS) with all staffs who gave me a good academic atmosphere to learn many new things and for their support and assistance.
I’m grateful to my fieldwork mate Ofri Johan; I hope we could fieldwork together in the next coral reef project. I would also like to thank to Consulate General Indonesia in Noumea, New Caledonia with Assocation – Diaspora: Opung Djintar Tambunan & family, mbak Nana, mbak Erry & pak Pascal, mbak Wita with family also My Indonesian Fellows Teja, Yoga, Niken, Marza, Rinny, Wida, Budi, Romy, Iwan, Dendy, PPI-Toulouse and others whom I cannot mention one by one, Thank you being my family in Noumea, New Caledonia and Toulouse, France.
Last but not least, my deepest gratitude goes to my lovely wife Jouna Inke Debbie Ruauw and lovely kids: Imanuela Evelin Francesca Ampou & Ezekiel Jovan Albert Ampou who has always supported me in so many ways, endless support that gave to me during the completion of my study in UPS. To all of my family (Father/Father in law, Mother/Mother in law, Brother, Sister, etc.) that always praying for my success. I cannot find words to thank you all for your support and encouragement.
Table of Contents
List of Figures ... vi
List of Tables ... ix
ACRONYMS ... x
INTRODUCTION (in French) ... xi
CHAPTER 1. INTRODUCTION ... 1
1.1. The INDESO project ... 1
1.2. Coral reefs of Indonesia ... 2
1.3. Remote sensing of coral reef habitats and habitat mapping ... 2
1.4. Remote sensing of Indonesian coral reefs ... 7
1.5. Resilience of coral reefs and mapping resilience ... 8
1.6. Change detection of coral reefs using remote sensing ... 11
1.7. General research objective& research questions ... 13
1.8. Thesis structure ... 14
CHAPTER 2. SETTINGS, MATERIAL AND METHODS ... 16
2.1. Introduction ... 16
2.2. Study site: Bunaken National Park and Bunaken Island ... 16
2.3. Field work method for habitat typology ... 19
2.4. Training and accuracy assessment points ... 22
2.5. Photo-interpretation, digitization, thematic simplification, and final typology of mapped habitats ... 23
2.6. Accuracy assessment for habitat mapping ... 25
2.7. Multi-sensor image data sets for change detection analysis ... 26
CHAPTER 3. REVISITING BUNAKEN NATIONAL PARK (INDONESIA): A HABITAT STAND POINT USING VERY HIGH SPATIAL RESOLUTION REMOTELY SENSED . 28 3.1. Introduction ... 28
3.2. Material and Methods ... 29
3.2.1. VHR Image ... 29
3.2.2. Habitat typology ... 29
3.2.3. Habitat mapping for a very high thematic resolution of habitats ... 30
3.2.4. Accuracy assessment for a very high thematic resolution of habitats ... 31
3.4.1. Habitat typology ... 33
3.4.2. Habitat mapping ... 34
3.4.3. Accuracy assessment ... 35
3.5. Discussion and conclusion ... 37
CHAPTER 4. CORAL MORTALITY INDUCED BY THE 2015-2016 El-Niño IN INDONESIA: THE EFFECT OF RAPID SEA LEVEL FALL ... 39
4.1. Introduction ... 39
4.2. Material and Methods ... 40
4.3. Results ... 42
4.3.1. Mortality rates per dominant coral genus ... 42
4.3.2. Map of occurrences of mortality ... 44
4.3.3. Absolute Dynamic Topography time series ... 44
4.3.4. Sea Level Anomaly trends ... 46
4.4. Discussion ... 48
4.5. Conclusion ... 51
CHAPTER 5. ASSESSMENT OF THE RESILIENCE OF BUNAKEN ISLAND CORAL REEFS USING 15 YEARS OF VERY HIGH SPATIAL RESOLUTION SATELLITE IMAGES: A KALEIDOSCOPE OF HABITAT TRAJECTORIES ... 53
5.1. Introduction ... 53
5.2. Material and methods ... 56
5.2.1. Study site ... 56
5.2.2. Remote sensing data set ... 57
5.2.3. Mining georeferenced historical in situ data ... 59
5.2.4. Image and habitat-scenario analyses ... 59
5.2.5. Interpretation of changes ... 62
5.3. Results ... 63
5.3.1. Image time-series quality and correction ... 63
5.3.2. Historical data search ... 64
5.3.3. Changes for selected polygons ... 64
5.4. Discussion ... 68
5.4.1. Towards an ecological view of changes using VHR images ... 68
5.4.2. A kaleidoscope of habitat trajectories ... 69
5.4.3. A kaleidoscope of processes difficult to reconcile ... 74
5.4.4. The influence of management and recommendations ... 76
5.4.6. Bunaken, a resilient reef? ... 78
5.5. Conclusion ... 79
CHAPTER 6. DISCUSSION, PERSPECTIVES AND RECOMMENDATION ... 80
CONCLUSION (in French) ... 84
REFERENCES ... 87
APPENDIX I HABITAT LIST IN-SITU TYPOLOGY ... 100
APPENDIX II HABITAT ID CARD ... 108
APPENDIX III POLYGON COMPOSITION ... 138
APPENDIX IV AN EXAMPLE OF ACCURACY ASSESSMENT ... 146
EXTENDED ABSTRACT ... 149
RESUMÉ ÉTENDU ... 151
List of Figures
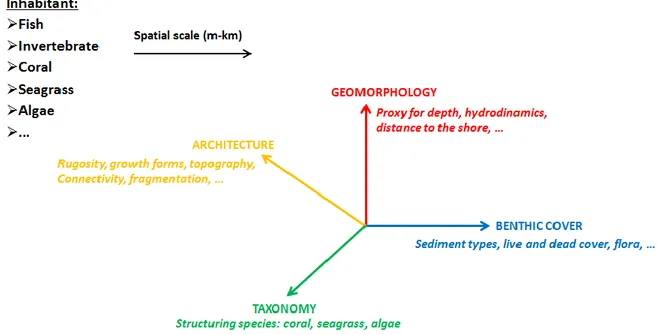
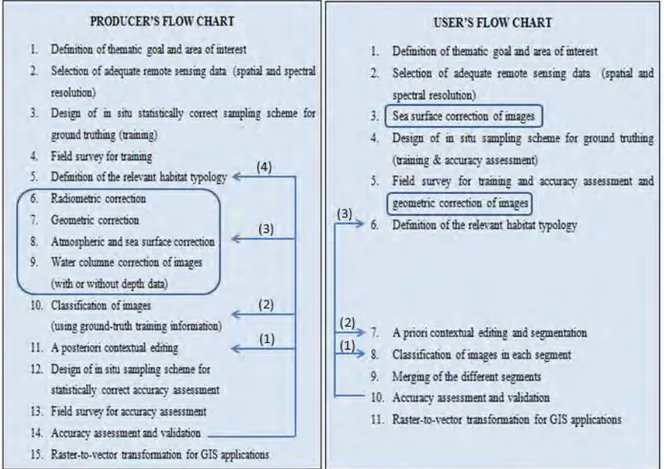
Figure 1: Definition of a habitat in a remote sensing context. A habitat is fully resolved when four variables are explicitly described: geomorphology, architecture, benthic cover and taxonomy (from Andréfouët 2014). ... 3 Figure 2: Examples of Indonesian reef habitats, described in Table 1. ... 4 Figure 3: Producers and users flow charts. Items in grey boxes show steps independent of the thematic scope. Arrows point to most frequent need of iterations to enhance accuracy and frequency of actions (1, 2, 3, 4). From Andréfouët(2008) ... 6 Figure 4: Location of Bunaken in Indonesia. Sulawesi is the island shaded in grey on the top panel. . 18 Figure 5: Flow chart for a field approach to characterize habitats in Bunaken island ... 20 Figure 6: Summarises ground-truthing achieved 2014, 2015 & 2016. In addition, forereefs were investigated by SCUBA almost for the entire periphery of the island. ... 23 Figure 7: Example of visualisation from the interactive ENVI 4.7 n-D Visualizer tool, to decide habitat class assignment for a polygon P with the red pixels, all other classes being known. The red pixels overlap the blue one, hence it will be assigned the same name (here, ”coral”). DN is the radiometric unit used here (DN: digital count) ... 24 Figure 8: nMDS plots for each geomorphological zone. The plot illustrates how well the habitats can be spread out based on a distance matrix between habitats (euclidian distance on percentage values). ... 34 Figure 9: Illustration of polygons created by photo-interpretation of the Geoeye-1 image. Only the boundaries are visible, to show the homogeneity in color and texture in each polygon. On the left side, the original segmentation. On the right side, the simplified one. ... 35 Figure 10: On top, visualization of the mapped polygons, and below, detail for an accuracy assessment transects on the east side of the island. Numbers in white are GPS records of position (with in situ pictures between them), and numbers in black are polygon numbers (See Appendix 3). ... 36 Figure 11: Bunaken reef flats. A: a living Heliopora coerula (blue coral) community in 2015 in a keep-up position relative to mean low sea level, with almost all the space occupied by corals. In that case, a 15-cm sea level fall will impact most of the reef flat. B: Healthy Porites lutea (yellow and pink massive corals) reef flat colonies in May 2014 observed at low spring tide. The upper part of colonies is above water, yet healthy. C: Same colonies in February 2016. The white line visualizes tissue mortality limit. Large Porites colonies (P1, P2) at low tide levels in 2014 are affected, while lower colonies (P3) are not. D: P1 colony in 2014. E: viewed from another angle, P1 colony in February 2016. E: Reef flat community with scattered Heliopora colonies in February 2016, with tissue mortality and algal turf overgrowth. ... 43 Figure 12: Top: Bunaken location. Sulawesi is the large island in grey. Middle: The yellow area shows where coral mortality occurred around Bunaken reef flats, with the position of six sampling stations. Dark areas between the yellow mask and the land are seagras beds. Blue-cyan areas are slopes and reef flats without mortality. Bottom: Mortality rates for the 6 sites for two dominant species Porites lutea and Heliopora coerulea. The latter is not found on Sites 3 and 4. ... 45 Figure 13: Time series of ADT, minus the mean over the 1993-2016 period, for Bunaken Island (top), North Sulawesi (middle), and Indonesia (bottom). The corresponding spatial domains are
(http://www.cpc.ncep.noaa.gov/products/analysis_monitoring/ensostuff/ensoyears.shtml) are depicted with light shadings. The September 2015 minimum corresponds to a 8 cm fall compared to the minima the four previous years, and a 14 cm fall compared to the 1993-2016 mean. The 1998 El Niño displays the largest sea level fall. ... 46 Figure 14: Top: Map of along-track SLA trend (in cm.year-1), 2013-2016, for the north Sulawesi area. The position of Bunaken Island is shown (BNK). Bottom: Map of along-track SLA trend (1-Hz), 2013-2016, for Indonesia. The domain on the top panel is the rectangle in the Indonesia map. ... 47 Figure 15: Top: Map of the 2005-2014 Absolute Dynamic Topography (ADT, in centimeters) average over Indonesia. Middle: Map of the September 2015 ADT mean value over Indonesia. The two squares indicate the domain just around Bunaken Island (arrow on top panel) and the Nino3-4 index (1993-2016, monthly average minus seasonal cycle). ... 49 Figure 16: Location map. Sulawesi is highlighted in grey on the top panel. The five islands of the Bunaken National Park are shown. The location of the 8 scenarios discussed in the paper are shown in the Bunaken Island insert... 56 Figure 17: Top panel: Image difference and identification of areas of high radiometric changes. The IKONOS 06/06/04 and Geoeye 28/03/14 images are shown for the southeast corner of Bunaken Island displaying wide reef flats. Images have been co-registered and the 2004 image is radiometrically corrected against the 2014 image for the lagoon features. Note the differences in land vegetation that are not considered for this correction. A color composite using the green band of each image shows changes from dark to bright in pinkish color. Greenish colors highlight changes from bright to dark. Note that these two trends can occur very close spatially. Neutral white to dark grey areas are no-change areas. Thresholding the difference image highlights areas of dramatic unambiguous changes from which scenarios are selected. The locations of Scenarios S1 and S4 are shown, respectively representing a shift from bright to dark and a shift from dark to bright for wide areas less than one kilometer apart. The bottom panel shows the histogram of image difference (also Band 2) for two images only 3 days apart in July 2001, and for the 2004-2014 couple. Since the reef can not have experienced significant changes on the ground in 3 days, the narrow histogram for the 2001 images provides the level of noise on the empirical calibration of two images and thus the level of uncertainty in detecting changes using image differences. In contrast, the wider 2004-2014 histogram reveals more profound asymmetrical changes. ... 61 Figure 18: Image time series for 4 of the 8 scenarios (see Table 12) illustrating progressive or rapid changes. Exact dates are provided Table 2. The white scale-bar on the upper part of the 2015 panels represent 100 meters. The letters S1, S2, S4 and S8 are positioned on the area of interest. The outlines overlaid on the 2014 images are the boundaries of homogeneous habitat as defined by ground-truthing in 2014 and 2015. These polygons represent the limit that is considered to compute surface areas in Figure 20. ... 62 Figure 19: In situ pictures of the habitats present in 2014 or 2015 for each of the scenario, thus illustrating the terminal state of the 2001-2015 trajectories. Scenario 3 picture is taken at the edge of the growing Montipora thicket, that has started to surround Porites colonies. For scenario 5, the picture shows one of the last pocket of coral with Montipora growth, small massive colonies, and encrusting corals as it could have been at the beginning of the time-series in 2001, albeit with higher coral cover. The last picture illustrates the abundance of Diadema urchins as they regroup during day time (see Discussion). ... 65 Figure 20: Changes of surface area (in square meter) of the focal habitat for each of the 8 selected scenarios (see Table 12). Points represent data from image interpretation. They are joined by straight lines except for the 2004-2009 gap for which the trajectory in uncertain. The
continuous curves are exponential or polynomial fitted curves representing what could be a continuous trajectory based on existing data. See text for details and type of curves in Table 12. ... 67 Figure 21: Identification of the initial state of Scenario 4 by comparison with the signatures of known habitats surveyed in 2014. The red pixels, corresponding to the initial state of Scenario 4 for which no ground-truthing was available in 2004, merge into the habitats identified in 2014 as Montipora-dominated thickets. They avoid dark seagrass beds signatures, and few points merge with the coral and pavement habitat. Maximum values for each spectral band (in digital counts, DN) are indicated on each axis. ... 72 Figure 22: Suggested sequences of process and initial conditions to best reconcile the different scenarios, in chronological order from top-to-bottom and along an idealized transect crossing the different scenarios. The sand-seagrass scenario 7 is not shown here. RSLF: Rapid Sea Level Fall during the 1998 El Niño. SLR: Sea Level Rise after 1998. COTS: Crow of Thorn Starfish. S1-S8 refer to the scenario number. “?” summarizes the interrogation on why this area is not recolonized after the disturbance? See text for explanations on the sequence. .... 75
List of Tables
Table 1: Detail of definition of reef habitats illustrated in Figure 2 ... 4 Table 2: List of representative coral reef remote sensing applications in Indonesia ... 9 Table 3: Examples of variables relevant to measure resilience and mapped or modelled using remote sensing. ... 10 Table 4: Examples of coral reef change detection study and their characteristics. PIF:
pseudo-invariant features. LIT: Line intersect transect (English et al., 1994). MSA: Medium Scale Approach (Clua et al., 2006). ... 12 Table 5: Examples of Bunaken National park research activities in the past 20 years ... 18 Table 6: List of attributes for habitat description in Bunaken island. The percent cover of each variable is estimated using the MSA method. ... 21 Table 7: Example of confusion matrix (or error matrix) with only 4 categories ... 25 Table 8: Main characteristics of the type of images used in this study. ... 26 Table 9: Characteristics of images used for this study. Glint refers to sun reflection at the sea surface. Except for image 27/11/2009, environmental conditions were good (see Comments) to very good (no Comments). ... 27 Table 10: Mortality rates (mean ± standard deviation, n=6) of all corals for the 6 reef flat sites. The three dominant species were Porites lutea, Heliopora coerulea, and Goniastrea
minuta. Several species and genus were found only once. Standard deviation is is not
shown when only one measurement per type of coral could be achieved (i.e., one colony per site). ... 42 Table 11: Selected publications on change detection of reef habitats across nearly two decades or more using high (Landsat: 30 meters), and very high (others: 1 to 4 meters) spatial resolution satellite sensors and aerial photographs. ... 57 Table 12: Description of the identified scenario. “Growth” implies here horizontal expansion. P2-4 means polynomial model order 2-4. Exp.: exponential. Location of the scenarios is shown Figure 16. ... 66
ACRONYMS
AFD Agence Française de Développement
ADT Absolute Dynamic Topography
AVISO Archiving Validation and Interpretation of Satellite Oceanographic
Data Center
BI Bunaken Island
BNP Bunaken National Park
CLS Collecte Localisation Satellite
CTI-CFF Coral Triangle Initiative on Coral reefs Fisheries and Food security
ENSO El-Niño Southern Oscillation
GPS Global Positioning System
ICZM Integrated Coastal Zone Management
INDESO Indonesian Development of Space Oceanography
IRD Institut de Recherche pour le Développement
IUU Illegal Unreported and Unregulated
LEGOS Laboratoire d’Etudes en Géophysique et Océanographie Spatiales
LIT Line Intersect Transect
MCA Marine Conservation Area
MMAF Ministry of Marine Affairs and Fisheries
MSA Medium Scale Approach
ROI Region Of Interest
SCUBA Self Contained Underwater Breathing Apparatus
SLA Sea Level Anomalies
TS Transect Station
INTRODUCTION (in French)
L'Indonésie est un ensemble d'archipels regroupant environ 17.500 îles. C’est le pays au monde qui comprend la présence la plus importante de récifs coralliens, actuellement estimée à 50.200 km2 de zones récifales. Les récifs indonésiens sont réputés pour leur diversité
biologique et leur complexité écologique, et sont situés à l'épicentre du centre mondial de la biodiversité marine tropicale, le dit Triangle de Corail (Coral Triangle). Dans ce vaste domaine récifal, la diversité des coraux dépasse 500 espèces qui correspondent à plus de 70% du total des espèces de la zone Indo-Pacifique (Veron, 2000). Cette zone prend également en charge la plus grande diversité de poissons récifaux (Allen et Steene, 1994), et est clairement d'importance mondiale comme l'un des principaux réservoirs de biodiversité marine tropicale (Turak et Devantier, 2003). Malheureusement, une cartographie complète de la géomorphologie ou des habitats des récifs coralliens en Indonésie reste indisponible. Un travail est nécessaire à toutes les échelles en termes de compréhension de l'écologie des récifs coralliens indonésiens.
Le projet INDESO (Développement de l'Océanographie Spatiale en Indonésie) en collaboration entre le gouvernement indonésien (Ministère des affaires maritimes et des pêches - MMAF) et la société française CLS (Collecte Localisation Satellite) promeut l'utilisation des technologies spatiales pour la surveillance des côtes et des mers indonésiennes. Le projet concerne (1) le développement durable des zones côtières, et (2) la pêche et l'aquaculture. Le premier volet comprend le suivi des récifs coralliens, la gestion intégrée de la zone côtière, les mangroves et la surveillance des rejets d'hydrocarbures. Le second comprend la lutte contre la pêche illégale, le suivi des stocks de poissons, l’élevage de crevettes et d'algues agricoles. Dans le domaine corallien, le projet INDESO vise à contribuer certaines des lacunes, en particulier en ciblant des parcs nationaux qui manquent encore de cartes d’habitats dérivés de la télédétection, et d'information sur la dynamique et la résilience des récifs coralliens. Cette thèse fait partie de ce volet sur la surveillance des récifs coralliens, mené par l'IRD (Institut de Recherche pour le Développement).
Un habitat peut être défini comme une entité spatiale et fonctionnelle, caractérisé par différents paramètres biologiques et abiotiques, à une échelle spatiale spécifique qui dépend du contexte (Galparsoro et al., 2012). Lorsqu’ils sont cartographiés par télédétection, les habitats sont décrits par quatre types de variables qui se réfèrent respectivement à la géomorphologie, l'architecture, la couverture benthique et la taxonomie des espèces
structurellement dominantes sur des zones qui peuvent couvrir entre plusieurs mètres carrés et quelques milliers de mètres carrés (Andréfouët, 2014, 2016). Les habitants d’intérêt majeur sont généralement des vertébrés et des invertébrés et la flore, parce qu'ils constituent des ressources écologiques ou des entités fonctionnelles qui doivent être cartographiés pour étudier un processus important ou un élément architectural de l'habitat lui-même (les coraux, les algues, le plancton végétal...). Un habitat récifal est donc explicitement considéré ici comme une structure benthique biophysique tridimensionnelle couvrant au moins quelques dizaines de mètres carrés.
Le panel de méthodes de cartographie de l'habitat à l'aide de la télédétection est vaste (cf. revue dans Andréfouët, 2016). Le type de méthodes dépend de l'approche choisie pour le traitement de l'image (classification, segmentation, basée sur la physique, l’intelligence artificielle, ou un mélange de ces approches), le type de capteur (résolution spatiale et spectrale), la faisabilité de la vérification sur le terrain, et surtout les objectifs de l'application. Des exemples de ces approches appliquées aux récifs coralliens peuvent être trouvés dans Purkis (2005, basé sur la physique), Andréfouët et al. (2003, basé sur la classification), Roelfsema et al. (2013, sur la base de segmentation), et Benfield et al. (2007, classification fondée sur des règles, liées à l'intelligence artificielle), par exemple.
Le choix méthodologique dans cette étude a été dicté par les contraintes spécifiques au projet INDESO et au contexte indonésien. Tout d'abord, la priorité d’INDESO est de développer des projets pilotes utilisant des images multispectrales (4-8 bandes) à très haute résolution spatiale (2-4 mètres). Deuxièmement, les récifs indonésiens étant à l'épicentre de la diversité des récifs coralliens, il est souhaitable d'essayer d'inventorier et de cartographier le plus grand nombre d'habitats, un exercice toujours pas atteint dans le pays. Troisièmement, une activité intense de vérité terrain a été prévue sur les sites pilotes d’INDESO. Quatrièmement, INDESO assure un renforcement des capacités qui doit permettre, dans un avenir à moyen terme, de cartographier le plus grand nombre possible de récifs. La priorité absolue est donc la production de cartes thématiques pertinentes, et non de développer de nouvelles méthodes. Les approches qui nécessitent des compétences techniques limitées, en particulier dans le transfert radiatif physique, doivent être favorisées si elles permettent la production de cartes thématiquement riches des habitats des récifs coralliens.
Dans un article de synthèse, Andréfouët (2008) a fait des recommandations pour répondre exactement à cette demande, la priorité à la production de cartes thématiques riches en utilisant des images de très haute résolution dans un contexte de renforcement des capacités.
La méthodologie qu'il recommande est une « méthodologie de l'utilisateur », dans le sens où l'objectif est de produire des cartes intéressantes pour les utilisateurs et ne pas se concentrer sur les aspects méthodologiques qui peuvent présenter d’abord un intérêt pour les « producteurs ». Les utilisateurs peuvent être des gestionnaires ou des scientifiques qui ont besoin de l'information spatiale sur les habitats, sans pour autant la produire eux-mêmes. Plusieurs étapes sont nécessaires à l’établissement de cartes par l’utilisateur, dont la description de la typologie de l'habitat, la photo-interprétation des images et l'évaluation de la précision (Andréfouët, 2008). Ensuite, d'autres étapes nécessaires sont liées à l'amélioration de l'image pour la photo-interprétation, la stratégie d'échantillonnage pour les travaux sur le terrain, et enfin le transfert des informations au format des systèmes d'information géographique (SIG). L’évaluation de l'exactitude est une tâche nécessaire dans la cartographie des habitats. Tous ces aspects méthodologiques sont détaillés dans le manuscrit.
Les cartes produites à partir de séries temporelles d’images permettent de répondre à de multiples questions scientifiques, et en particulier de s’intéresser à la résilience des récifs coralliens. La résilience est la capacité d'un système à absorber ou à récupérer de la perturbation et du changement, tout en conservant ses fonctions et services (Carpenter et al., 2001) : par exemple, la capacité d’un récif à récupérer d'un cyclone (Grimsditch et Salm, 2006). Il est souvent opposé à la résistance qui est la capacité d'un écosystème à résister à des perturbations sans subir un décalage de phase ou sans perdre ni sa structure, ni sa fonction (Odum, 1989) : par exemple, la capacité d’un récif à résister au blanchissement et à la mort (Grimsditch et Salm, 2006).
Les questions scientifiques abordées dans ce mémoire peuvent être regroupées en 3 séries de questions et de paliers importants :
1. Quels sont les habitats actuels des récifs coralliens dans le parc national de Bunaken et autour de l’île de Bunaken au nord de Sulawesi ? Comment sont-ils distribués? Quelle est la diversité de l'habitat?
2. Peut-on détecter des changements d’habitats sur une série temporelle d’images multi-capteurs à très haute résolution ? Peut-on reconstruire l'histoire récente de changements autour de l'île Bunaken ? Les habitats sont-ils résilients ?
3. S'il y a des changements d’habitats sur les récifs, quelles peuvent en être les causes ? S'il n'y a pas de changement, quels facteurs de résilience pourraient être impliqués ?
L'objectif principal du travail est donc de déterminer si les habitats des récifs coralliens dans l'île de Bunaken sont résilients, en utilisant i) des cartes d'habitat nouvellement conçues, ii) des données in situ et une série chronologique de 15 ans unique d'images satellites de différents capteurs à très haute résolution (VHR), iii) des données auxiliaires qui pourraient expliquer les changements détectés. En effet, la compréhension de la résilience des habitats du récif corallien est considérée comme une priorité, en particulier pour percevoir les effets des mesures de gestion et de stress.
La thèse comprend 3 grands chapitres, chacun correspondant à une publication distincte. Ces 3 articles sont précédés d’une introduction (Chap. 1), puis d’une présentation détaillée du site et des outils et méthodes employés dans ce travail (Chap. 2). Le Chapitre 3 présente la cartographie détaillée des 175 habitats des récifs coralliens autour de l’île de Bunaken à l’aide d’une image très haute résolution et de données de vérité-terrain recueillies en 2014-2015. Le Chapitre 4 concerne la mortalité du corail observée en Mars 2016 sur plusieurs des habitats identifiés, concomitamment avec la baisse du niveau de la mer drastique en raison du très fort événement El Niño en cours. Enfin, les séries chronologiques de l'imagerie satellitaire à très haute résolution ont été utilisées pour caractériser la dynamique à long terme des habitats des récifs de Bunaken, en particulier sur les platiers peu profonds, entre 2001 et 2015 (Chapitre 5). Une conclusion générale assortie de perspectives et de recommandations constitue le Chapitre 6. Le manuscrit se termine par 4 annexes.
CHAPTER 1. INTRODUCTION
1.1. The INDESO project
Indonesia is an ensemble of archipelagos representing about 17.500 islands spread on a longitudinal gradient spanning more than 4 000 km. Fisheries are a key activity in rural areas and generate considerable local economic transfers (Nontji, 1987). Indonesia living marine resources are highly vulnerable to unregulated illegal fishing, climate change and increasing anthropogenic influences leading to the degradation of marine ecosystems. The management of marine resources and fisheries is therefore highly complex and difficult, and constitutes a major issue for the country.
Since 1999 the Ministry of Marine Affairs and Fisheries (MMAF) established in Indonesia various programs aimed at enhancing the use of remote sensing technology to strenghten the monitoring capacities of the country(Farhan and Lim,2010). In this context, the Infrastructure Development for Space Oceanography project (INDESO) is a scientific program that aims at supplying to the Indonesian MMAF a set of technologies, specific know-how, actions of strengthening of capacities, specific buildings with equipments and facilities. It is funded by an Agence Française de Développement (AFD) sovereign loan of 30 million US$, and the main French partner is Collecte Localisation Satellite (CLS). The long-term objective of INDESO is 1) the conservation of both the capacities of fisheries and of Indonesian ecosystems, 2) the implementation of pilot projects for applied and operational researches and 3) the funding of training actions in the field of space oceanography. The Institute de Recherche pour le Developpement (IRD) is a scientific partner of CLS in INDESO.
INDESO is a mix of operational applications and pilot-research application based on remote sensing and numerical modelling. The program divided into two categories consisting of 7 applications: Sustainable Coastal Development = Coral reef monitoring; Oil spill monitoring; Integrated Coastal Zone Management (ICZM) and Mangrove; Fisheries and Aquaculture especially the detection of Illegal, Unreported and Unregulated (IUU) fishing; Monitoring fish stocks; Shrimp farming; and Seaweed farming. Each of this application has to demonstrate the value of using remote sensing for monitoring and management of Indonesian coastal resources.
This PhD project is a contribution to the Coral Reef Application of the INDESO project. The Coral Reef Application is taking advantage of very high spatial resolution images.
1.2. Coral reefs of Indonesia
Indonesia is the country with the highest presence of coral reefs worldwide, currently estimated at 50.200 km2 of reefal area although this number needs revision. Indonesia has
numerous reef types, including barrier reefs, fringing reefs, and atolls for the main ones (Tomascik et al., 1997). Indonesia coral reefs are renowned for their biological diversity and ecological complexity, and are located at the epicentre of the global centre of tropical marine biodiversity, the so called Coral Triangle, which includes Indonesia, Malaysia, Philippines, Timor Leste, Papua New Guinea and Salomon Islands. Within this broad area, reef-building coral diversity exceeds 500 species which correspond to more than 70% of the total Indo-Pacific species (Veron,2000). This area also supports the highest diversity of reef-associated fishes (Allen and Steene, 1994), and is clearly of global significance as one of the main reservoir of tropical marine biodiversity (Turak and DeVantier, 2003).
Unfortunately, a comprehensive mapping of the geomorphology, or habitats of coral reefs in Indonesia remain unavailable. Much is needed in terms of understanding the ecology of Indonesian coral reefs, at all scales. As such, the INDESO project aims to contribute some of the gaps, in particular on several targeted National Parks that still lack remote sensing derived habitat maps and information on the dynamics and resilience of coral reefs.
1.3. Remote sensing of coral reef habitats and habitat mapping
Generally, a habitat can be defined as a spatial and functional entity characterized by various biological and abiotic parameters, at a specific spatial scale that will depend on the context (Galparsoro et al., 2012). For habitat mapping using remote sensing, habitats are described by four types of variables that refer respectively to geomorphology, architecture, benthic cover and taxonomy of the dominant structurally species for areas that may cover between several square meters to few thousands of square meters (Fig. 1) (Andréfouët, 2014, 2016). The inhabitants of interests are typically vertebrates and invertebrates fauna, and flora, because they are either ecological resources or functional entities that need to be mapped to study an important process, or architectural component of the habitat himself (coral, algae, seagrass...).
Figure 1: Definition of a habitat in a remote sensing context. A habitat is fully resolved when four variables are explicitly described: geomorphology, architecture, benthic cover and taxonomy (from
Andréfouët 2014).
A reef habitat is thus explicitly considered here as a three dimensional benthic biophysical structure covering at least a few tens of square meters.
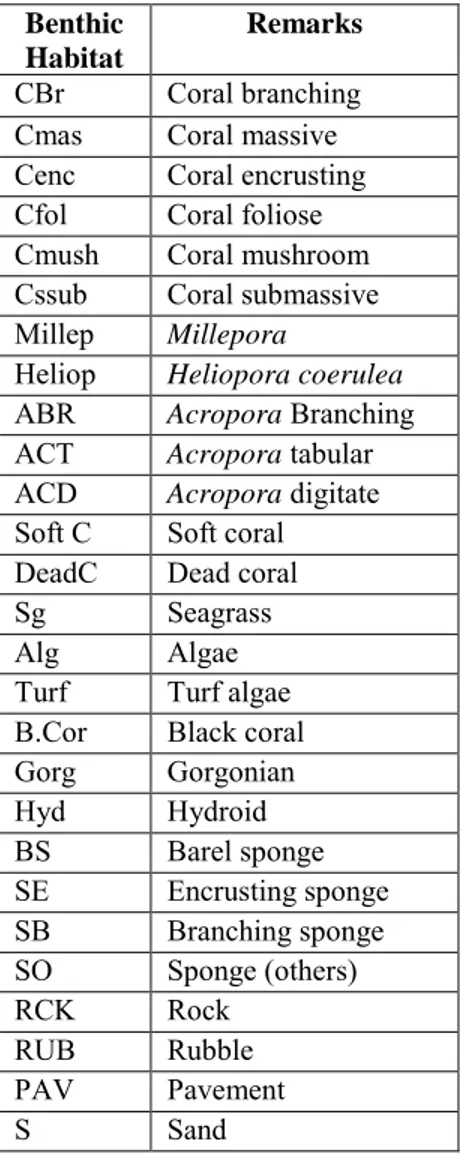
The geomorphology axis (Fig. 1) is the coarser component. It is a proxy of the depth, physical environment and formation of the location. Often, to map geomorphology, field work and ground-truthing are not necessary. Geomorphology can be mapped directly from the image without field data (Andréfouët et al., 2006). In contrast, the other component of the habitat (cover, architecture and taxonomy) need field investigation to be characterized qualitatively or quantitatively using appropriate field methods that will be presented in Chapter 2. Benthic cover describes how the area is covered by either biotic or abiotic entities. Architecture refers to different information that can be integrative (like the rugosity –or variation of height - of the habitat) or component specific (like the growth form of corals – tabular, massive, branching, etc., or the height of the canopy of an algal bed). Architecture can also refer, at another level, on the spatial topology of the components of the habitat, like patchiness or degree of fragmentation for instance. Examples of representative reef habitats are provided hereafter (Fig. 2) and details of their description are provided in Table 1.
Figure 2: Examples of Indonesian reef habitats, described in Table 1.
Table 1: Detail of definition of reef habitats illustrated in Figure 2
Geomorphology Benthic cover Architecture Taxonomy
A Terrace
90% seagrass
and 10% sand Rugosity height 40cm maximum2: canopy Enhalus, Thalassia
B Reef flat
80% hard
coral, 20% rubble
Rugosity 3: colony height variation below 40cm, flat area. Massive colonies.
Porites, Pocillopora,
Stylophora, and Heliopora
C Fore reef 100% coral hard
Rugosity 3: slopping area with colony height variation below 40cm. Semi-massive colonies Galaxea D Wall 30% sponge, 50% hard coral, 20% old eroded coral substrate
Rugosity 4: steep slope with height variation of components near 100cm. Barrel sponges. Mixed coral growth forms
Sponge: Xestospongia Hard Coral: Acropora, Pectinia, Porites, Isopora, Mycedium
The panel of methods for habitat mapping using remote sensing is vast (reviewed in Andréfouët, 2016). Only optical images (blue to red wavelength) have been used to study underwater features. Radar images, or near-infra red bands, which are useful to study
vegetation, cannot be used for underwater targets, although they can be used to create a land mask.
The type of methods depends on the selected approach for image processing (classification, segmentation, physics-based, artificial intelligence, or a mix of these approaches), the type of sensor (spatial and spectral resolution), the feasibility of ground-truthing, and, most importantly the objectives of the mapping. Examples of these approaches applied to coral reefs can be found inPurkis (2005, physics-based), Andréfouët et al. (2003, classification-based) and Roelfsema et al. (2013, segmentation classification-based), and Benfield et al. (2007, rule-based classification, related to artificial intelligence) for instance. Here, we can narrow the scope considering several constraints which are specific to the INDESO and Indonesia context briefly explained in the previous sections.
First, the priority of INDESO is to develop pilot projects using very high spatial resolution (2-4 meter), multispectral ((2-4-8 bands), images. Second, Indonesian reefs being in the epicentre of the coral reef diversity, it is desirable to try to inventory and map the highest number of habitats, an exercise still not achieved in for this country. Third, it is expected that intensive ground-truthing is possible for the pilot INDESO sites. Fourth, INDESO is about capacity building so that as many reefs as possible can be mapped in the future. The ultimate priority is thus production of thematically relevant maps, not method development. Approaches that require limited technical skills, especially in radiative transfer physics, should be favoured, if they allow the production of thematically rich coral reef habitat maps.
In a review paper, Andréfouët (2008) has made recommendations for exactly the context presented above: priority to production of thematically rich maps using very high spatial resolution images in a capacity building context. The methodology he recommends is a “user’ methodology, in the sense that the goal is to produce maps interesting for users and not focus on methodological aspects that can be of interest for map “producers”, but not users. Users can be managers, or scientists that need spatial information on habitats, but cannot produce it themselves.
A methodological flow chart was provided in Andréfouët (2008) (Fig. 3). The user and producer flow chart are compared. The user flow chart is simpler but still has several mandatory steps. The three main ones thematically speaking are the description of habitat
assessment(step 10 (Andréfouët, 2008). Then, other steps are required and are related to
image enhancement for photo-interpretation, sampling strategy for field work, and finally transfer into Geographical Information Systems (GIS) format.
Figure 3: Producers and users flow charts. Items in grey boxes show steps independent of the thematic scope. Arrows point to most frequent need of iterations to enhance accuracy and frequency of actions
(1, 2, 3, 4). From Andréfouët (2008)
Accuracy assessment is a necessary task in habitat mapping. The goal is to provide a quantification of the accuracy of the map, which is key information for all users. Many metrics exist (Foody, 2002) that require a set of observations independent from the set of observations used to take the map. (Congalton and Green, 1999) make recommendations in term of sampling effort, with 50 independent points per class for a robust assessment. However, in a coral reef context, this may not be easily feasible, and these guidelines need to be considered as guidelines only, not mandatory. Collecting 50 points per class may be impractical because some classes may be rare with limited coverage, or simply not enough time is allowed in the type of short expedition survey typically done for coral reefs. For a 50-classes map, collecting 500 points may be a costly dedicated full-week task in the field. More importantly it is also very easy to bias accuracy assessment, either positively or negatively
depending on where the control points are selected (Andréfouët, 2008). Overall, it is acknowledged that a good accuracy is above 80% overall accuracy, meaning that 80% of all pixels are correctly classified. It also means that 20% of the pixels are mislabelled, which may still be inacceptable for some applications. Therefore, some applications may require values above 90%, if the map is used for precise management of resource stocks for instance. Most of the time, the level of accuracy is highly variable between classes, and overall accuracy is just an indicator that needs to be refined by other metrics provided per classes.
Generally, automatic methods (classification, segmentation) alone cannot reach this level of accuracy for more than 5 or 6 classes in a coral reef environment (Capolsini et al., 2003, Andréfouët et al., 2003). This is due to the inherent radiometric similarity between coral reef benthic classes, such as coral and algae (Hochberg et al., 2003). Higher complexity maps need to be manually edited, by contextual editing (Groom et al.,1996). This means that generic contextual rules (e.g., ‘seagrass are not on the forereef’) can be used a posteriori to detect misclassification and correct them. In practice, implementing automatically these rules is complex (with methods related to the field of artificial intelligence and automatic learning). Some software (e.g., Definiens) can be helpful (Benfield et al. 2007) or it is done manually by photo-interpretation (Andréfouët, 2008). Although this is site-complexity dependent, the trend is that aiming for a high accuracy for a high number of classes require lots of editing. As a result, direct photo-interpretation and manual digitization, which is in practicea priori contextual editing, is preferred as the main method to produce a map. Photo-interpretation has allowed good level of overall accuracy (>75%) for maps reaching more than 50 classes.
1.4. Remote sensing of Indonesian coral reefs
Indonesia has vast areas of coral reefs, and published remote sensing studies describe imageprocessing in several localities. Covering the entire country, national initiative included a COREMAP product derived for Landsat 7 images (2004). The Millennium Mapping Project has released some detailed geomorphological products (Andréfouët et al., 2006), also derived from Landsat 7, after the 2004 Tsunami. Comparison with COREMAP products showed many missing reefs and errors in the COREMAP product (Brian Long and Serge Andréfouët, unpublished data). The fully validated Millennium product is not yet distributed and a simplified, unvalidated version of the Indonesian products have been used by UNEP-WCMC to release a global “coral reef’ product in one single layer without thematical detail. This
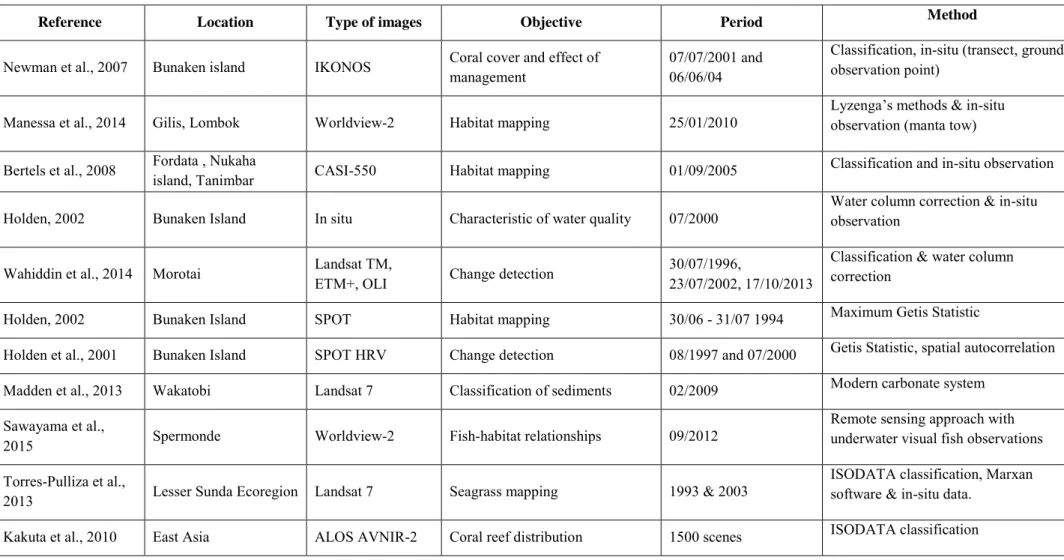
product also suffers from many errors (Cros et al., 2014). The Table 2 provides recent high spatial resolution studies on Indonesian coral reefs published in the peer-reviewed literature. Other studies can be found in conference proceedings and student thesis. These studies represent a variety of coral reef theme, including change detection (Table 2). These studies looked at SPOT and Landsat imagery, thus analysed changes using 20-30 meter resolution. We did not find example of change detection study using very high spatial resolution images (2-4 m).
1.5. Resilience of coral reefs and mapping resilience
Resilience is the ability of a system to absorb or recover from disturbance and change, while maintaining its functions and services (Carpenter et al., 2001): for example a coral reef ’s ability to recover from a hurricane(Grimsditch and Salm, 2006). It is often opposed to resistance, which is the ability of an ecosystem to withstand disturbance without undergoing a phase shift or losing neither structure nor function (Odum, 1989): for example a coral reef ’s ability to withstand bleaching and mortality (Grimsditch and Salm, 2006).
Resilience and the resilience concept have been a significant focus in the past 20 years, triggered by the on-going, obvious, degradation of corals reefs that seemed to be unable to bounce back to their initial state, or even shift to a seemingly different system, for instance dominated by algae. Understanding resilience and managing the resilience capacities of a reef have appeared as new priorities for science and management. The difficulty is that managing resilience implies a holistic, ecosystem, view of how a reef is functioning and the consequences of all interactions between all its diversity of components.
Resilience of coral reefs has been studied as a theoretical concept (Nyström and Folke, 2001), empirically in the field (e.g., Wakeford et al., 2008), and with models (Mumby et al., 2006). Resilience has three critical components (1) biodiversity, (2) connectivity and (3) spatial heterogeneity (Nyström et al., 2008). Biodiversity allows redundancy of important ecosystem functions. Connectivity between reefs allows population flux and population renewal after disturbances. Spatial heterogeneity implies that the resilience factors are variable in space across a reef or series of reef. It is recognized that habitat diversity, connectivity and spatial heterogeneity are important resilience modulators, yet these variables remain poorly quantified for most reefs worlwide.
Table 2: List of representative coral reef remote sensing applications in Indonesia
Reference Location Type of images Objective Period Method
Newman et al., 2007 Bunaken island IKONOS Coral cover and effect of management 07/07/2001 and 06/06/04 Classification, in-situ (transect, ground observation point) Manessa et al., 2014 Gilis, Lombok Worldview-2 Habitat mapping 25/01/2010 Lyzenga’s methods & in-situ observation (manta tow)
Bertels et al., 2008 Fordata , Nukaha island, Tanimbar CASI-550 Habitat mapping 01/09/2005 Classification and in-situ observation Holden, 2002 Bunaken Island In situ Characteristic of water quality 07/2000 Water column correction & in-situ observation Wahiddin et al., 2014 Morotai Landsat TM, ETM+, OLI Change detection 30/07/1996, 23/07/2002, 17/10/2013 Classification & water column correction Holden, 2002 Bunaken Island SPOT Habitat mapping 30/06 - 31/07 1994 Maximum Getis Statistic
Holden et al., 2001 Bunaken Island SPOT HRV Change detection 08/1997 and 07/2000 Getis Statistic, spatial autocorrelation Madden et al., 2013 Wakatobi Landsat 7 Classification of sediments 02/2009 Modern carbonate system
Sawayama et al.,
2015 Spermonde Worldview-2 Fish-habitat relationships 09/2012
Remote sensing approach with underwater visual fish observations Torres-Pulliza et al.,
2013 Lesser Sunda Ecoregion Landsat 7 Seagrass mapping 1993 & 2003
ISODATA classification, Marxan software & in-situ data.
While there is a general consensus on all the factors, from local to global, that can affect coral reef resilience (McClanahan et al., 2012), which factors are the most important for any given reef remains poorly understood (Obura and Grimsdith, 2009). Some modelling studies suggest universal recipes to manage resilience (e.g., the management of herbivores to limit algal overgrowth), but empirical evidences suggest that these recipes cannot cover the range of situation (e.g., Carassou et al., 2013). Models remain invalidated, non-spatial, with arguable parameterization, and the related sensitivity studies can only show the importance of the pre-selected parameters, not those who have been dismissed or neglected. In practice, little is known on what factors contribute to the resilience of coral reef communities and habitats for a particular reef, before it can be studied intensively.
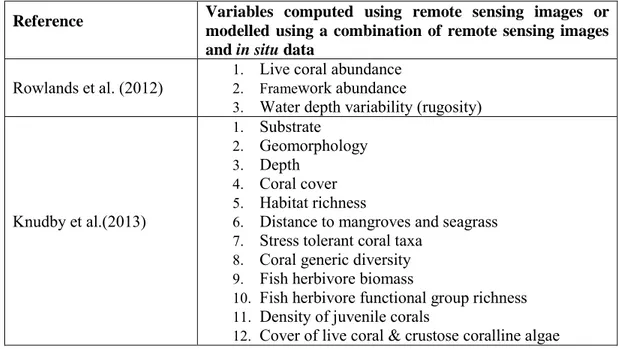
Considering the most likely factors of resilience, remote sensing has been used to map variables that can affect resilience (Table 3). Both stressors and factors of recovery can be mapped and combined in these approaches. A combined index is then used to define areas prone to resilience or not. This is a fairly pragmatic and common-sense approach that could serve well management due to its spatially-explicit approach, yet it remains also very difficult to validate.
Table 3: Examples of variables relevant to measure resilience and mapped or modelled using remote sensing.
Reference Variables computed using remote sensing images or modelled using a combination of remote sensing images and in situ data
Rowlands et al. (2012) 1. 2. FrameLive coral abundancework abundance
3. Water depth variability (rugosity)
Knudby et al.(2013) 1. Substrate 2. Geomorphology 3. Depth 4. Coral cover 5. Habitat richness
6. Distance to mangroves and seagrass 7. Stress tolerant coral taxa
8. Coral generic diversity 9. Fish herbivore biomass
10. Fish herbivore functional group richness 11. Density of juvenile corals
12. Cover of live coral & crustose coralline algae
Another use of remote sensing to characterize resilience is based on revisiting the history of a reef using time-series of images. This is somewhat in opposition to the modelling-forecasting approach but it is even more interesting, because it can actually show if a reef has been
resilient or not after some disturbances, and at which time-scale resilience can be observed. Revisiting the history of reefs can be useful to understand which factors have been at played. However, this approach ideally requires historical field data that are often missing. It is also practically limited to shallow areas. This aspect is the focus of the next section.
1.6. Change detection of coral reefs using remote sensing
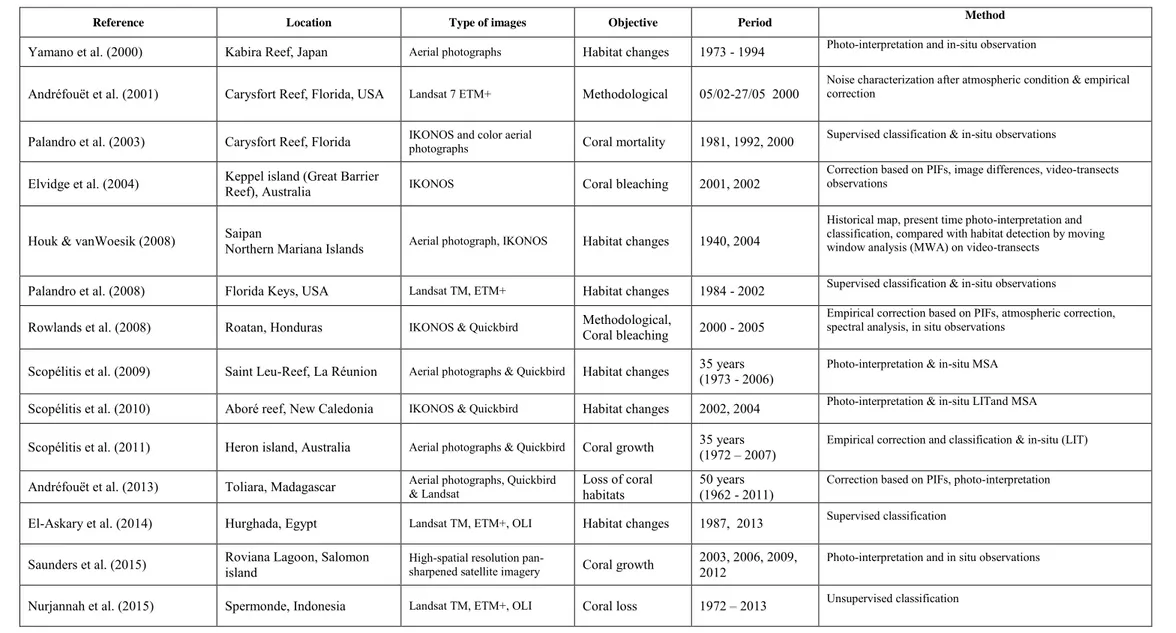
Habitat mapping is a one-time mapping exercise, but scientists and managers may also want to know how a reef has changed, and if the habitats are stable, degrading, or enhancing in quality. Change detection of habitats using remote sensing has been the subject of several papers, but far less than habitat mapping. Table 4reviews the characteristics of representative studies, published in peer-review journals, and focussing on coral habitats (not on seagrass habitats).
We found methodological papers that look at correction of images, quantify noise, and test various methods of analysis and correction, sometimes using only one pair of images. There are also a number of thematic papers that have tried to understand and explain the causes of the changes that have occurred on a reef, sometimes across several decades and using up to a dozen of images. Various types of images have been used, including aerial photographs (color and black and white) which allow very long time-series, and sometimes with the analysis of multi-sensor series of images. All study sites were shallow, in less than 10 meter deep at the maximum.
The characteristics of change detection analysis, especially for long periods spanning several decades is that the accuracy of the treatment is often difficult to quantify (Scopélitis et al., 2009). Often, no historical data exists to be able to quantify accuracy with a confidence similar to a present-time habitat mapping exercise. Many areas may remain undocumented, hence the level of analysis may be limited to some variables of the habitat that can be photo-interpreted (geomorphology) or related to known unambiguous spectral signatures (cover) while the other variables remain unavailable without historical surveys (architecture, taxonomy).
Table 4: Examples of coral reef change detection study and their characteristics. PIF: pseudo-invariant features. LIT: Line intersect transect (English et al., 1994). MSA: Medium Scale Approach (Clua et al., 2006).
Reference Location Type of images Objective Period Method
Yamano et al. (2000) Kabira Reef, Japan Aerial photographs Habitat changes 1973 - 1994 Photo-interpretation and in-situ observation
Andréfouët et al. (2001) Carysfort Reef, Florida, USA Landsat 7 ETM+ Methodological 05/02-27/05 2000 Noise characterization after atmospheric condition & empirical correction Palandro et al. (2003) Carysfort Reef, Florida IKONOS and color aerial photographs Coral mortality 1981, 1992, 2000 Supervised classification & in-situ observations
Elvidge et al. (2004) Keppel island (Great Barrier Reef), Australia IKONOS Coral bleaching 2001, 2002 Correction based on PIFs, image differences, video-transects observations Houk & vanWoesik (2008) Saipan Northern Mariana Islands Aerial photograph, IKONOS Habitat changes 1940, 2004
Historical map, present time photo-interpretation and classification, compared with habitat detection by moving window analysis (MWA) on video-transects
Palandro et al. (2008) Florida Keys, USA Landsat TM, ETM+ Habitat changes 1984 - 2002 Supervised classification & in-situ observations
Rowlands et al. (2008) Roatan, Honduras IKONOS & Quickbird Methodological, Coral bleaching 2000 - 2005 Empirical correction based on PIFs, atmospheric correction, spectral analysis, in situ observations Scopélitis et al. (2009) Saint Leu-Reef, La Réunion Aerial photographs & Quickbird Habitat changes 35 years (1973 - 2006) Photo-interpretation & in-situ MSA
Scopélitis et al. (2010) Aboré reef, New Caledonia IKONOS & Quickbird Habitat changes 2002, 2004 Photo-interpretation & in-situ LITand MSA Scopélitis et al. (2011) Heron island, Australia Aerial photographs & Quickbird Coral growth 35 years (1972 – 2007) Empirical correction and classification & in-situ (LIT) Andréfouët et al. (2013) Toliara, Madagascar Aerial photographs, Quickbird & Landsat Loss of coral habitats 50 years (1962 - 2011) Correction based on PIFs, photo-interpretation El-Askary et al. (2014) Hurghada, Egypt Landsat TM, ETM+, OLI Habitat changes 1987, 2013 Supervised classification
Saunders et al. (2015) Roviana Lagoon, Salomon island High-spatial resolution pan-sharpened satellite imagery Coral growth 2003, 2006, 2009, 2012 Photo-interpretation and in situ observations Nurjannah et al. (2015) Spermonde, Indonesia Landsat TM, ETM+, OLI Coral loss 1972 – 2013 Unsupervised classification
High thematic richness could be achieved by Scopélitis et al. (2009) even with limited ground-truthing, at least to the point that they could demonstrate, using photo-interpretation techniques that an assemblage of coral communities at Saint-Leu fringing reef in La Reunion has recovered after a hurricane and moderate bleaching event across a 35-year period. In contrast, also using photo-interpretation techniques, Andréfouët et al. (2013) showed for the barrier reef of Toliara in Madagascar that coral communities have steadily decreased due to destructive artisanal fishing, without any signs of recovery. These two Indian Ocean stories highlight two different conclusions in term of resilience: based in the trajectory of their coral habitats, Saint-Leu has been a resilient reef in the face of acute short term disturbance while Toliora appears to be a non-resilient reef in the face of chronic disturbance. Thus, time-series of remote sensing images have the potential to inform on the capacity of a reef to be resilient depending on the type of disturbances the reef had to face during the study period.
1.7. General research objective& research questions
The objective of the study is to study for the first time the resilience of an Indonesian coral reef and its habitats, using a multi-sensor time-series of very high spatial resolution (VHR) multispectral satellite images. Bunaken Island, in the Bunaken National park in North Sulawesi, is the study area.
The focus is on thematic interpretation, not image processing method development because the goal is also to provide practical recommendations for Park managers in term of using remote sensing to monitor reefs more effectively, especially the shallow reef flats which have been neglected by monitoring programs.
The INDESO project provides the imagery by purchasing all cloud free images available from the IKONOS, Quickbird, Geoeye and Worldview multispectral archive of images between 2001 and 2015.
The thesis can be divided in 3 series of important questions and steps, inspired by the information presented throughout the previous sections:
1. What are the present day coral reef habitats found in Bunaken National Park and Bunaken Island? How are they distributed? What is the habitat diversity?
2. Can we detect changes in these habitats using a multi-sensor time-series VHR images? Can we reconstruct the recent history of changes around Bunaken Island? Are the habitats resilient?
3. If there are changes on reef habitats after answering Question 2, what are the causes of these changes? If there are no changes after answering Question 2, what resilience factors could be at play?
After answering these questions specific to Bunaken Island, the potential for generalization to other reefs and practical recommendations for mapping and monitoring Indonesian reefs will be discussed.
1.8. Thesis structure
This thesis has been divided into six chapters. Three of them are presented in the form of submitted papers to peer-reviewed journal. We refer to a multi-source approach in the title considering first the use of images acquired by different satellite vectors, but also the use of in situ data, and also the use of altimetry data to explain some of the observed changes.
The current Chapter 1 has presented here the research background and key information used to define the subject, with brief presentation on the INDESO project, Indonesia coral reefs, remote sensing of coral reefs and habitat mapping, remote sensing of Indonesia coral reefs, resilience of coral reefs and its mapping, and change detection of coral reefs. Then the general research objectives and the main research questions are given.
Chapter 2 presents in more detail the field and image processing methods used in the following chapters, and justify the choice of these methods. Bunaken National Park and island are also presented.
Chapter 3 presents the results of the field survey, the creation of a detailed habitat map and the analysis of the map in term of habitat richness and distribution. The chapter is a paper entitled Revisiting Bunaken Island (Indonesia): a habitat stand point using very high spatial
resolution remotely sensed, which is submitted to the journal Marine Pollution Bulletin, for a
special issue on the project INDESO.
Chapter 4 addresses the mortality of corals related to the 2015-2016 El-Niño that we could witness during the study period. This was an opportunistic event that brought new insights on the processes that control the resilience of Bunaken Island coral reef flats. This chapter is a paper entitled Coral mortality induced by the 2015-2016 El Niño in Indonesia: the effect of
rapid sea level fall, which is in press with the journal Biogeosciences and also available as a
discussion paper open to comments (DOI:10.5194/bg-2016-375).
Chapter 5 presents the change detection analysis of coral reef habitats in Bunaken National Park using an original scenario-based approach. This chapter is a paper entitled Assessment of
the resilience of Bunaken Island coral reefs using 15 years of very high spatial resolution
satellite images: a kaleidoscope of habitat trajectories, which is under review with the journal
Marine Pollution Bulletin, for a special issue on the project INDESO.
Chapter 6 reviews the results, highlight the main findings and put them in the broader context of understanding the resilience of coral reefs, especially in Indonesia, and make suggestions for the future monitoring of these reefs using a combined remote sensing and monitoring approach.
CHAPTER 2. SETTINGS, MATERIAL AND METHODS
2.1. Introduction
In this chapter are presented aspects that are general to all the next chapters (Study site, Image data sets, etc.), or additional information not provided in each of the chapter submitted for publications. This includes in particular general methodology information that are often not needed in publications formatted for specialized journals. I also provide here previews of some intermediate results (number of surveyed points, number of mapped polygons, etc.) to illustrate the relevant topics. These results are also provided in greater details in the following chapters.
2.2. Study site: Bunaken National Park and Bunaken Island
Bunaken National Park (BNP) is located at the northwest tip of Sulawesi, Indonesia (Figure 4). The location is at the core of the Coral Triangle, a vast area spanning Malaysia to Solomon Island, where the number of marine species is maximum (Hoeksema, 2007).
The BNP is one of the flagships of coral reef conservation in Indonesia. The park has been created in 1991 by decree of national government (Erdmann et al., 2004). The area includes part of the coastline around the nearby city of Manado, and five islands: Bunaken, Manado Tua, Siladen, Nain, and Mantehage (Figure 4). Since 1991 the Park is ruled by a zoning plan that has been designed using socio-economic constraints with the participation of numerous stakeholders for a better compliance.
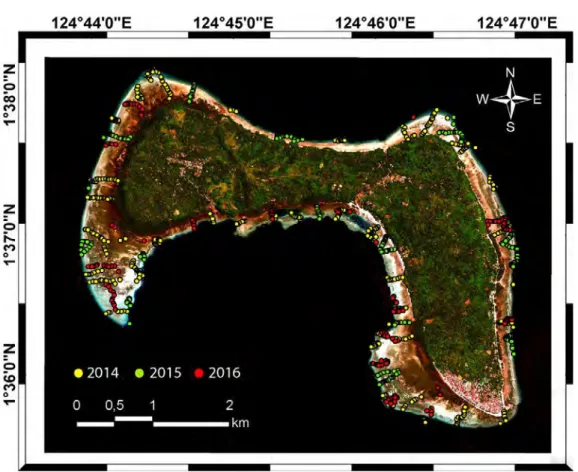
Bunaken Island (BI) is located by 1.62379°N, 124.76114°E. It is surrounded by a simple fringing reef system, comprising reef flats, several small enclosed lagoons, and forereefs. At low tide, the reef flats are sometimes dry, and the maximum depth can reach above 2m at spring high tide conditions. Most of the time, depth would be between 40 and 1.50 meter. The tide regime is semi-diurnal, but with marked diurnal inequalities (Ray et al., 2005), with a maximum spring tidal range that can reach 2.52 m.
BI is famous for his wall dives that attract a high number of divers. Tourism is one the main activity in the park. The reef flats themselves are seldom visited by tourists, except one location dedicated to snorkelling activities. However, reef flats are systematically combed by
the resident population at low tide to harvest crustaceans, molluscs and small fishes living in corals and seagrass beds. The gleaning activity occurs mostly on the south and east reef flats (personal observations). A survey of 7 fishermen suggested that destructive dynamite fishing is not occurring anymore around BI, since more than 20 years (personal data).
Figure 4: Location of Bunaken in Indonesia. Sulawesi is the island shaded in grey on the top panel.
NPI is one of the most studied Indonesian coral reef site (Table 5). From the various Bunaken NP study, particularly in Bunaken island (Table 4), Newman et al (2007), Le Drew et al. (2004) and Fuad (2010) were discussing issues related to remote sensing. Other studies are related to biodiversity, taxonomy, functional processes and effectiveness of the park management, especially in the early year of the park.
Table 5: Examples of Bunaken National park research activities in the past 20 years
Author Year Topic
Boyer et al. 1997 Bunaken (North Sulawesi, Indonesia) coral reef monitoring: a low-tech approach using volunteer scuba divers for data collection. Methods and preliminary results.
Boyer et al. 1999 Fish visual census and low-tech coral reef monitoring
Cerrano et al. 2000 Psammobiontic sponges from the Bunaken Marine Park (North Sulawesi, Indonesia): interactions with sediments Schiaparelli et al. 2000 Ecology of Vermetidae (Mollusca: Caenogastropoda)
Bavestrello et al. 2001 Marine Biodiversity of Sulawesi Sea Holden 2002 Characterisation of optical water quality
Puce et al. 2002 Zanclea Gegenbaur (Cnidaria: Hydrozoa) species from Bunaken Marine Park (Sulawesi Sea, Indonesia) Erdmann and Boyer 2003 Lysiosquilloides mapia, a new species of stomatopod crustacean from Northern Sulawesi (Stomatopoda: Lysiosquillidae) Turak & De Vantier 2003 Reef-building corals: Rapid ecological assessment of biodiversity and status Fox et al. 2003 Recovery in rubble fields: long-term impacts of blast fishing Erdmann et al. 2004 Building effective co-management systems for decentralized protected areas management Le Drew et al. 2004 Spatial statistical operator applied to multidate satellite imagery for identification of coral reef stress. Runtukahu et al. 2007 AcroporaSulawesi, Indonesia community composition at Siladen Island, North
Tazioli et al. 2007 Ecological Observations of Some Common Antipatharian Corals in the Marine Park of Bunaken (North Sulawesi, Indonesia) Newman et al. 2007 Assessing the effect of management zonation on live coral cover using multi-date IKONOS satellite imagery Fava et al. 2009 Possible effects of human impacts on epibenthic communities and coral rubble features in the marine Park of Bunaken (Indonesia) Fuad 2010 Coral reef rugosity and coral biodiversity
Ricciardi et al. 2010 Assemblage and interaction structure of the anemonefish-anemone mutualism across the Manado region of Sulawesi, Indonesia Tokeshi & Daud 2011 Assessing feeding electivity in Acanthaster planci
Bavestrello et al. 2012 Helicospiral growth in the whip black coral Cirrhipathes sp. (Antipatharia, Antipathidae) Sidangoli et al. 2013 Institutional challenges to the effectiveness of management of Bunaken National Park Setiawan et al. 2013 Community structure of reef fish in reef waters on Bunaken National Park, North Sulawesi Patty et al. 2015 Community of reef fish on artificial reef Biorock in Siladen Island waters Manado city, North Sulawesi
Newman et al. (2007) used a pair of IKONOS images, between 2001 and 2004 to measure semi-quantitative changes in coral cover. The results were discussed by management zone, but no detailed maps of change are provided. They discuss that coral cover improvement (or not) could not be related to the various zones of the park, hence suggesting no clear effect of the park rules on coral growth or recovery. LeDrew et al. (2004) used a form of local indicator of spatial association (texture) to try to identify changes but the little reported variations are not discussed thematically. However, despite these early remote sensing studies, no habitat maps exist for BI or BNP till 2013.
2.3. Field work method for habitat typology
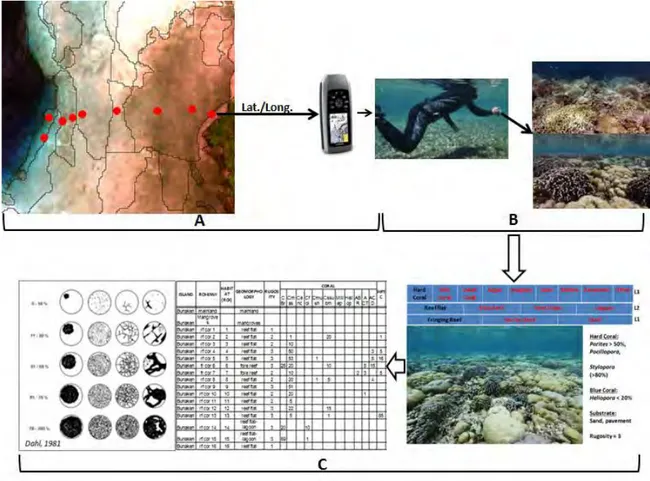
This thesis is built on field data, aimed at characterizing habitats (see definition in Introduction). Since we aim to describe habitats fully, we need to characterize cover, architecture and taxonomy which can be perceived only in the field. The description needs also to be representative and cover as much as possible of the different possible combination to capture the actual diversity of habitats (Andrefouët, 2008). Papers detailing field work are not many but see general survey techniques in English et al. (1997) and in a remote sensing context, see Roelfsema and Phinn (2010).
To inventory habitats, the work is guided by the imagery (Figure 5, step A). As many configurations in color and texture as possible are visited in the field, generally following long cross-reef transects where Global Positioning System (GPS) records and wide-angle photographs are taken systematically every minute, and/or when the bottom is visually changing (Figure 5, step B). GPS waypoints are preselected on the ENVI 4.7 software using the images that provide the latitude and longitude information with a precision generally better than 10 meter.
Back from the field (Figure 5, step C), the wide-angle photographs are visually analyzed on a laptop or desktop to give a semi-quantitative value of cover, rugosity, growth form, and dominant species. This is equivalent to the so-called Medium Scale Approach description (Clua et al., 2006) generally performed in situ, but which can be performed using photographs as well. Several photographs can be used for one habitat, and the average of the observations is kept. A spreadsheet is filled in Excel and a habitat ID-card can be created using PowerPoint (see examples in Appendix). The attributes of the habitat can be dependent on the context and for Bunaken, we considered the attributes listed in Table 5. Scopélitis et al. (2010) have shown the good agreement that is expected between a trained surveyor practicing MSA and the more quantitative approach based on cover measurements along a transect. The advantage of the technique applied here is its speed in the field. Typically 6 to 8 cross-reef transects sites can be covered in one day, depending on distances and transit time in a small katinting (small boat with a dedicated driver, stable and convenient for shallow and calm seas, Fig. 5), representing fifty to hundred waypoints, as an order of magnitude. For the forereefs, they were investigated using SCUBA in the 0-20 meter depth range using the facilities of the Bastianos diving resort located in Bunaken Island.