SiF 2020 – The 11th International Conference on Structures in Fire
The University of Queensland, Brisbane, Australia, 30th November - 2nd December, 2020
STEEL SHEET PILES EXPOSED TO FIRE
EXPERIMENTAL TESTS AND NUMERICAL MODELLING
Jean-Marc Franssen1, João Martins2 ABSTRACT
This paper deals with the behaviour under fire of vertical walls made of steel sheet piles in retaining walls close to, for example, a traffic road or an industrial facility or in underground structures such as car parks or cut and cover tunnels. For the later situation, the sheet pile walls support not only the horizontal pressure from the ground but also the vertical loads induced by the different floors.
Four experimental tests have been performed in the fire lab of ULiege on a test setup where different soils were located at the back of a heated sheet pile wall, namely sand and clay, either saturated with water or not. Equivalent thermal properties have been derived that allow reproducing in a simple conductive model the temperature distributions measured on the steel piles.
Modelling the whole sequence of events from erection of the structure to failure under fire requires the successive application of 2 different software, RIDO that reproduces the evolution of the displacements and force distribution in the wall during the successive sequences of construction and SAFIR® that models the behaviour of the structure when it is subjected to fire. The links that have been established to transfer the results of the first simulation to be taken as initial conditions for the second software are described. Finally, a specialised one node finite element that has been introduced in SAFIR to model the elasto-plastic behaviour of soil is described and an application example is briefly discussed.
Keywords: Steel; sheet piles; tests; modelling; soil 1 INTRODUCTION
Steel sheet piles are used extensively in the construction industry, as temporary as well as permanent structures, essentially for retaining the horizontal pressure of soil or water. In most applications and, generally speaking, in temporary structures, there is no requirement with respect to the fire resistance of such retaining walls.
There are some cases yet when the stability of a wall made of sheet piles must be ensured during a fire, such as retaining walls close to a traffic road, walls of cut and cover tunnels or underground car parks, see Figure 1. In the latter case, sheet pile walls support not only the horizontal pressure from the ground, the horizontal forces from eventual anchorages or from the floors that expand or pull on the walls, but also the vertical loads induced by the floors.
1 Professor, Liege University,
e-mail: [email protected], ORCID: https://orcid.org/0000-0003-2655-5648
2 Head of Technical & Marketing Department, ArcelorMittal
Figure 1. Walls in an underground car park made of unprotected steel sheet piles [1]
2 THERMAL CALCULATIONS 2.1 General approach
It cannot be envisaged to make experimental tests for every project to be realised. Modelling has to be made and, because of the complexity of the problem, numerical modelling is the tool of choice.
The choice of the fire scenario is of course crucial but it should be made independent of the type of structure in the building (at least as long as non-combustible materials are used). It will therefore not be discussed here. The software SAFIR® [2] that has been developed namely by the first author and is used in the company of the second author can accommodate different representations of the fire attack such as time-temperature curves or different localised fire models such as the LOCAFI [3] solid flame model or results of CFD modelling [4].
On the base of the chosen fire scenario, the first step in the design is the computation of temperatures in the steel piles. If the attack from the fire on the exposed side and the conduction of heat in the eventually protected steel section is handled by nowadays traditional techniques, distribution of heat in the ground on the back of the wall is much more complex, especially if the soil is saturated with water the movements of which will participate to the distribution of heat. The idea was to make a series of full scale tests, with different soil compositions, in order to see whether the results of these tests could be reproduced with an acceptable level of approximation by a much simpler purely conductive model
2.2 Experimental tests
Four tests were conducted in the fire lab of Liege university. The gas furnace was closed on one of its vertical sides by a caisson made, on one side, of full scale PU 6 steel sheet piles that faced the furnace and contained a given soil for each test with a thickness in the order of 50 cm, see Figure 2. The steel wall was not loaded during the test and the top of the caisson was not closed, which left way for eventual vapour release to escape from the caisson. Two different types of soil were tested, namely sand and clay, each one in two different situations with regards to water, either saturated or not.
Figure 2. Schematic view of the test setup (left) - The caisson and the furnace after a test (right) [5]
The standard fire curve ISO 834 was applied for 3 hours, except for the test with water saturated sand in which a shortage of gas supply limited the test to 2 hours.
Nine temperature gauges were applied on the steel piles at different locations whereas 5 thermocouple trees of 6 gauges each were placed in the soil.
There was a marked influence of the soil on the steel temperatures that were observed to be the highest with non-saturated sand, then non saturated clay, saturated clay and, markedly colder with saturated sand. For the latter case, the significantly lower temperatures were likely due to recirculation of liquid water in this highly permeable soil. The evolution in time of temperatures with saturated soils was less regular than with non-saturated soils. There were also, for each soil, temperature differences in the steel piles that can be linked to the concave or convex side with respect to fire exposure (VL and VR compared to M on Figure 2 – left) or to a higher value of the local massivity at the interlocks between two adjacent piles (GL and GR on Figure 2 – left).
2.3 Thermal properties of soils
The tests have been recalculated and some equivalent thermal properties have been proposed for various soils as gravels, sand, sandy clays or clays, each saturated with water or not.
Values were proposed for thermal conductivity and specific heat but also for an equivalent water content that can be linked to the soil permeability. It may come as a surprise that water contents higher than 1000 L/m³ are proposed when the permeability is higher than 10-8 m/s, but it has to be understood that this equivalent water content is introduced here to take into account by water evaporation an energy dissipation that in reality takes place essentially by water movements.
All proposed thermal properties can be found in detail in reference [5] that can be downloaded from Internet.
3 LOADING FROM THE SOIL 3.1 Pressure from the soil
It is commonly accepted that the pressure from a soil on a vertical wall p0 is proportional: to the vertical
distance from the surface z; to the specific weight of the soil γ; and to a coefficient that takes into account mechanical properties of the soil (such as the friction angle φ) K0, see equation (1)
p0 = K0 γ z (1)
A constant can be added if a vertical load is applied on the surface.
The specific weight of the soil is reduced in equation 1 by the specific weight of water γw for the zones of
the wall that are under the water table, while the hydrostatic pressure from water has to be applied in such zones.
The beam finite element of SAFIR can accommodate trapezoidal distributed loads. They can be formulated in the global system of coordinates of the structure or in the local system of coordinates of the element but,
even in the latter case, these loads do not follow the element when it enters in the large displacement domain. The approximation is expected to be acceptable as the rotations of the retaining walls are usually limited, even in the near failure situations.
The hydraulic pressure from the water table has nevertheless been coded as a following pressure in the sense that the direction of this load will remain perpendicular to the axis of the element and its intensity is proportional to the vertical distance from the surface of the water table, taking into account large displacements. The following character of this load is expected to have very limited effects, as mentioned about the trapezoidal loads from the soil.
The pressure given by equation (1) is valid when the retaining wall is at rest, i.e. when it is not subjected to significant displacements. The wall may yet be moving away from the soil at certain levels, for example because of a global rotation induced by loss of stability of the wall. The pressure will then decrease as the displacement increases, down to a certain value that will remain constant, whatever the displacement. This value, called active pressure, is computed by an equation similar to equation (1) but with replacing the coefficient for the wall at rest K0 by a coefficient for active pressure Ka. On the contrary, if the wall is
subjected to a displacement toward the soil, the pressure will increase with the displacement up to a value characterised by a coefficient for passive pressure Kp.
During the course of a fire, horizontal movements of the retaining wall are to be expected, due to thermal expansion of the horizontal beams and slabs, to sagging of these elements at the time of failure and to thermal gradients on the depth of the steel sheet pile, see section 2.2.
As these displacements can develop in any direction and, at a given location, can change in direction during the course of the fire, the load cannot be predicted beforehand and a specific procedure had to be developed which is described in the section underneath.
3.2 Specific finite element
As the evolution of the pressure is directly dependent on the displacements and the displacements in the numerical model are computed for the nodes, these effects have been taken into account by a dedicated finite element that is attached to the nodes.
A specific finite element has been developed with the following characteristics.
• The element is linked to a single node, one node of the structure that is supposed to be in contact with the soil. It can thus be used in models made of beam finite elements, shell elements or even solid elements.
• The direction of the pressure is given by the angle related to the global axis X in 2D models or by a vector in 3D models. The direction is defined from the soil to the structure. If the element is used to model an elastic foundation under a beam, the vector will thus point upward, it will point to the left on the wall of a car park that is on the right side, and to the right for the wall on the left hand side. • The constitutive relationship in the element is expressed in terms of force-displacement relationship
F-u that is elastic-plastic as shown on Figure 3 where F has the direction of the element and u is the
component of the displacement of the node parallel to this direction. This relationship is characterised by a lower limit FI and an upper limit FS, as well as the stiffness used between both levels K. If the element is used to represent a foundation underneath a beam, the lower limit may be set to 0.
• The behaviour in case of reversal in the direction of the displacement is plastic; unloading follows the elastic stiffness until reaching the opposite level.
• As engineers are used to quantities of soil mechanics that are expressed in terms of kN/m³ for stiffness and kN/m² for pressures, such units are used in the input data3 together with an area of influence of each element A that will multiply the input values in order to obtain, for the element, upper and lower limits in N and a stiffness in N/m.
• In order to be consistent, a specific command has been introduced in the 2D model of the sheet pile used for the thermal analysis, see Section 2. This command gives the width B of the section that has been modelled; the section of all fibres of the section is then divided by B which will lead to the fact that all mechanical properties of the section are given for a width of the wall of 1 meter.
Figure 3. Force displacement relationship in the element The meaning of Fi and Ui in Figure 3 will be explained in section 4.
4 SEQUENCES OF CONSTRUCTION 4.1 Introduction
For buildings that are erected above ground level, it is commonly accepted that the successive sequences in the building process need not be explicitly modelled; the numerical model is built completely and, when finished, is subjected to all the loads of the load combination that is considered. This is probably justified by the fact that, generally speaking, a building is designed in such a way that the behaviour remains in the elastic domain and does not lead to large displacements during the construction phases. It has also to be noted that the construction process is essentially from bottom to top in such a way that gravity loads are progressively applied on the elements which are already in place.
The building process of an underground car park with steel sheet piles walls, on the contrary, may involve different successive sequences that lead to non-linear effects. Because of that, the retaining walls with multiple supports that are present in these car parks are usually designed on the base of a subgrade reaction model or with a Finite Element method, taking into account the soil structure interaction and the execution phases. The deflections as well as the bending moments obtained at the end of the construction process are more realistic than those determined with a limit equilibrium method.
The software used to design the sheet pile structure in the normal case by ArcelorMittal is called RIDO and it is based on a subgrade reaction model. The user interface is not very attractive, but it is quite simple to use, versatile and powerful.
When designing a flexible retaining wall, it is vital to select adequate values for the stiffness of the springs that simulate the soil reaction (see Section 3) and those that eventually simulate the supports provided by the horizontal slabs if these members are not explicitly modelled; these values will influence the active and passive soil pressure, as well as the deformation of the sheet pile. The subgrade reaction modulus kh of the
soil layers, which represent the stiffness of the soil, can be estimated with different formulas. The French National Annex of EN 1997-1 [6] gives a formula that is well adapted for stiff structures. Sheet pile walls are rather flexible structures and it is common practice to use Chadeisson’s abacus [7] that considers only
two parameters of the shear strength of the soil: the cohesion and the internal friction angle. The stiffness of the soil is simulated with a single slope.
It is recommended to check the influence of the selected parameters by performing a sensitivity analysis, mainly on the subgrade modulus coefficients, the stiffness of the supports, the shear strength of the layers, and the level of the groundwater, before choosing the design case that will be submitted to a fire scenario. If the retaining wall is anchored in the ground or supported by temporary struts, which is very common, the design of anchors and struts is usually performed by a structural engineer at a later stage, and although this is not common practice, it would be preferable to recheck the final design of the retaining wall with the stiffness of the optimized strutting system.
If the structure has several levels below ground, the fire design will be performed for each level separately. Theoretically, the cold case scenario associated to the fire analysis could be slightly different for each level but, in most projects, it is enough to consider the final stage of the construction process for all fire scenarios. After the analysis of the construction phase at room temperature, the software creates an input file that defines the structure and its initial condition to be used by SAFIR. In order to make the transition from RIDO to SAFIR transparent to the user, these two codes have been integrated in a module called SARI. 4.2 Numerical simulation of the structural behaviour
The position of the wall before the fire results from different phases that generated horizontal displacements which influence the behaviour of the soil, see Figure 3. The wall is considered as vertical in the initial configuration in the analysis by SAFIR. In order to take the preliminary displacements into account, the soil finite elements receive the initial condition of the soil, noted as UiandFion Figure 3, determined from
the preliminary analysis made with RIDO.
In the first iteration of the first time step of the fire analysis, SAFIR computes the force in the springs corresponding to a displacement of 0. These forces are applied as out of equilibrium forces and lead to incremental displacements. A few iterations are requested for the structure to find its equilibrium because of the non-linear behaviour of the springs. As the axial stiffness of the springs is significantly higher than the bending stiffness of the wall, the position of the wall at the end of the first step and the pressure in the springs are virtually equal to the values defined as Fi and Ui in the springs. The value of the first time step is short, typically 1 second, which ensures that the effects of temperature are negligible at this stage. The steel wall is designed in such a way that the load level, induced by the pressure from the soil and by the vertical loads of the slabs, does not induce plasticity in the material. The software has no difficulty to converge as the simulation is normally made in the quasi-static mode. The dynamic mode is indeed not necessary to model the failure mode by buckling that may develop. In case a simulation in the dynamic mode should be requested, it can be computed that a displacement of 0.050 m that develops in 1 second corresponds to an acceleration of 0.1 m/s² or 0.01 g which should be accommodated by the structure. If not, a simulation with an initial time step of 3 seconds would lead to an acceleration as low as 0.01 m/s² or 0.001
g.
After this initial step, the simulation can continue with a progressive increase of the steel temperature depending on the fire scenario leading, or not, to a failure by buckling of the heated level toward the inside of the car park.
5 CASE STUDY
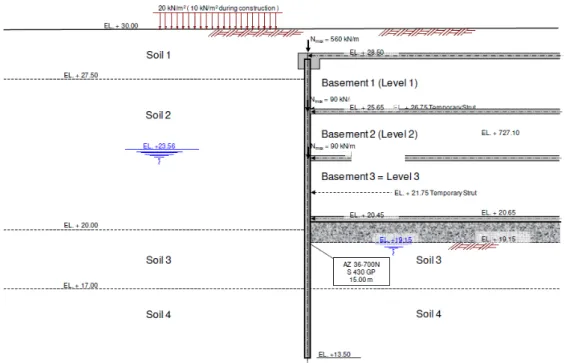
This case study is based on a real project, see Figure 4, but the loads have been increased on order to obtain a collapse before the required fire resistance time of 90 minutes.
The steel sheet pile is 15 m high. All levels given hereafter are with respect to the top of the wall. The car park is on the right hand side with 4 slabs at levels z = 0 m, -2.75 m, -5.35 m and -8.05 m. A vertical load of 740 kN/m is applied on the upper slab while the other slabs transfer a load of 250 kN/m.
Figure 4. Sketch of the steel wall at the final stage
The sequence of events in the construction process after introducing the pile in the ground is: 1) Remove the soil down to z = -4.25 m.
2) Install a temporary strut at z = -2.75 m
3) Pump the water table down to -7.55 m and remove the soil to this level. 4) Install a second temporary strut at z = - 6.75 m.
5) Pump the water table down to -9.35 m and remove the soil to this level. 6) Execute the 4 slabs.
7) Remove the temporary struts.
8) The water table goes back up to z = -4.94 m in the ground while it is maintained at -9.35 m below the lowest slab of the car park.
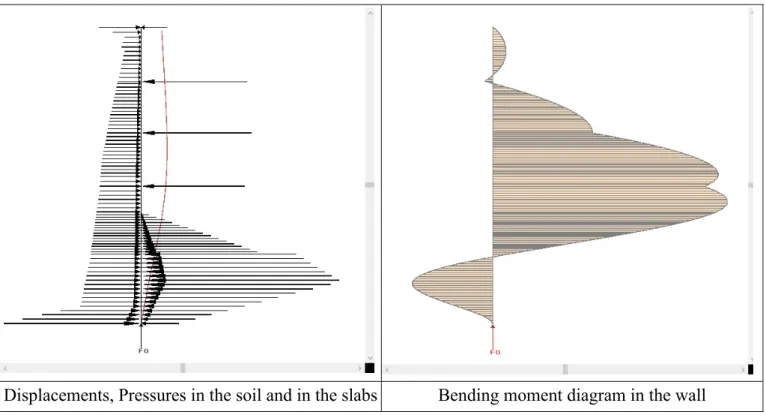
Figure 5 shows the situation at the end of the construction phase. On the left side are the pressures in the soil, on both sides of the wall, the reactions from the concrete slabs and, in red, the displaced position of the wall amplified by a factor of 50. In order to draw the diagram of pressures, the force in each spring element is divided by the area of influence of this spring. The bending moment diagram is shown on the right hand side where it can also be observed that the only imposed boundary condition is the vertical displacement at the foot of the wall. The rigid body movements of rotation or horizontal translation of the wall are prevented by the springs, which are not represented here4.
Displacements, Pressures in the soil and in the slabs Bending moment diagram in the wall Figure 5. Situation before the fire
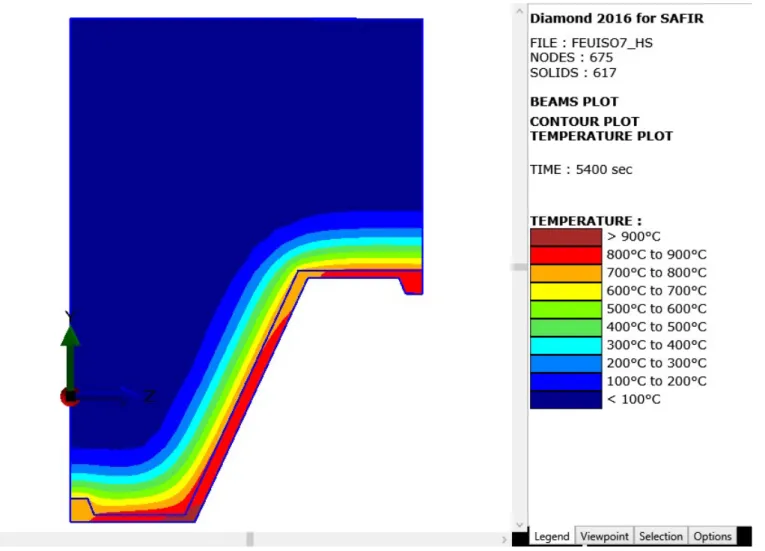
Figure 6 shows the isotherms in the steel sheet pile after 90 minutes of ISO fire. The steel pile is of the type AZ 36-700N – S 4305 GP. It has a depth of 499 mm. The total depth of the model is 1 meter with a cover of soil of 501 mm on the steel section which is enough to have the same temperatures as in a semi-infinite medium. The model has a width of 700 mm, owing to the two vertical axes of symmetry of the section. Water saturated sand with a water content of 200 kg/m³ has been considered for the thermal properties of the soil owing to the presence of water at the back of the wall. The temperatures in steel after 90 minutes of fire are in the range from 715°C to 925°C. Only the lowest level of the car park is subjected to the fire.
Figure 6. Isotherms after 90 minutes of ISO fire
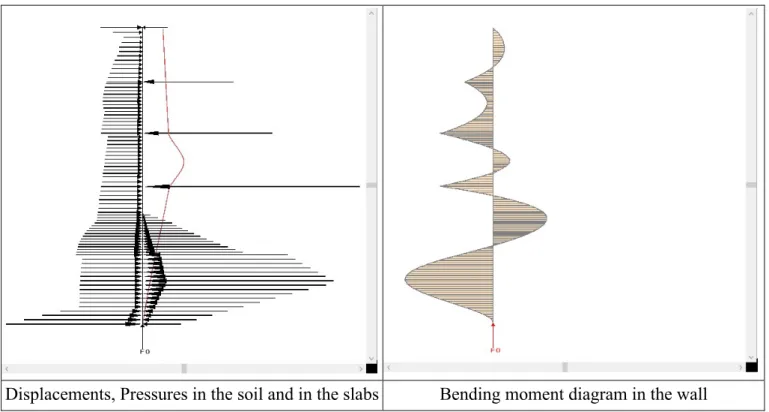
Figure 7 shows the situation in the wall just before collapse which occurs just before 90 minutes by buckling of the wall at the level that is subjected to the fire.
It can be observed that the pressure diagram has changed significantly. More pronounced are the modifications in the reactions of the slabs and even more in the bending moment diagram.
Displacements, Pressures in the soil and in the slabs Bending moment diagram in the wall Figure 7. Situation just before failure
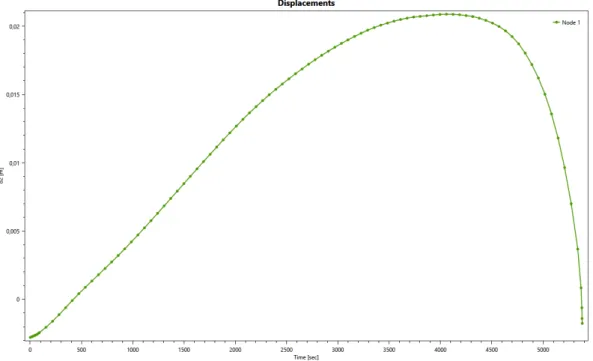
Figure 8 shows the evolution with time of the horizontal displacement at mid-level of the fire affected floor and Figure 9 shows the evolution with time of the vertical displacement at the top of the sheet pile. They clearly show the vertical asymptotes typical of run-away failures, which ensures that end of convergence in the simulations corresponds to the loss of load bearing capacity and not to a numerical failure.
Figure 9. Vertical displacement at the top of the wall 6 CONCLUSIONS
The sequences of events involved in the construction process of buildings are very rarely taken into account in the numerical simulations performed to model the behaviour of the building structure subjected to a fire. This cannot be the case for retaining walls of underground car parks made of steel sheet piles. In such a construction, the quite flexible wall is subjected to various horizontal displacements produced by a succession of different operations that change the applied loads as well as the structural system.
A procedure has been established in order to link a software specialised in the analysis of these construction sequences at room temperature and a software that is specialised in the analysis of structures subjected to fire. The situation that prevails at the end of the construction process is transmitted from one software to the other one by the possibility to introduce an initial situation for the force Fi and the displacement Ui in the specialised 1 node elasto-plastic finite element that has been developed to represent the pressure of the soil as a function of the horizontal displacement of the wall.
Some experimental full scale tests have been performed on steel sheet piles backed by 2 different types of soils, either water saturated or not, in order to derive equivalent thermal properties of the soils to be used in thermal numerical simulations.
A case study has been presented where only the steel wall is modelled explicitly while the concrete slabs are represented by elastic springs. The door is yet open for modelling a whole frame made of the two walls of the car park, one on each side, with the concrete slabs also modelled explicitly, including the one that is subjected to the fire.
ACKNOWLEDGMENT
The experimental tests described in this paper have been undertaken in collaboration with J-B Schleich of ArcelorMittal. The interconnection between RIDO and SAFIR have been coded under the supervision of M. Meyrer and A. Schmit of ArcelorMittal.
REFERENCES
1. Underground car parks. Guide book for the Netherlands, ArcelorMittal Sheet Piling, Esch-sur-Alzette, Luxembourg. 2018
2. Franssen, J-M & Gernay T,. Modeling structures in fire with SAFIR®: Theoretical background and capabilities. Journal of Structural Fire Engineering, 8(3), 300-323. (2017). http://hdl.handle.net/2268/202859
3. Brasseur, M, Zaharia, R, Obiala, R, Franssen, J-M, Hanus, F, Zhao, B, Pintea, D, Sanghoon, H, Vassart, O, Nadjai, A, Scifo, A et Thauvoye, C, Temperature assessment of a vertical steel member subjected to localised fire (LOCAFI), Publication Office of the EU, DOI 10.2777/67601,
4. Tondini, N, Morbiolo, A, Vassart, O, Lechëne, S & Franssen, J-M, An integrated modelling strategy between a CFD and an FE software: Methodology and application to compartment fires, J. Struct. Fire Engng, 7(3), 217-233 (2016). http://hdl.handle.net/2268/206664.
5. Steel Sheet Piles. Underground car parks. Fire resistance. ArcelorMittal, Esch-sur-Alzette, Luxembourg,
https://sheetpiling.arcelormittal.com/wp-content/uploads/2018/03/AMCRPS_UCP_Fire_Resistance_EN.pdf
6. NF-EN 1997-1 juin 2005, Eurocode 7 : calcul géotechnique – Partie 1 : règles générales, AFNOR Editions, 2ème tirage août 2011
7. Chadeisson, R, Parois continues moulées dans le sols, Proceedings of the 5th European Conf. on Soil Mechanics and Foundation Engineering, Vol. 2, Dunod, Paris, pp.563-568, 1961
![Figure 1. Walls in an underground car park made of unprotected steel sheet piles [1]](https://thumb-eu.123doks.com/thumbv2/123doknet/6098143.154603/2.892.201.691.98.424/figure-walls-underground-park-unprotected-steel-sheet-piles.webp)
![Figure 2. Schematic view of the test setup (left) - The caisson and the furnace after a test (right) [5]](https://thumb-eu.123doks.com/thumbv2/123doknet/6098143.154603/3.892.68.831.83.315/figure-schematic-view-test-setup-caisson-furnace-right.webp)