Supporting Information
Ni
3N/NF as bifunctional catalysts for both hydrogen generation and
urea decomposition
Shengnan Hua, Chuanqi Fenga, Shiquan Wanga, Jianwen Liua, Huimin Wua,*, Lei
Zhangb,c, Jiujun Zhangb,*
a Hubei Collaborative Innovation Center for Advanced Organic Chemical Materials & Key Laboratory for the Synthesis and Application of Organic Functional Molecules, Ministry of Education & College of Chemistry & Chemical Engineering, Hubei University, Wuhan 430062, PR China
b Institute for Sustainable Energy/College of Sciences, Shanghai University, Shanghai, 200444 China
c Energy, Mining & Environment, National Research Council of Canada, Vancouver, BC, V6T 1W5, Canada
* Corresponding author. Tel.: 86 27 88662747; Fax: 86 27 88663043. E-mail address: whm267@hubu.edu.cn; jiujun.zhang@i.shu.edu.cn
Table of contents
Ⅰ XRD patterns of Ni(OH)2/NF and Ni/NF
Ⅱ SEM images of bare Ni foam, Ni3N/NF, Ni(OH)2/NF and Ni/NF
Ⅲ LSV curves of Ni3N/NF in 1.0 M KOH with different urea concentrations
Ⅳ Nyquist plots of Ni3N/NF, Ni(OH)2/NF, Ni/NF, bare NF and Pt/C
Ⅴ XRD pattern and XPS spectra of Ni3N/NF after 3000 cycles
Ⅵ STEM-EDX mapping images ofNi3N/NF
Ⅶ CV curves of Ni3N/NF, Ni(OH)2/NF, Ni/NF
Ⅷ Comparison of electrochemical performance of Ni3N/CC cell in the literature
Ⅸ Comparison of catalytic performance of some UOR catalysts in recent years
Ⅰ XRD patterns of Ni3N/NF, Ni(OH)2/NF, Ni/NF
Figure S1 shows the XRD patterns of Ni(OH)2/NF, Ni/NF, Obviously, the
diffraction peaksat 33.1°, 59.1° and 72.7° are indexed to the (100), (110) and (201) of Ni(OH)2 (JCPDS No. 14-0117). The peaks at 44.5°, 51.8°, 76.6° are belonged to
(111), (200), (100) of Ni (JCPDS No. 04-0850), which are from NF.
20 30 40 50 60 70 80 (2 01 ) (1 10 ) (1 00 ) Ni(OH)2/NF JCPDS No. 14-0117 JCPDS No. 04-0850 NF In te n si ty ( a. u .) 2θ (degree) 30 40 50 60 70 80 (1 00 ) (2 00 ) (1 11 ) JCPDS No. 04-0850 In te n si ty ( a. u .)
2θ (degree)
Ni / NFⅡ SEM images of bare Ni foam, Ni3N/NF, Ni(OH)2/NF, Ni/NF
Figure S2(a) displays the SEM image of bare NF, indicating the surface is smooth.
The SEM images of Ni(OH)2/NF (Figure S2(b)) reveals the gracile nanowire arrays
grow uniformly on NF. Figure S2(c) showed the SEM image of Ni/NF, it is clearly the distribution of Ni is fluffy and flexible. Figure S2(d) reflects the SEM image of the Ni3N/NF. We can see that the entire surface of NF is evenly covered by Ni3N.
Figure S2. (a) SEM image of bare Ni foam. (b) SEM image of Ni/NF. (c) SEM
Ⅲ LSV curves of Ni3N/NF in 1.0 M KOH with different urea concentration
In order to optimize catalytic performance of UOR, we conducted the LSV of Ni3N/NF in 1.0 M KOH with different urea concentration (from 0.1 to 0.6 M urea). Obviously, the potential of Ni3N/NF is the lowest in 1.0 M KOH containing 0.5 M
urea at the same current density. Therefore, the urea concentration of 0.5 M was chosen for the electrochemical test of UOR.
1.2 1.3 1.4 1.5 1.6 1.7 0 100 200 300 400 500
C
ur
re
nt
d
en
si
ty
(
m
A
·c
m
-2)
Potential
(
V vs.RHE
)
1 M KOH + 0.1 M Urea 1 M KOH + 0.2 M Urea 1 M KOH + 0.3 M Urea 1 M KOH + 0.4 M Urea 1 M KOH + 0.5 M Urea 1 M KOH + 0.6 M UreaFigure S3. LSV curves of Ni3N/NF in 1.0 M KOH with 0.1, 0.2, 0.3, 0.4, 0.5 and 0.6
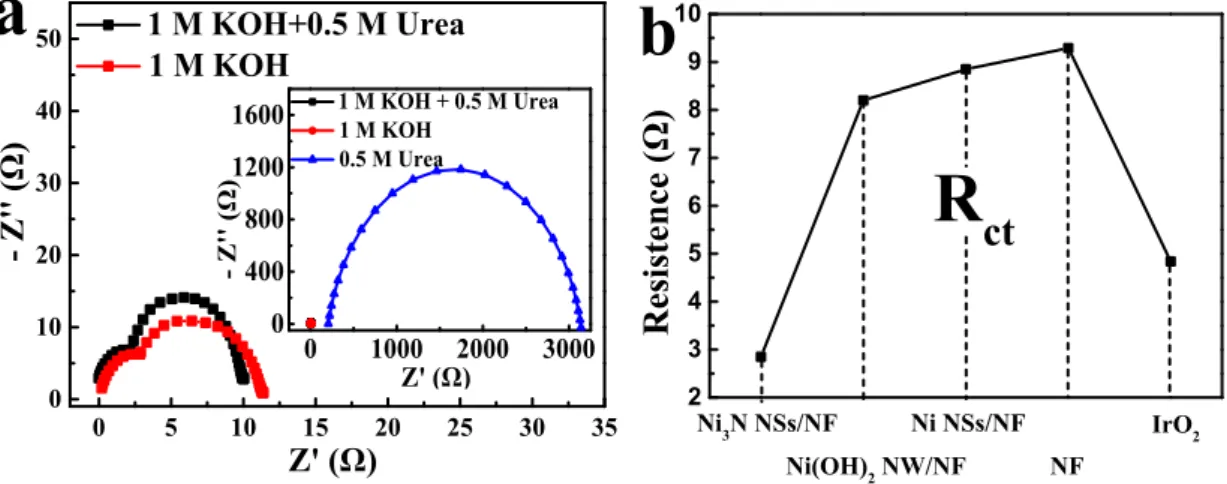
Ⅳ Nyquist plots of Ni3N/NF, Ni(OH)2/NF, Ni/NF, bare NF and IrO2
Figure S4(a) shows Nyquist plots of Ni3N/NF in different electrolytes. Apparently,
the conductivity of 1 M KOH with 0.5 M urea is better than 1 M KOH and 0.5 M urea. This implies Ni3N/NF have faster electron transfer rate in 1 M KOH with 0.5 M
urea. Furthermore, the conductivity of the prepared materials was measured. Figure
S4(b) indicates the Rct of Ni3N/NF, Ni(OH)2/NF, Ni/NF, bare NF and IrO2 are
corresponded to 2.85 Ω, 8.2 Ω, 8.85 Ω, 9.29 Ω and 4.84 Ω. Obviously, the Rct of
nanophere Ni3N/NF is the lowest. So, Ni3N/NF has faster electron transfer rate than
other prepared catalysts.
0 5 10 15 20 25 30 35 0 10 20 30 40 50
a
0 1000 2000 3000 0 400 800 12001600 1 M KOH + 0.5 M Urea1 M KOH
0.5 M Urea - Z '' ( Ω ) Z' (Ω) 1 M KOH+0.5 M Urea 1 M KOH - Z '' ( Ω ) Z' (Ω) 2 3 4 5 6 7 8 9 10
b
R es is te n ce ( Ω ) IrO2 NF Ni NSs/NF Ni(OH)2 NW/NF Ni3N NSs/NFR
ct
Figure S4. (a) Nyquist plots of Ni3N/NF in different electrolyte. (b) Rct of Ni3N/NF,
Ⅴ XRD pattern and XPS spectra of Ni3N/NF after 3000 cycles
Figure S5(a) and Figure S5(a*) shows XRD pattern of Ni3N/NF after 3000 cycles
in HER and UOR, respectively. Obviously, the peaks are almost the same as those before 3000 cycles, matches well with the standard cards. Meanwhile, XPS spectras of Ni 2p, and N 1s for Ni3N/NF after 3000 cycles are almost the same as those before
3000 cycles (Figure S5(b, c) and Figure S5(b*, c*)). SEM images of Ni3N/NF after
3000 cycles in HER and UOR, respectively also maintain the same appearance as before 3000 cycles (Figure S5(d) and Figure S5(d*)). These results indicate Ni3N/NF has an excellent stability.
30 40 50 60 70 80 After 3000th cycle in HER
Ni3N (JCPDS No. 10-0280) Ni (JCPDS No. 04-0850)
a
In te n si ty ( a. u .) 2θ (degree) 30 40 50 60 70 80a*
After 3000th cycle in UORIn te n si ty ( a. u .) 2θ (degree) Ni (JCPDS No. 04-0850) Ni3N (JCPDS No. 10-0280) 880 870 860 850 After 3000th cycle in HER
N i-N N i-N
b
In te n si ty ( a. u .)Binding Energy (eV) Ni 2p
880 870 860 850
Ni 2p
After 3000th cycle in UOR
b*
N i-N N i-N In te n si ty ( a .u .)Binding Energy (eV)
405 402 399 396 After 3000th cycle on HER N 1s
c
N-O Ni-N In te n si ty ( a. u .)Binding Energy (eV)
404 400 396
N 1s
After 3000th cycle on UOR
c*
Ni-N N-O In te n si ty ( a. u .)Binding Energy (eV)
Ⅵ STEM-EDX mapping images ofNi3N/NF
Figure S6 shows the STEM-EDX mapping images of Ni3N/NF. We found that the
N elements are evenly distributed, while the nickel elements are more densely. It implies Ni3N is grown on nickel foam.
Figure S6. (a) STEM-EDX mapping images of Ni3N/NF. (b) element mapping of
Ⅻ CV curves of Ni3N/NF, Ni(OH)2/NF, Ni/NF
Figure S7 shows CV curves of Ni3N/NF, Ni(OH)2/NF, Ni/NF, respectively, in the
non-faradic potential region (1.007 V to 1.147 V) at different scan rates (from 5 to 50 mV·s-1). Figure S7(d) and Figure S7(f) indicate the C
dl at 1.077 V is 4.5 and 2.3
mF·cm-2 for Ni(OH)
2/NF and Ni/NF, respectively. They are all lower than that of
Ni3N/NF (6.45 mF·cm-2) (Figure S7(b)). The results show the surface roughness of
Ni3N/NF is higher than the precursors.
1.02 1.05 1.08 1.11 1.14 -0.4 0.0 0.4 5 mV·s-1 50 mV·s-1 C ur re nt d en si ty (m A ·c m -2 ) Potential (V vs.RHE)
a
0 10 20 30 40 50 0.0 0.2 0.4 0.6 6.45 mF·cm-2 j ( m A ·c m -2 ) Scan rate (mV·s-1)b
Ni3N/NF 1.02 1.05 1.08 1.11 1.14 -0.4 0.0 0.4 5 mV·s-1 50 mV·s-1 C ur re nt d en si ty (m A ·c m -2 ) Potential (V vs.RHE)c
0 10 20 30 40 50 0.0 0.2 0.4 4.5 mF·cm-2 Ni(OH)2/NFd
j ( m A ·c m -2 ) Scan rate (mV·s-1) 1.04 1.08 1.12 -0.1 0.0 0.1 0.2e
50 mV·s-1 5 mV·s-1 C ur re nt d en si ty ( m A ·c m -2 ) Potential (V vs.RHE) 0 10 20 30 40 50 0.0 0.1 0.2 2.3 mF·cm-2 Ni/NFf
j ( m A ·c m -2 ) Scan rate (mV·s-1)Ⅷ Comparison of electrochemical performance of Ni3N/CC cell in the literature
So far, only one used nickel nitride for urea electrolysis.1 The nickel nitride on
carbon cloth was synthesized (Ni3N/CC) in that literature and its electrochemical
performance has been compared. Obviously, the cell voltages of Ni3N/NF cell we
prepared is much lower to that of Ni3N/CC cell. It implies the catalytic activity of
Ni3N/NF cell is far superior to that of Ni3N/CC cell.
1.2 1.3 1.4 1.5 1.6 1.7 1.8 1.9 100 50 20 V ot al ge ( V )
Current density
(
mA·cm
-2)
Ni
3N/NF cell
Ni
3N/CC cell
10
Ⅳ Comparison of catalytic performance of some UOR catalysts in recent years
Comparing the catalytic performance of catalysts for UOR in recent years. Obviously, we can discover that the potential of the materials we prepared are lower than that of the most of UOR catalysts. This implies Ni3N/NF has superior catalytic
activity and greater commercial possibilities.
Table S1. Comparison of the UOR activity for several recently reported catalysts.
Catalyst Potential at 10 mA·cm-2(V vs· RHE) Mass loading(mg·cm-2) Reference Ni3N/NF 1.34 0.075 This work Ni3N NA/CC 1.35 1.9 1 Ni2P/NF 1.37 0.92 2 Ni(OH)2 nanotube-NF 1.41 - 3
NiO nanosheet array 1.38 0.27 4
ERGO-Ni 1.45
-Graphene Ni(OH)2 1.52 0.25
5
NiCo alloy 1.53 10 6
NiMo sheet array 1.37 0.75 7
L-MnO2 1.37 1.5 8 Ni(OH)2 nanocube 1.55 0.3 9 Rhodium-Ni 1.47 0.7 10 Nickel film 1.48 1.3 Nickel nanowire 1.44 1.3 11 Ni foil 1.40 2 Rh-Ni 1.44 2 12
Ⅹ Comparison of the performance of as-prepared catalysts in this work
Comparing the performance of the catalysts prepared in this paper. It is clear that the performance of Ni3N/NF has exceeded Pt/C. This means it has a high probability of becoming a substitute for precious metals.
Table S2. Comparison of the performance of the catalysts in this study
Ni3N/NF 10mA·c m-2 100mA·c m-2 200mA·c m-2 Tafel slope/ mV·dec-1 UOR(vs· RHE) 1.340V 1.403V 1.476V 41 OER(vs· RHE) 1.580V 1.760V / 102 HER(vs· RHE) 120mV 243mV 335mV 110 Ni(OH)2/NF UOR(vs· RHE) 1.352V 1.43V 1.516V 50 HER(vs· RHE) 138mV 336mV / 180 Ni/NF
References
(1) Liu, Q.; Xie, L.; Qu, F.; Liu, Z.; Du, G.; Asiri, A. M.; Sun, X. Porous Ni3N
Nanosheets Array as a High-Performance Nonnoble-Metal Catalyst for Urea-Assisted Electrochemical Hydrogen Production.Inorg. Chem. Front. 2017, 4, 1120-1124.
(2) Liu, D.; Liu, T.; Zhang, L.; Qu, F.; Asiri, A.; Sun, X. High-Performance Urea Electrolysis Towards Less Energy-Intensive Electrochemical Hydrogen Production Using a Bifunctional Catalyst Electrode. J. Mater. Chem. A 2017, 5, 3208-3213. (3) Ji, R.; Chan, D.; Jow, J.; Wu, M. Formation of Open-Ended Nickel Hydroxide Nanotubes on Three-Dimensional Nickel Framework for Enhanced Urea Electrolysis,
Electrochem. Commun. 2013, 29, 21-24.
(4) Wu, M.; Lin, G.; Yang, R. Hydrothermal Growth of Vertically-Aligned Ordered Mesoporous Nickel Oxide Nanosheets on Three-Dimensional Nickel Framework for Electrocatalytic Oxidation of Urea in Alkaline Medium. J. Power Sources 2014, 272, 711-718.
(5) Wang, D.; Yan, W.; Vijapur, S.; Bottte, G. Electrochemically Reduced Graphene Oxide–Nickel Nanocomposites for Urea Electrolysis. Electrochim. Acta 2013, 89, 732-736.
(6) Xu, W.; Zhang, H.; Li, G.; Wu, Z. Nickel-Cobalt Bimetallic Anode Catalysts for Direct Urea Fuel Cell. Sci. Rep. 2014, 4, 58-63.
(7) Liang, Y.; Lin, Q.; Asiri, A.; Sun, X. Enhanced Electrooxidation of Urea Using NiMoO4·xH2O Nanosheet Arrays on Ni Foam as Anode. Electrochim. Acta 2015,
153, 456-460.
(9) Wu, M.; Ji, R.; Zheng, Y. Nickel Hydroxide Electrode with a Monolayer of Nanocup Arrays as an Effective Electrocatalyst for Enhanced Electrolysis of Urea.
Electrochim. Acta 2014, 144, 194-199.
(10) Miller, A.; Hassler, B.; Botte, G. Rhodium Electrodeposition on Nickel Electrodes Used for Urea Electrolysis. J. Appl. Electrochem. 2012, 42, 925-934. (11) Yan, W.; Wang, D.; Diaz, L.; Botte, G. Nickel Nanowires as Effective Catalysts for Urea Electro-Oxidation. Electrochim. Acta 2014, 134, 266-271.
(12) King, R.; Botte, G. Investigation of Multi-Metal Catalysts for Stable Hydrogen Production Via Urea Electrolysis. J. Power Sources 2011, 196, 9579-9584.