Science Arts & Métiers (SAM)
is an open access repository that collects the work of Arts et Métiers Institute of
Technology researchers and makes it freely available over the web where possible.
This is an author-deposited version published in: https://sam.ensam.eu
Handle ID: .http://hdl.handle.net/10985/8928
To cite this version :
Fawaz MASSOUH, Ivan DOBREV - Investigation of wind turbine flow and wake - Journal of Fluid Science and Technology - Vol. 9, n°3, p.1-9 - 2014
Any correspondence concerning this service should be sent to the repository Administrator : archiveouverte@ensam.eu
Investigation of wind turbine flow and wake
Fawaz MASSOUH* and Ivan DOBREV*
* DynFluid Lab., Arts et Metiers ParisTech 151 Boulevard de l'Hopital, 75013 Paris, France
E-mail: fawaz.massouh@ensam.eu
Abstract
This paper is dedicated to the investigation and analysis of wind turbine wake. An experimental work is undertaken in wind tunnel on a horizontal axis wind turbine model. The velocity field in the wake is measured using PIV with phase synchronization in order to relate velocity and vortices to the rotating blades. The tip vortices are investigated in successive azimuthal positions of the rotor. A specially developed algorithm based on the circulation maximum detects the positions of the vortex cores and permits to use conditional averaging technique. The analysis of obtained velocity fields enables to determine the vortex core diameter, the swirl velocity distribution and the vortex diffusion as functions of the vortex age. The quality of obtained results permits to use them as reference for the validation of numerical computations.
Keywords : Wind Turbine, Wake, PIV, Vortex, Wind Energy
1. Introduction
This work concerns the investigation and analysis of wind turbine wake. In order to minimize the costs of energy production, the wind turbines are generally grouped in farms. Frequently, the distance between the machines is reduced and so the aerodynamic interference becomes significant, especially when a given wind turbine operates in the wake of another. Generally, it is supposed that after a distance of 7 times the rotor diameter the influence of upstream wake on power generation becomes less than 10%. However, this distance varies significantly if the turbines are installed in complex terrain or when the wind turbulence is different from the usual case. In these situations, an investigation of flow downstream of the wind turbine will be particularly helpful. The results of such investigations permit to obtain an optimal placement of wind turbines in the wind farm and to avoid operating of some wind turbines in the wake of the others.
The wake behind the wind turbine rotor is due to kinetic energy extraction but also to blades and hub drag. There are two distinct regions in the wake: the near wake, immediately behind the rotor, where the individual presence of each rotor blade can be observed, and the far wake where the large-scale vortex structures become dominant. To understand the far wake development, it is necessary to have a good knowledge of the near wake structure immediately behind the rotor. The flow in the near wake is dominated by blade-tip vortices. These tip vortices play a significant role in wake meandering and diffusion. Emanated from blade tips, they remain close to the rotor and produce a very complex velocity field with high gradients. These vortices are also a major source of unsteadiness, aerodynamic noise and aerodynamic interaction. Therefore, it is important to investigate the vortex trailed from blade tip in order to gather comprehensive information about vortex intensity, swirl velocity distribution and vortex diffusion depending on vortex age. After a certain distance from the rotor, tip vortex breakdown occurs and then the wake becomes highly turbulent with irregular vortex structures.
The particle image velocimetry (PIV) is a non-intrusive method that can measure the instantaneous velocity vector field in a plane. Thus, few researchers used PIV technique for the analysis of wind turbine wake and obtained rather qualitative results. Here we might mention the papers presented by (Smith, et al., 1991), (Grant and Parkin, 2000), (Maeda, et al., 2005), (Massouh and Dobrev, 2007) and (Snel, et al., 2007). More recent studies are presented by
(Sherry, et al., 2013), (Xiao, et al., 2011) and (Zhang, et al., 2012).
2. Study of near wake
The objective of this part of study is to investigate the near wake of the horizontal axis wind turbine while its tip-speed ratio (TSR) varies. TSR is defined as the ratio between the peripheral velocity U and upstream velocity V∞:
U
V
TSR
/
(1)Experiments are conducted in the wind tunnel of Arts et Métiers-ParisTech. This wind tunnel is a closed-circuit type and has a three-blade axial fan with a rotor diameter of 3m. The fan is driven by a frequency-controlled asynchronous motor and the flow velocity can reach 40 m/s. The nozzle between the settling chamber and the test section has a contraction ratio of 12.5. This ratio ensures a uniform velocity profile and a turbulence ratio less than 0.25%. The semi-guided test section of the wind tunnel has a cross-section of 1.35 m x1.65 m and a length of 2 m. The static pressure in the test section is equal to atmospheric pressure. Hence, the upstream velocity only depends on the stagnation pressure in the settling chamber.
The horizontal axis wind turbine used in the experiments has a three-blade rotor with a diameter of 500 mm. The tapered blade has a root chord of 65 mm and a tip chord of 45 mm. The blade is non-twisted, straight and the pitch angle is 10°. The blade section is a proprietary non-symmetric airfoil with a thickness of 14%. The rotor hub diameter is 0.27D, the nacelle diameter is only 0.08D and its length is relatively important 1.2D. The choice of such length is specially made to displace the wind turbine mast away from the rotor plane and thus to avoid that it perturbs the near vortex wake behind the rotor.
The rotor is mounted on a shaft which is coupled with a DC generator with the rotor load controlled by a rheostat connected to the generator. A fiber-optic sensor is used to detect a reflective target fixed on the rotor shaft and thus to obtain a reference signal that informs about each blade pass. By counting the number of signals delivered by the torque-meter, after the passage of the reference signal, it is possible to obtain the rotor's angular position with an accuracy of 1°. Data acquisition is obtained using a data acquisition card that emits a TTL signal for triggering the PIV measurements at the desired angular position.
Figure 1 Wind turbine test bench
During experiments, the upstream flow velocity V∞ is maintained constant at 9.3 m/s, while the wind turbine
rotational speed varies from 1300 rpm to 1800 rpm. Thus, the Reynolds number calculated with blade-tip-chord and tip-peripheral velocity U, varies roughly between 110,000 and 150,000.
laser, two cameras of 2048x2048 px equipped with the lens (Micro-Nikkor AF-S 105 mm f/2.8G IF-ED) and a system which synchronizes both image sensors and laser flashes with the blade angular position. The flow is seeded with micro-droplets of olive oil 2-5 m of diameter, created by a mist generator.
The study is carried out for TSRs of 3.79, 4.34 and 5.16 corresponding to 1300 rpm, 1500 rpm and 1800 rpm respectively. A series of 500 pairs of images is taken from two cameras for each rotational speed. The blade tip is targeted by the first camera and the blade root is targeted by the second. The image capture is synchronized with the rotor position so the PIV system is triggered when the reference blade is positioned at the desired angular position, in this case when the reference blade is vertical. The laser sheet passes through the rotor axis and the axis of the reference blade.
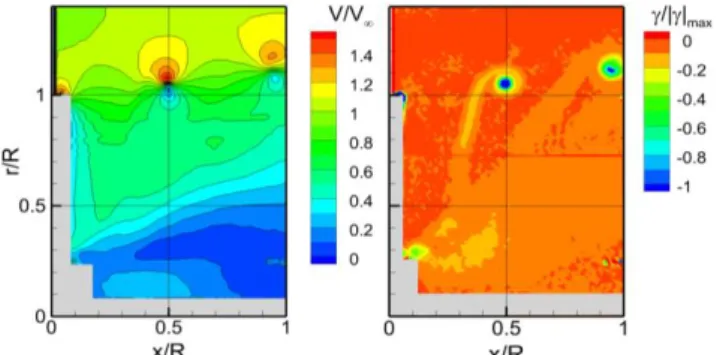
The PIV region of interest is shown in Fig. 1. In this study, the yaw angle Ψ is zero. Taking into account the frequency of the camera (7 Hz) the images are taken once every five or six revolutions. For each pair of images, the time delay between the first and second image is set to 40s. This value has been established experimentally to ensure the best cross-correlation. The cross-correlation is applied to interrogation windows of 32x32 pixels and a 50% overlap, which results in a spatial resolution of 1.92 mm. Finally, the treatment of all PIV images permits to constitute a database including instantaneous and average velocity fields for each of the three rotational velocities. Averaged flow and vorticity fields for the 0° azimuth position are presented in Fig. 2 - Fig. 4. The analysis of flow downstream of the rotor reveals the wake’s development. The left images of Fig. 2 - Fig.4 show the dimensionless average velocity field and the right images show the average vorticity field for the different rotational velocities. In these figures, the plane of exploration passes through the axis of rotation, where the reference blade is vertical. Velocity field shows that the positions of the tip vortices are located where the velocity varies rapidly in the radial direction with a high gradient. These experimental results show that at the core center of the vortex, the velocity varies with radius from values close to zero to values significantly higher than the upstream velocity.
The tip vortices trailing from the blades move with the fluid and as consequence, they have a helical shape. The plane of investigation cuts through these helixes and shows the vortex core as high velocity gradient. The first vortex represented on the left side of the images corresponds to the reference blade tip. The next one is emitted from the previous blade and has a vortex age of 120°. Here the vortex age is defined as the azimuth travel of the blade since vortex creation. It is obvious to observe on velocity field that the tip vortices govern the wake flow and divide it i nto two regions: an internal zone, where the wake is restrained and slowed by the tip vortices, and an external zone corresponding to a less-perturbed free flow.
The right images of Fig. 2 - Fig. 4 show that the vortex sheet trailing from the blade roll-up, with the highest vorticity concentrated at the tip vortex. The tip vortices with high negative values are represented as blue circles. These negative values correspond to vortices turning in the clockwise direction, as intended for a wind turbine.
The velocity induced by these vortices is added to the free stream velocity and as a result, the flow in the external zone is accelerated. Conversely, in the internal zone, these vortices induce a flow in the opposite direction of the free stream flow, and thus the flow is decelerated. This deceleration becomes more significant at points close to the tip vortices. Downstream of the rotor, the helical vortices decelerate the internal flow and thus the wake diameter increases gradually and becomes constant after a distance of one or more rotor diameters. The vorticity field measurements show also that the wake diameter increases with increasing rotational velocity.
Massouh and Dobrev, Journal of Fluid Science and Technology, Vol.00, No.00 (2014)
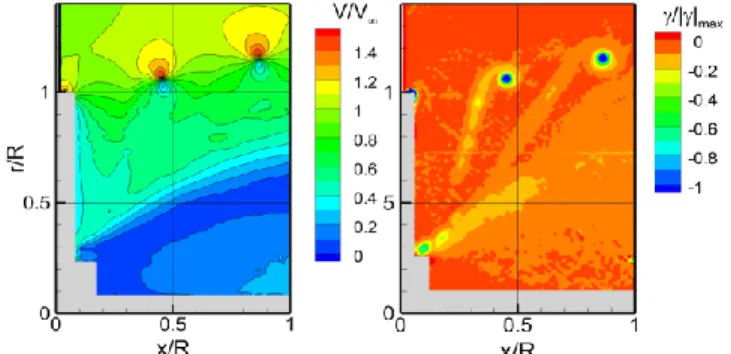
Fig. 3 Average velocity (left) and vorticity field (right), 1500rpm.
Figure 4 Average velocity (left) and vorticity field (right), 1800rpm.
3. Study of tip vortices
The objective of this part of the study is to investigate the structure of the tip vortices. These vortices are inevitable when fixed or rotating lifting surfaces are present in the flow. Often, for aeroelasticity analysis of the rotors, the free wake method is used. To improve this method, the potential vortex line needs to be replaced by a real vortex tube, which permits to overcome the singularity of the vortex line, (Leishman, et al. 2002). Additionally, the calculation of induced velocity is more realistic, because viscous diffusion of vorticity can be taken in account. Therefore, it is important to investigate the vortex issued from blade tip and to gather comprehensive information about the characteristics of tip vortex. The most important characteristics are vortex intensity, swirl velocity distribution, maximum of tangential velocity and the radius of vortex core as functions of vortex age.
In order to study the variation of vortex characteristics due to vortex age, an additional experimental investigation is engaged. During these experiments, the upstream velocity 9.3 m/s is maintained similarly to the previous cases, but the taken rotational velocity is lower, 1000 rpm. This rotational velocity permits to obtain a larger pitch of the helical vortices in comparison with higher rotational velocities. As a result, the vortex instability due to mutual inductance appears much later downstream of the wake. The exploration of flow downstream the rotor is carried out in four azimuth planes with angles 0°, 30°, 60° and 90º. Here, the plane of 0° corresponds to the vertical position of the reference blade. Due to limitation of the camera resolution, it is not possible to obtain with sufficient precision a velocity field larger than 300 mm. To widen the area of investigation, the total velocity field is divided into six windows (3 horizontal by 2 vertical) with some overlapping, Fig. 1. The scale of windows and their relative positions are defined using calibration markers placed in known positions inside the investigated area.
For each explored window, the imagery is repeated 95 times and in total, four series of 6 by 95 pairs of images are acquired for different planes with azimuth angles of 0°, 30°, 60° and 90º. Statistical processing of the raw images is carried out by means of MatPIV developed by (Sveen, 2004). The “multi-pass” algorithm with 3 passes is applied, the final size of interrogation window is 32x32 pixels and the overlapping is 75%. The instantaneous velocity fields, resulting from each time series of 95 captured images, are used to obtain the average fields in each one of the investigated windows. In addition, the processing of the calibrating images makes it possible to obtain the scale constants, the true velocity and the position of each window relatively to the rotor. In this manner, the fields of instantaneous and averaged velocity are calculated for each window.
Massouh and Dobrev, Journal of Fluid Science and Technology, Vol.00, No.00 (2014)
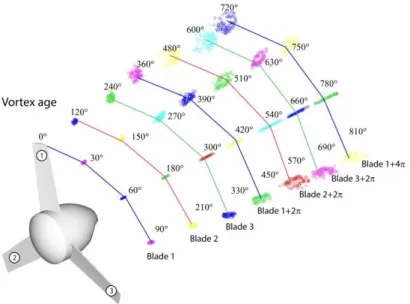
rotor. Thanks to the phase synchronization of measurements, it is possible to observe the intersection of azimuth planes with the tip vortices emitted by blade tips. The obtained data makes it possible to track the helical tip vortices in the rotor wake, Fig. 5.
Fig. 5 Vortex center positions.
Regardless of their origins, strong vortices are similar. Despite their very complex nature, vortices can be represented by simple, but effective models. These models are specified in terms of 2-D tangential velocity profiles. Usually, radial and axial velocities in the vortex core are small compared to tangential velocity and therefore these may be neglected. The vortex is divided into two parts: inner and outer. The inner part, where viscous forces are predominant, is rotated as a rigid body, and at the vortex center the tangential velocity tends to zero. In the outer part, the tangential velocity decreases similarly to the velocity induced by the potential vortex. The radius where the tangential velocity reaches a maximum Vmax is known as vortex core radius rc. The laminar vortices are studied
extensively and there are different vortex models based on the simplified solutions of Navier-Stokes equations for laminar flow, like the solutions proposed by Rankine, Lamb, Oseen or Burgers. Compared with real tip vortices in wind turbine aerodynamics, where flow is turbulent, there are some discrepancies. In case of turbulent flow, for the same vortex core radius and peak tangential velocity, the decreasing of velocity is smaller compared to the case of laminar flow. To get a better approximation, (Vatistas, 2006) proposed the following velocity distribution as a function of radial coordinate r: m
r
V
r
V
max 41
)
(
(2)where m=(α+1)/4 and
r
= r/rc. In this formula, the parameter represents the level of turbulence. The case of =1represents laminar velocity profile, but with increasing turbulence intensity, the value of diminishes. Studying the experimental data obtained for helicopter rotors, (Vatistas, 2006) shows that the value =0.75 represents reasonable tangential velocity profile of blade tip vortices. However, the flow downstream a wind turbine is quite different from the case of helicopter. In fact, the flow is decelerated downstream the wind turbine rotor whereas it is accelerated downstream the helicopter rotor. It must also be noted that the angle of attack along the wind turbine blade is higher than in the case of helicopter blade. In the studied wind turbine, the inner blade sections usually operate at angle of attack close to the stall angle, especially at the root. In the case of separation, the detached flow turns with the blade and the centrifugal force creates radial flow along the blade. This radial flow increases the boundary layer thickness in the outer blade sections despite their optimal angle of attack. Therefore, the boundary layer at blade extremity is thicker compared to the case of helicopter blade, studied by (Bhagwat, et al. 2000). As large part of this thick boundary layer is rolled up into tip vortex, the vortex characteristics become different from the helicopter case. Therefore, we need to obtain data about vortex parameters and vortex decaying in the case of wind turbine.
Massouh and Dobrev, Journal of Fluid Science and Technology, Vol.00, No.00 (2014)
Fig. 6 Absolute value of circulation distribution.
To calculate vortex characteristics, it is necessary to identify the vortex center. There are different methods of obtaining the vortex core centers in the investigated velocity field. The simplest method is to calculate vorticity and then to identify the nodes with maximum vorticity as the vortex core centers. The more sophisticated methods are based on eigenvalues of the velocity gradient tensor and the discriminant of the characteristic equation, (van der Wall and Richard, 2006). However, to calculate all these characteristics we need to evaluate velocity derivatives. Unfortunately, the derivatives calculation using experimental data is not always satisfactory. Due to centrifugal forces in the vicinity of vortex core, the quantity of seeding particles is not sufficient and the obtained velocity field is noisy. The numerical estimation of derivatives amplifies the noise in the data and decreases the accuracy of results and as consequence it is very difficult to find the vortex center. To circumvent this problem and to improve the identification of vortex center, we prefer in this work to use detection based on circulation calculation (Agrawal and Prasad, 2002). Thus, around each node i, j of velocity field the circulation is calculated. The path of integration is a circle with a radius
rg slightly greater than the approximate radius of the vortex tube and includes almost whole the vorticity:
g r j iv
d
l
, (3)The integration path is corrected if needed and the velocity on interpolation curve is obtained by means of kriging. When the center of the circle coincides with a vortex core, the integral reaches an extreme value. In the others cases, the integration path does not include whole vorticity and the circulation value is lower. Therefore, we just need to find the point where the circulation reaches a maximum in order to obtain the vortex center. To circumvent the interpolation of velocity, it is possible to replace the circle with the closest polygon, but in fact, the obtained results are quite similar.
Fig. 7 Normalized tangential velocity induced by the tip vortex.
Massouh and Dobrev, Journal of Fluid Science and Technology, Vol.00, No.00 (2014)
vortex, but also the surface area free of vorticity. As a result, the value of circulation for several adjacent points will be the same and the maximum value cannot be identified. Contrarily, if the radius is too small, then the integration path includes only a part of the tube vorticity and thus the circulation values are comparable and the peak is not cle arly distinguished. In practice, some numerical experiments are needed to find the optimum radius of integration.
The results for circulation calculation are presented in Fig. 6, where the field of circulation is superposed with the wind turbine rotor. Here, the vortex core center is easily distinguished. In fact, the circulation calculated for the node coinciding with core center is sufficiently greater than circulation in the nearest nodes. It must be noted that the negative influence of spurious vectors is less pronounced compared to the methods which use derivatives and it is easier to find the vortex center for all exploration windows.
Fig. 8 Coefficient α in Vatistas vortex model as a function of vortex age.
Using the proposed method, the vortex centers are obtained for all velocity fields. The calculation results for all windows are presented in Fig. 5. Here we can see that vortex wandering increases significantly downstream the rotor. It must be noted that the vortex wandering is greater compared with wing tip vortex wandering. The study presented in (Okulov and Sørensen, 2007) shows that this unsteadiness is due to helical vortex instability. Moreover, the inner parts of wind turbine blades, operate at significant angles of attack and the flow is close to stall or stalled. In this case the blade section lift varies and therefore circulation varies permanently along the inner part of blades and downstream of rotor. Because of bounded vorticity variation, the free vorticity trailed from blades varies too. Hence, tip vortices intensity and vortex cores positions vary permanently. The vortex wandering was already observed in the case of wind turbine rotor; see (Grant and Parkin, 2000).
Fig. 9 Tip vortex circulation as a function of vortex age.
In this study, the smearing effect on averaged velocity field caused by vortex wandering is eliminated by means of conditional averaging method. Thus, all vortex parameters are averaged according to vortex center and the variation of circulation as a function of radius for each vortex center is calculated by:
Massouh and Dobrev, Journal of Fluid Science and Technology, Vol.00, No.00 (2014)
r
V
r
)
2
(
(4)It is not easy to compare the blade trailing vortex directly with Vatistas model. The circulatory part of velocity is not symmetric around the vortex center, because blade vortices have helical-like shape whereas wing-trailing vortices are 2-D. For this reason, the tangential velocity in Vatistas formula is presented by related averaged tangential velocity, expressed by the following equation:
r
r
V
avg
(
)
/
2
(5)To generalize the velocity profile, the averaged tangential velocity is presented in dimensionless form. The tangential velocity is divided by the corresponding peak tangential velocity Vmax and the presented results vary as a
function of dimensionless radius
r
= r/rc. The obtained velocity profiles are presented in Fig. 7 and show a goodsimilitude.
The value of the coefficient for tangential velocity equation is found by means of least square method and results are shown in Fig. 8, where we can see the variations of as a function of vortex age. Generally, the value of is lower than 0.75, obtained by Vatistas. Thus, in the case of wind turbine rotor, the turbulence intensity is larger and the tangential velocity decreases slowly when compared to helicopter.
Fig.10 Peak tangential velocity as a function of vortex age
Other important characteristics of vortex are circulation decay and peak tangential velocity decrease as functions of vortex age. These are presented in dimensionless form in Fig. 9 and Fig. 10 respectively. The tangential velocity is divided by blade tip velocity ΩR and the rotor circulation is divided by ΩR2, where Ω is the angular velocity and R is
the rotor radius. It must be noted that for two turns, due to viscosity dissipation, peak velocity and circulation decrease concurrently by more than 20%. As results the vortex core radius, which depend on the ratio of the circulation and peak tangential velocity, varies insignificantly with vortex age, contrary to results presented by (Bhagwat, et al. 2000). The vortex core diameter is in the order of 15%-20% of the chord length. The fact that vortex core does not increase as in the case of helicopter rotor is due also to the vortex stretching.
6. Conclusion
This paper presents PIV investigation in wind tunnel in the case of a horizontal axis wind turbine model. The synchronization of PIV measurements with the azimuth position of blades permits the visualization of flow in a reference frame relative to the rotor. To widen the measured field, the investigation is undertaken in 6 adjacent windows with some overlap. The analysis of results makes it possible to obtain the velocity and vortices in the full plane. The data acquisition in successive azimuthal planes enables to study the 3D development of tip vortices. The results show that the vortices resulting from the blade tips are not located on a cylindrical surface as it is assumed in the linear propeller theory. In fact, they expand in the radial direction and thus the diameter of the wind turbine flow tube increases. Specially developed algorithm that uses circulation value as criteria permits to determine the positions of the vortex cores in the PIV investigated planes. Hence, the helical pitch and the radial position of the tip vortices core could be localized. As in other studies, the vortex wandering has been observed and vortex cores positions were changing
Massouh and Dobrev, Journal of Fluid Science and Technology, Vol.00, No.00 (2014)
permanently. Conditional averaging is used to eliminate the wandering effect and thus comprehensive information is obtained for the most important characteristics of the tip vortex.
The analysis of vortex characteristics permits to express the vortex core diameter, the swirl velocity distribution and the vortex diffusion as functions of the vortex age. It is found that the obtained data are quite different from those obtained for model helicopter rotor. The vortex core radius is greater as compared to helicopter rotor, but remains constant with the vortex age and the tangential velocity decreases slowly. However, for further studies, it will be interesting to study the effect of upstream turbulence on vortex characteristics. Finally, it must be noted that the quality of the obtained results permits their use as a reference for validation of CFD codes related to flow prediction in the wake of wind turbine rotors. In addition, they can be helpful for viscous corrections, when needed, in free vortex methods.
References
Agrawal, A. and Prasad, A., Properties of vortices in the self-similar turbulent jet, Experiments in fluids, vol. 33, No 4 (2002), pp. 565-577.
Bhagwat, M., Leishman, J.G., Correlation of Helicopter Rotor Tip Vortex Measurements, AIAA Journal, Vol. 38, No. 2 (2000), pp. 301-308.
Grant, I. and Parkin, P., A DPIV study of the trailing vortex elements from the blades of a horizontal axis wind turbine in yaw, Experiments in Fluids, Vol. 28, No.4 (2000), pp. 368-376.
Leishman, J.G., Bhagwat, M. and Bagai, A., Free-Vortex Filament Methods for the Analysis of Helicopter Rotor Wakes, Journal of Aircraft, Vol. 39, No 5 (2002), pp.759-775.
Maeda, T., Kinpara, Y. and Kakinaga, T., Wind tunnel and field experiments on wake behind horizontal axis wind turbine, Transactions of the Japan Society of Mechanical Engineers, Vol. 71, No. 701 (2005), pp. 162-170.
Massouh, F. and Dobrev, I. Exploration of the vortex wake behind of wind turbine rotor, Journal of Physics: Conference Series, Vol. 75, No. 1 (2007), p. 012036.
Okulov, V. and Sørensen, J., Stability of helical tip vortices in a rotor far wake, Journal of Fluid Mechanics, Vol. 576, (2007), pp. 1-25.
Sherry, M. Sheridan, J. and Lo Jacono, D., Characterisation of a horizontal axis wind turbine’s tip and root vortices, Experiments in Fluids, Vol. 54, Issue 3 (2013), 1417.
Smith, G.H., Grant, I., Liu, A., Infield, D. and Eich, T., The wind tunnel application of particle image velocimetry to the measurement of flow over a wind turbine, Wind Engineering , Vol. 15., No 6 (1991), pp. 301-317.
Snel, H., Schepers, J.G. and Montgomerie, B., The MEXICO project (Model Experiments in Controlled Conditions): The database and first results of data processing and interpretation, Journal of Physics: Conference Series, Vol. 75, No. 1 (2007), p. 012014.
Sveen, J. K., An introduction to MatPIV v.1.6.1, Department of Mathematics, University of Oslo, Mechanics and Applied Mathematics, Eprint No 2 (2004), ISSN 0809-4403.
van der Wall, B.G. and Richard H., Analysis methodology for 3C-PIV data of rotary wing vortices, Experiment in Fluids, Vol. 40, No. 5 (2006), pp. 798-812.
Vatistas, G., Simple Model for Turbulent Tip Vortices, Journal of Aircraft, Vol. 43, No.5 (2006), pp. 1577-1579.
Xiao, J.-P., Wu, J., Chen, L. and Shi, Z.-Y., Particle image velocimetry (PIV) measurements of tip vortex wake structure of wind turbine, Applied Mathematics and Mechanics, Vol. 32, Issue 6 (2011), pp. 729-738.
Yang, Z., Sarkar, P. and Hu, H., Visualization of the tip vortices in a wind turbine wake, Journal of Visualization, Vol. 15, No. 1 (2012), pp. 39-44.
Zhang, W., Markfort, C.D. and Porté-Agel, F., Near-wake flow structure downwind of a wind turbine in a turbulent boundary layer, Experiments in Fluids, Vol. 52, Issue 5, (2012), pp. 1219-1235.