Mputu et al. J Toxicol Risk Assess 2019, 5:030
Volume 5 | Issue 2
Journal of
Toxicology and Risk Assessment
Open AccessCitation: Mputu MLC, Ndelo JP, Ndelo MP, Marini RD, Lusakibanza MM, et al. (2019) Blood Lead, Uri-nary Lead and UriUri-nary δ-Aminolevulinic Acid Levels among Children Living in Kinshasa, D R Congo: A Pilot Biomonitoring Study. J Toxicol Risk Assess 5:030. doi.org/10.23937/2572-4061.1510030 Accepted: December 14, 2019: Published: December 16, 2019
Copyright: © 2019 Mputu MLC, et al. This is an open-access article distributed under the terms of the Creative Commons Attribution License, which permits unrestricted use, distribution, and reproduction in any medium, provided the original author and source are credited.
DOI: 10.23937/2572-4061.1510030
Blood Lead, Urinary Lead and Urinary δ-Aminolevulinic Acid
Levels among Children Living in Kinshasa, D R Congo: A Pilot
Biomonitoring Study
Mputu MLC
1*, Ndelo JP
1, Ndelo MP
1, Marini RD
2, Lusakibanza MM
3, Dubois N
4, Rozet
E
2, Le Brun P
2, Cimanga KR
5,6and Charlier C
41Faculty of Pharmaceutical Sciences, Laboratory of Toxicology and Food Hygiene, University of Kinshasa, Democratic
Republic of Congo
2Department of Pharmacy, Faculty of Pharmaceutical Sciences, Laboratory of Analytic Chemistry, University of Liège,
Belgium
3Faculty of Pharmaceutical Sciences, Laboratory of Pharmacology, University of Kinshasa, Democratic Republic of Congo 4Faculty of Pharmaceutical Science, Clinical, Forensic, Environmental and Industrial Toxicology Service, University of Liege,
Belgium
5Faculty of Pharmaceutical Sciences, Laboratory of Pharmacognosy, University of Kinshasa, Democratic Republic of Congo 6Department of Pharmaceutical Sciences, Laboratory of Natural Products and Food Analysis, University of Antwerp,
Belgium
*Corresponding author: Mputu Malolo Lievins-Corneille, Faculty of Pharmaceutical Sciences, Laboratory of Toxicology and Food Hygiene, University of Kinshasa, BP 212 Kinshasa XI, Democratic Republic of Congo
Abstract
Lead exists naturally in the earth’s crust and it is widely used as a heavy metal. It is an environment toxicant that may deleteriously affect nervous, hematopoietic, skeletal, renal, endocrine and reproductive systems. So, exposure to lead in the environment continues to be a serious public health problem for all ages. Children are particularly susceptible to lead poisoning. They absorb more lead from their envi-ronment and their developing central nervous systems are vulnerable to the toxic. Fifty percent of children aged from 0 to 17-years-old presented blood lead levels above 100 μg/L and forty three percent of the same population presented blood lead levels above 50 μg/L. There was no correlation between urinary lead level and D-ALAU (urinary δ-amino-levulinic acid) with lead blood levels. But it was observed a small correlation between urinary lead and blood lead con-centrations.
Keywords
Blood lead, Urinary lead, Urinary δ-aminolevulinic acid, Levels, Children and Kinshasa
Introduction
Lead is a heavy metal mainly in the earth’s crust. Up to now, no health benefits to humans have been reported for this metal or its compounds. It is an en-vironment toxic affecting deleteriously nervous, hema-topoietic, skeletal, renal, endocrine and reproductive systems. It is classified in its inorganic form as possible human carcinogen (group 2A) by International Agency for Research on Cancer (IARC). So, exposure to this met-al in the environment continued to be a serious public health problem for all ages [1-9].
Compared to adults, children were particular-ly susceptible to lead poisoning because they are in the phase of growth and development and have immature detoxication capabilities. Hand-to-mouth activities and playing pattern may intake more this toxic metal. In addition, children absorbed more lead from their environment and their developing central nervous systems are vulnerable to the toxic. Studies
REsEaRCh aRtiCLE
Check for updates
have reported associations between blood lead levels of ≥ 100 μg/L, the threshold of lead poisoning defined by WHO and the Centers of Disease Control and Pre-vention, and impaired growth and cognitive devel-opment, attention and behavioral problems among children can be taken in account with many cautions. These effects persist into adulthood and appear to be irreversible [10-19].
Lead can be toxic to humans and produce multiple adverse health effects, even at low levels of exposure, due to his ability to accumulate in the environment and organisms. (WHO, 2007) Today, a solid scientific con-sensus exists that exposure to even low levels of lead reduces intellectual quotient (IQ) and causes profound developmental disorders in children [3,12,20-23].
In 2007, the « Declaration of Brescia on Prevention of the neurotoxicity of metals » proposed a reduction of blood lead action level to 5 μ/dl as new evidence accu-mulates on toxicity at still lower blood lead levels. Thus, US, CDC accepted the recommendation by the Adviso-ry Committee on Childhood Lead Poisoning Prevention that a blood level reference value of 5 μg/dl be used to identify children with elevated blood levels [24,25].
During the last twenty years, important measures of public health were undertaken in many high-income countries to decrease lead exposure. Recent National Health and Nutrition Survey data on lead exposure in the United States indicates that the average blood lead level in population is 1.6 μg/dl and 1.91 μg/dl in children 1-5 years of age, a dramatic decline from the averages of 10-20 μg/dl measured in 1976-1980 [26]. In Europe, the means of blood lead levels for non-exposure peo-ple depend to any country: 4.86 μg/dl in Belgium and 1.51 μg/dl for children 1-6 years in France. This remark-able public health achievement of the decade can be attributed to the reduction of lead exposures from au-tomobiles, house paints, drinking water and consumer products [26,27].
Gasoline sold in most African countries contains 0.5-0.8 g/L of lead. Programs to reduce the environmental lead levels and exposure has been eschewed in most countries of the continent but in urban areas and near mining centers, high concentrations of lead in the air have come quite common [27].
In Democratic Republic of Congo, the leaded gaso-line and leaded paint are remaining in common uses and little is known about lead exposure. A pilot study was carried out in order to determinate the level of lead in blood from 485 healthy people living in Kinsha-sa between May 2003 and June 2004 by using atomic absorption with graphite furnace as dosage method. This study has reported a geometric mean blood lead of 120 μg/L (IC 95%: 115-125) and sixty-three percent of children aged less than 6-years-old with blood lead levels above 100 μg/L [28].
There were also others potential sources of expo-sure to lead in Kinshasa area as lead food, lead drink-ing water pipes, recycle metal utensils. Some literatures showed that vegetables cultivated along the side of the main roads of the city contained high lead levels [29 -32].
During the last twenty years, important measures of public health were undertaken in several countries to decrease lead exposure. In our knowledge, this is not the case in D.R. Congo and there are no routine screenings and monitoring processes for lead expo-sure. Few studies were done in D.R Congo to deter-mine lead level. Joel, et al. indicated a relatively im-portant lead impregnation of the Kinshasa population (mean 120 μg/L) [28]. In addition, there had been no reported studies in the evaluation of the relationship between urinary lead and urinary δ-aminolevulinic acid as well as the lead blood level in Congolese chil-dren. This was the aim of the present study.
Materials and Methods
Study area
Kinshasa is a metropolitan area in the southwest of the DRC that spans 9,965 km2 or 0.42% of the
nation-al territory. It is located to the west of the country be-tween 3.9 and 5.1 degrees south latitude and bebe-tween 15.2 and 16.6 degrees east longitude. It is bordered in the northeast and east by the province of Bandundu, to the south by the province of Kongo central, north-west and west by the Republic of Congo Brazzaville, a liquid boundary formed by part Congo River. It is divided into four districts and 24 municipalities. There are no indus-tries in the place of study susceptible to release signifi-cant amounts of lead in the atmosphere.
This study was conducted on children population living in Kimbanseke city wish is an urban commune in the south-east of Kinshasa, south of the communes of Ndjili and Masina. It is one of the new settlements, located in the hilly area. It is the most populated mu-nicipality of Kinshasa since 1980s, it is also one of the largest urban communes of the city-province of Kin-shasa with nearly a million inhabitants.
Population
This study was conducted from November 2012 to May 2013. Participants were randomly selected from children between 0 and 17 years of age. The design of the study was approved by the ethical committee of Public School of the University of Kinshasa (UNIKIN) on 18th January 2013. Parents were provided with a
written description of the study and asked to fill-in a structured questionnaire and to sign a voluntary con-sent before their children participated in the study. The questionnaire consisted on factors such as age, gender, distance between house and road traffic. 100 children were recruited.
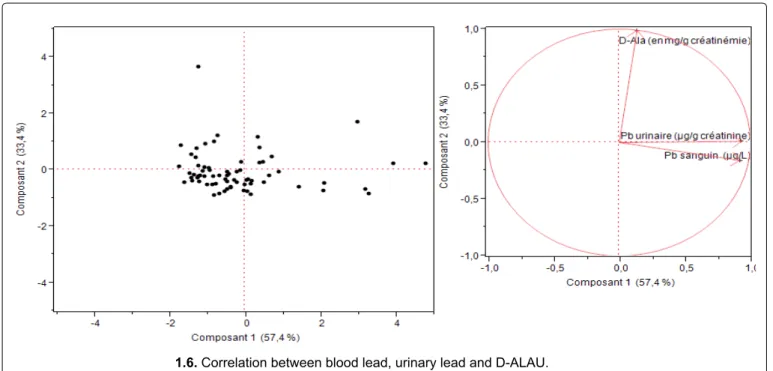
formed with the SAS V6.12 software package. The analysis of variance (ANOVA) and Student test were applied for the comparison of the difference of blood lead levels in different groups of children. Since the blood lead levels were fitted in a log normal distribu-tion, Geometric mean (GM) was used in the statistical analyses and p less than 0.05 is considered as signifi-cant. Principal component analysis (PCA) was applied to assess the association between blood level, uri-nary lead level and ALAU.
Results
It was observed that half of children were female and half were male. The mean blood lead level of male children is almost similar (MG = 93.40 μg/L) to that of female children (MG = 93.67 μg/L).The aver-age aver-age of children in this study was 8.9 years (range: 0-17.0 years).
It was observed that 10% of children between 0 and 6-years-old, and 77% between 7 and 8-years-old had blood lead level of 136.93 μg/L and 108.45 μg/L respec-tively, 23% of children between 9 and 10-years-old and 17% between 11 and 12-years-old presented blood lead
Samples and analysis
Venous blood samples (5-7 ml) of each person were collected by a trained nurse. The puncture point was cleansed with alcohol, soapy water and then distilled water. Each sample was placed in a 10 ml lead-free Li-heparin tube. All samples were immediately refriger-ated and shipped (8 h travel time) to the laboratory of toxicology in Belgium (ULg), where they will be refriger-ated at -20 °C until they were processed.
Urine and blood: Blood lead and urinary lead levels
were measured using inductively coupled plasma mass spectrometry. The blood sample above 100 μg/L was confirmed with a second analysis andthe concentration of lead in the urine was reduced per gram of creatinine in order to standardize the results and allow compar-ison with the reference values. The Bio-Rad ALA/PBG by column test and spectrophotometer methods were used to quantify the concentration of δ-aminolevulinic acid (D-AlaU) in urine.
Data analysis
All data were introduced into a database built with the software Foxpro 2.5. The analyses were
per-Table 1: Characteristics of the children blood lead, urinary lead and ALAD levels of participants. Variables Number of children (%) Values (arithmetic mean ±
standard deviation) Values (geometric mean) Blood lead level
¾
By references • ≥ 100 μg/L 50 (50) 138.45 ± 36.33 134.4 • 50-100 μg/L 43 (43) 70.57 ± 14.40 69.28 • < 50 μg/L 7 (7) 43.62 ± 8.10 43.32¾
By sex • Male 50 (50) 102.40 ± 44.80 93.4 • Female 50 (50) 103.05 ± 48.19 93.67¾
By age group • 0-6 10 (10) 139.90 ± 33.50 136.93 • 7-8 27 (27) 120.80 ± 59.62 108.45 • 9-10 23 (23) 87.70 ± 43.10 80.3 • 11-12 17 (17) 94.63 ± 22.85 92.34 • 13-14 13 (13) 74.73 ± 28.91 69.9 • 15-17 10 (10) 103.14 ± 54.44 92.51¾
By distance from house and road with high traffic • 0-5 m 10 (10) 68.27 ± 23.76 65.67 • 6-20 m 20 (20) 72.39 ± 22.06 69.77 • 21-50 m 10 (10) 130.57 ± 90.62 104.15 • 51-100 m 17 (17) 107.93 ± 33.91 103.44 • > 100 m 43 (43) 116.22 ± 42.89 108.99 Urinary lead level (μg/L) 100 (100) 5.1 ± 4.45 3.7 ALAD (mg/g of créatinin) 100 (100) 2.45 ± 1.53 1.77• < 4 mg/g 83 (83) 1.95 ± 1.14 1.45
difference was observed between there geometric blood lead values compared between them (p < 0.05). The average of geometric blood lead from children living at a distance < 500 m was 85.76 μg/L.
About urinary lead and ALAD of the infant popula-tion of the study, we observed that the mean of urinary lead level is about 5.1 ± 4.45 μg/L, 83 percent of chil-dren showed a mean of ALAD less than 4 mg/g of creat-inin (1.95 ± 1.14) and 17 percent showed a mean high or equal than 4 mg/g of creatinin (4.95 ± 1.07) (Table 1, Table 2, Table 3, Figure 1 and Figure 2).
Discussion
Lead had serious and irreversible consequences, es-pecially in children (damage to the central nervous sys-tem, leading to an alteration of higher functions: Learn-ing, memory and behavior) [20,33].
The results of our study showed a mean of blood lead level in children equal to 102.71 ± 45.70 μg/L with values ranging from 38.52 to 219.70 μg/L. The observed average seemed similar in accordance with the aver-age values observed in some developing countries: 116 μg/L between 1998-2000 in Venezuela, 98 μg/L in 2011 in Mexico, 96 ± 29 μg/L in 2001 in Brazil, 94 ± 29 μg/L in 2003 to Uruguay, 93.2 μg/L between 2003-2006 in In-dia and 86 μg/L in 2001 in Indonesia [34-36]. Compared to average values found in high-income countries, we levels of 80.30 μg/Land 92.34 μg/L respectively. The
blood lead levels of 69.90 μg/L and 92.51 μg/L were shown by 13% of children between 13 and 14-years-old and 10% between 15 and 17-years-old. There results indicated that children with 0 to 12-years-old present-ed an average of blood lead level of 98.52 μg/L com-pared to children old 13 to 17-years-old with an average of 78.80 μg/L. They also suggested that young children consumed most this toxic metal than their older broth-er probably due to the weakness of organism of young children.
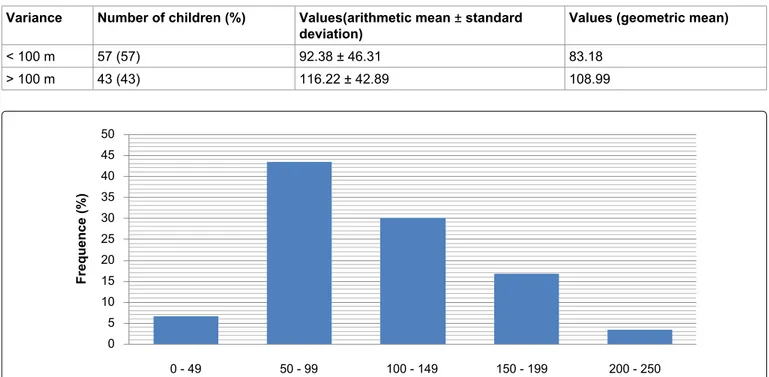
With regard to the frequency of level of lead im-pregnation, it was observed that 43.33% of the studied population presented a blood level between 50 and 90 μg/L, 30% and 16.66% had blood lead levels between 100 and 149 μg/L and 150 and 199 μg/L respectively, while 6.66% presented a concentration between 200 and 250 μg/L.
Considering the length of the road with heavy traf-fic where lived children, it was observed that 10% of children living between 0 and 5 m showed a geomet-ric blood lead level of 65.67 μg/L, 20% and 10% be-tween 6 to 20 m and 21 to 50 m presented a geomet-ric blood lead levels of 69.77 μg/L and 104.17 μg/L respectively, 17% and 43% between 51 to 100 m and beyond 100 m had a geometric blood lead levels of 103.44 μg/L and 108.99 μg/L respectively. Significant
Table 2: Childhood prevalence by age group. Variables Number of children (%) Values(arithmetic mean ± standard
deviation) Values (geometric mean)
0-12 77 (77) 107.52 ± 46.94 98.52 13-17 23 (23) 86.91 ± 40.45 78.8
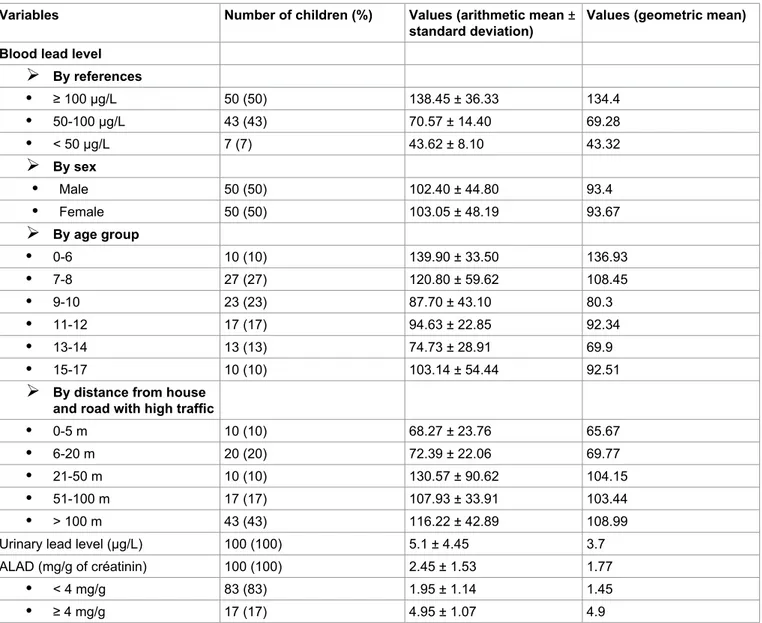
Table 3: Frequency of blood leads level by distance from house and road with high traffic. Variance Number of children (%) Values(arithmetic mean ± standard
deviation) Values (geometric mean)
< 100 m 57 (57) 92.38 ± 46.31 83.18 > 100 m 43 (43) 116.22 ± 42.89 108.99 0 - 49 50 - 99 100 - 149 150 - 199 200 - 250 50 45 40 35 30 25 20 15 10 5 0 Frequence (%)
Our study also showed that children aged 0-12 years had a higher mean blood lead level ((107.52 ± 46.94 μg/L) than adolescents aged 13-17 (86.91 ± 40.45 μg/L). These results are in agreement with those found in the literature [39]. This was because young children spend a lot of time playing outside and a no significant differ-ence was observed, the same as in a study conducted in Colombia [9].
In addition to blood lead, the best biological indi-cator of lead exposure, we measured urinary lead and urinary ALAD in urine. The results of this study show an average of 3.50 ± 3.02 μg/g creatinine (MG = 2.69 μg/g creatinine) far below the tolerable threshold of < 25 μg/g creatinine for the population not exposed to lead [24]. The average urinary lead level found in children (MA = 5.1 ± 4.45 μg/L or MG = 3.70 μg/g cre-atinine) is higher than the values found in the liter-ature among adults living in high-income countries: 1.11 μg/g of creatinin in Spain, 1.28 μg/g of creatinin in Japon, 0.45-0.93 μg/g of creatinin in Canada and 0.64-0.72 μg/g of creatinin in others countries [44].
Principal component analysis (PCA) showed that ALAU is not significantly associated with blood lead. This confirms the hypothesis that the ALAU assay is not a good biological indicator of lead exposure because hereditary tyrosinemia, liver diseases and stress, whatever the cause, can also increase ALAU [26,39].
References
1. Offie Porat Soldin, Brian Hanak, Steven J Soldin (2003) Blood lead concentrations in children : New ranges. Clinica Chimica Acta 327: 109-113.
2. Wilhelm M, Heinzow B, Angerer J, Schulz C (2010) Re-assessment of critical lead effects by the German Human Biomonitoring Commission results in suspension of the
hu-noticed that the average blood lead level of the chil-dren in our study (DR Congo) was far superior. There is an average children blood lead level of 10.20 μg/L between 2007-2009 in Canada, 13 ± 20 μg/L between 2007-2008 in Spain, 19 μg/L between 1999-2002 in the US, 18.2 μg/L between 1995-2007 in Sweden, 15.1 μg/L between 2008-2009 in France and 24 μg/L in 2008 in Brazil [35,37].
In addition, 50% of children had mean blood lead levels ≥ 100 μg/L, which was an average of 138.45 ± 36.33 μg/L. This prevalence found is lower than that found by Tuakuila J (63%) [28] that found in Albania (68%) [38], 70% in Nigeria, 78% in Johannersburg and 80% in Pakistan [33]. It seemed similar to that found in China, 54% [39] and Mexico (44%) in 2011 [14]. Fi-nally, it was far below that found in countries where the use of leaded gasoline had been banned. Indeed, many studies showed that the gradual decrease in the use of leaded gasoline was correlated with a decrease in the average level of blood lead [40-43]. There was a prevalence of 2.1% between 2008-2009 in France [37] and 7.4% in Colombia [7].
Currently, there was strong scientific consensus on the harmful effects of lead even at low levels. Numer-ous studies using psychomotor tests had revealed a decrease in intellectual quotient (IQ) and developmen-tal disorders in children in parallel with the increase in blood lead [3,10,17-20]. Thus, the trend was to reduce the tolerable threshold of blood lead levels in children to < 50 μg/L [21,22]. For example, lead poisoning in chil-dren was defined as a blood lead ≥ 50 μg/L. Based on this new trend and referring to the results reported in Table 1, we found that 93.33% of children showed mean blood lead levels ≥ 50 μg/L. This allowed us to advocate early screening and medical monitoring in the popula-tion of children from 0 to 6 years.
1.6. Correlation between blood lead, urinary lead and D-ALAU. Figure 2: Principal Component analysis of three interests’ responses.
study). Int J Hyg Environ Health 211: 345-351.
21. Dietrich KN, Ris MD, Succop PA, Berger OG, Bornschein RL (2001) Early exposure to lead and juvenile delinquency. Neurotoxicol Teratol 23: 511-518.
22. Lucchini RG, Zoni S, Guazzetti S, Bontempi E, Micheletti S, et al. (2012) Inverse association of intellectual function with very low blood lead but not with manganese exposure in Italian adolescents. Env Res 118: 65-71.
23. Landrigan P, Nordberg M, Lucchini R, Nordberg G, Grand-jean P, et al. (2007) The Declaration of Brescia on preven-tion of the neurotoxicity of metals. Am J Ind Med 50: 709-711.
24. ACCLPP (2012) Low level lead exposure harms children: A renewed call for primary prevention. USA Center for Dis-ease Control and Prevention.
25. Centers for Disease Control and Prevention (2004) Blood lead levels--United States, 1988-1991. MMWR Morb Mortal Wkly Rep 43: 545-548.
26. Lauwerys R, Haufroid V, Hoet P, Lison D (2007) Toxicolo-gie et intoxications professionnelles. Elsevier/Masson, 5è édition, 388-410.
27. Anonyme (2003) Déclaration de Dakar sur l’élimination du Plomb dans l’essence en Afrique sub-saharienne en Juin 2001 in Rapport d’avancement 1998-2002, document de travail de la Banque Mondiale-Région Afrique n 11 janvier 74.
28. Tuakuila KJ, Mbuyi F, Kabamba M, Lantin AC, Lison D, et al. (2010). Blood lead in the Kinshasa population. Arch Public Health 68: 30-41.
29. Mbuyi M, Tuakuila KJ (2002) Détermination des métaux lourds dans les aliments fréquemment consommés à Kin-shasa. Revue MES, Unikin 57-64.
30. Monama O, Mukinayi M, Sikubakaku H (1985) Chaine tro-phique du plomb. Rev Zair Sci Nucl 6: 226-237.
31. Musibono DE, Obey B (1994) Teneur en Plomb dans la patate douce (Ipomeapatatas) cultivée le long de quelques artères à intense trafic motorisé à Kinshasa. Comm pers (inédit).
32. Musibono DE (1999) Variations saisonnières de la teneur en chrome hexavalent ,cuivre, plomb et zinc dissous dans quatre rivières urbaines de Kinshasa (RDC) et analyse d’impacts écologiques. Méd Fac Landbouww Univ Gent 64: 81-86.
33. Nriagu JO, Blankson ML, Ocran K (1996) Childhood lead poisoning in Africa: A growing public health problem. The Science of the Total Environment 181: 93-100.
34. Soto-jiménez MF, Flegal AR (2011) Childhood lead poison-ing from the smelter in Torreon, México. Environment Re-search 111: 590-596.
35. Bas P, Luzardo OP, Peña-Quintana L, González JE, Peña JA, et al. (2012) Determinants of blood lead levels in chil-dren: A cross-sectional study in the Canary Islands (Spain). Inter J Hygiene and Env Health 215: 383-388.
36. Albalak R, Noonan G, Buchanan S, Flanders WD, Got-way-Crawford C, et al. (2003) Blood lead levels and risk factors for lead poisoning among children In Jakarta, Indo-nesia. The Science of the Total Environment 301: 75-85. 37. Etchevers A, Lecoffre C, Le Tertre A, Le Strat Y, De Launay
C, et al. (2010) Imprégnation des enfants par le plomb en France en 2008-2009.
38. Saraci M, Ziegler-Skylakakis K (1999) Determination of man biomonitoring values (HBM I and HBM II) for lead in
blood of children and adults. Int J Hyg Environ Health 213: 265-269.
3. WHO (2007) Health risks of heavy metals from long-range transboundary air pollution. Denmark.
4. ATSDR (Agence for Toxic Substances AND Disease Reg-istry) (1999) Toxicologic Profile for lead: Update. US De-partment of Health and Human Services, Atlanta, GA, USA. 5. Royce N, Rush T (2000) Case studies in environmental
medicine: Lead toxicity. US Department of Health and Hu-man Services, Agency for Toxic Substances and Disease Registry.
6. Laperche V, Dictor MC, Clozel-Leloup B, Baranger p (2004) Guide méthodologique du plomb, appliqué à la gestion des sites et sols pollués. BRGM/RP-52881-FR.
7. Brown LM, Kim D, Yomai A, Meyer PA, Noonan GP (2005) Blood lead levels and risk factors for lead poisoning in chil-dren and caregivers in Chuuk State, Micronesia. Int J Hyg Environ Health 208: 231-236.
8. Ministère Français chargé de la Santé (2003) Plomb et Sat-urnisme: le dépister-le prévenir-le soigner 1-19.
9. Olivero-Verbel J, Duarte D, Echenique M, Guette J, John-son-Restrepo B, et al. (2007) Blood lead levels in children aged 5-9 years living in Cartagena, Colombia. The Science of the Total Environment 372: 707-716.
10. Centers for Disease Control and Prevention (2001) Fatal pediatric lead poisoning-New Hampshine, 2000. MMWR 50: 457-459.
11. World Health Organization (1995) International Programme on Chemical Safety. Environmental Health Criteria 165-In-organic Lead. Geneva, Switzerland.
12. JF Rosen (1992) Health effects of lead exposure levels. Am J Dis child 146: 1278-1280.
13. Shen X, Rosen JF, Guo D, Wu S (1996) Childhood lead poisoning in China. The Science of the Total Environment 181: 101-109.
14. Chen L, Xu Z, Liu M, Huang Y, Fan R, et al. (2012) Lead exposure assessment from study near a lead battery fac-tory in china. The Science of the Total Environment 429: 191-198.
15. Absalon D, Slesak B (2010) The effects of the changes in cadmium and lead air pollution on cancer incidence in chil-dren. Sci Total Environ 408: 4420-4428.
16. Mazumdar M, Xia W, Hofmann O, Gregas M, Ho Sui S, et al. (2012) Prenatal lead levels, Plasma Amyloid beta Levels and Gene Expression in Young Adulthood. Environ Health Perspect.
17. Needleman HL, Schell A, Bellinger D, Leviton A, Allred EN (1990) The long-term effects of exposure to low doses of lead in childhood. An 11-year follow up report. N Eng J Med 322: 83-88.
18. Pocock SJ, Smith M, Baghurst P (1994) Environment lead and children’s intelligence: A systematic review of the epi-demiological evidence. BMJ 309: 1189-1197.
19. Lanphear BP, Hornung R, Khoury J, Yolton K, Baghurst P, et al. (2005) Low-level environmental lead exposure and children’s intellectual function: An international pooled anal-ysis. Environ. Health Perspect 113: 894-899.
20. Jedrychowski W, Perera F, Jankowski J, Rauh V, Flak E, et al. (2008) Prenatal low-level lead exposure and develop-mental delay of infants at ade 6 months ( Krakow inner city
42. Quataert P, Claeys F (1997) Surveillance épidémiologique de la population générale. Niveau de plomb et de cadmium sanguins en Belgique. Rapport ISP.
43. Hutse V, Claeys F, Mertens K (2006) Surveillance épidémi-ologique de la population belge. Métaux lourds et oligo-élé-ments dans le sang. IPH/EPI Reports.
44. Castaño A, Sánchez-Rodríguez JE, Cañas A, Esteban M, Navarro C, et al. (2012) Mercury, lead and cadmium levels in the urine of 170 Spanish adults: A pilot human biomon-itoring study. Inter J of Hygiene and Env Health 215: 191-195.
lead in the blood of children in the town of berat, Albania. Chemosphere 39: 689-696.
39. Wang Q, Zhao HH, Chen JW, Hao QL, Gu KD, et al. (2010) δ-Aminolevulinic acid dehydratase activity, urinary δ-ami-nolevulinic acid concentration and zinc protoporphyrine lev-el among people with low levlev-el of lead exposure. Int J Hyg Environ Health 213: 52-58.
40. Caprio RJ, Margulis HL, Joselow MM (1974) Lead absorp-tion in children and relaabsorp-tionship to urban traffic densities. Arch Environ Health 28: 195-197.
41. Claeys-Thoreau F, Bruaux P, Ducoffre G, Lafontaine A (1983) Blood lead of the Belgian population. Arch Occup Environ Health 53: 109-117.