Variations of the partial pressure of carbon dioxide in the
Scheldt estuary from 1993 to 2006; preliminary results
Schiettecatte L.S.
1*
, T. Maris
2
& Borges A.V.
1
The Scheldt estuary, of a total length of 160km, extends from Gent to Vlissingen where it opens to the North Sea (Figure 1). From a hydrological point of view, it can be divided in 3 sections: a marine zone, a brackish zone where occurred a high turbidity zone (HTZ, in the vicinity of Antwerp) and a freshwater zone. Its catchment's area from the freshwater to the brackish pars are highly polluted in terms of organic matter and nutrients originating from industrial, agricultural and domestic waste products. Latter ones are essentially brought by the Rupel that drains Brussels city where there is a lack of waste water treatment. As a macrotidal estuary, the residence time of the water masses in the HTZ is long (from 1 to 3 months) which leads to important biogeochemical transformation of carbon and nutrients during estuarine transit. It leads to high CO2build up (up to 11000 ppm, Frankignoulle et al Science, 282, and Schiettecatte,
unpublished data) and subsequent atmospheric CO2emissions (up to 0.66 molC m-2day-1, Frankignoulle et al 1998,
Science, 282). Over the last 50 years, major changes have occurred in the Scheldt estuary, e.g. whereas by the end of the 1970’ies the Scheldt estuary was severely impacted by hypoxia, it turned owing to waste water treatment policies toward improvement of the oxygen concentration during early 1980’ies. These O2changes but also significant reduction
of ammonium inputs are concomitant with the Scheldt paradox; i.e. the estuary shifted from denitrification in the 1970’ies to nitrification conditions since the 1980’ies (Billen et al, 2005, Hydrobiologia, 540; Soetaert et al, 2006, Limnology and Oceanography, 51(1)).
This study shows preliminary results of a long term monitoring of the surface partial pressure of CO2(pCO2) within the
Scheldt estuary (1993-2006) in relation with other parameters (here Scheldt discharge and O2).
Database and data analysis
pCO2data were collected from the BIOGEST and EUROTROPH projects and from the automated pCO2measurement system deployed since
September 2000 on the R.V. Belgica. Oxygen (%O2) data were gathered for the studied period from the EUROTROPH and OMES database.
Overall data covered a period from 1993 to 2006 but with high sampling variability in time and space. Thus pCO2data were more abundant since
2000 owing to the automated system whereas before that, pCO2was punctually measured during 2 up 5 annual cruises. Before 1995, pCO2was
calculated from total alkalinity and pH measurements, the latter being calibrated using buffers proposed by the U.S. National Bureau of Standards. After 1995, a non-dispersive infrared gas analyzer (IRGA, Li-Cor, Li-6262) and an equilibrator were used to measure the pCO2. For the
automated system the IRGA was calibrated weekly using pure nitrogen (Air Liquide Belgium) and two gas mixtures with a CO2molar fraction of
366 and 810 ppm (Air Liquide Belgium) that were calibrated against National Oceanic and Atmospheric Administration standards of a CO2molar
fraction of 361 and 774 ppm. The temperature at the outlet of the equilibrator was monitored with a platinum resistance thermometer (PT100, METROHM). The pCO2values were corrected for the temperature difference between in-situ seawater and water in the equilibrator using the
algorithm proposed by Copin-Montégut (1988, 1989). Salinity, temperature and pCO2were sampled with a 1 min frequency from the surface
seawater supply of the ship (pump inlet at a depth of 2.5 m). Salinity and temperature were measured using a SeaBird SBE21 thermosalinograph. Indeed, another difficulty of this work relies on the fact that other parameters than pCO2were not sampled at the same time
and/or same position. Then it was chosen to study the seasonal and interannual variability of the different parameters and their relation according to salinity within the conservative part of the estuary (e.g. at salinity 10). Scheldt discharge were provided by the Ministerie van de Vlaamse Gemeenschap.
Results and Discussion
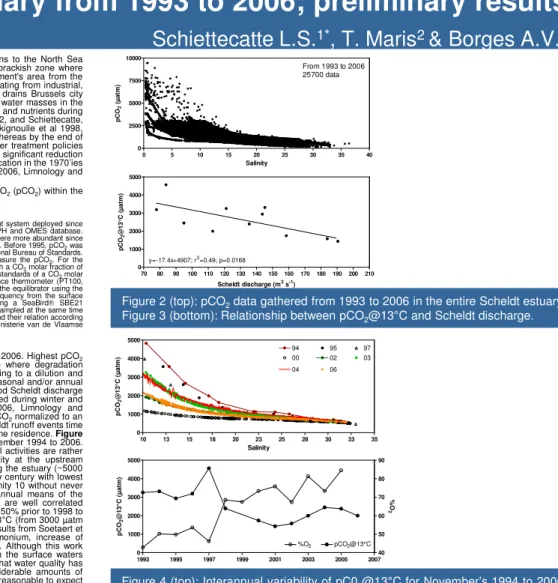
Figure 2 shows results from pCO2surveys (total data 25700) within surface waters from 1993 to 2006. Highest pCO2
are observed at the lowest salinities, e.g. in the high turbidity zone of the estuary (Figure 1) where degradation processes are the most intense. Above salinity 10, the pCO2profiles are rather conservative owing to a dilution and
ventilation effect. Beside biological and chemical processes that affect the pCO2dynamics at a seasonal and/or annual
scale, Scheldt discharge (full dataset not shown) is also a potential factor. During the studied period Scheldt discharge range from 31 to 622 m3s-1in respectively 1996 and 1993, with highest values generally observed during winter and
related to rainfalls and the North Atlantic Oscillation as demonstrated by Breton et al (2006, Limnology and Oceanography, 51(3)). Here a negative correlation is found between Scheldt discharge and the pCO2normalized to an
annual mean temperature of 13°C (pCO2@13°C, Figure 3) which suggests that during strong Scheldt runoff events time
CO2build up in the surface waters and prevent its ventilation through a decrease water masses time residence. Figure
4 shows surface waters pCO2@13°C along the estuary from salinity 10 up to 35 for period of November 1994 to 2006.
This month was chosen as it is representative of the most sampling period during which biological activities are rather low and where interannual variability could be due changes of discharge and/or water quality at the upstream boundaries. Thus a strong pCO2@13°C interannual variability is apparent: maximum values along the estuary (~5000
µatm at salinity 10) are observed in the late 1990’ies, the pCO2@13°C decreases during the new century with lowest
values were recorded in November 2000 before fluctuating between 2000 and 3000 µatm at salinity 10 without never reaching back the maximum values observed in 1994. These results are consistent with the annual means of the pCO2@13°C and %O2from 1993 to 2006 shown in Figure 5. pCO2@13°C and %O2profiles are well correlated
(pCO2@13°C=-48.1%O2+5672, r2=0.61, p=0.0028), and shows an improvement of the %O2(from ~50% prior to 1998 to
~70% at the beginning of the new century) parallel to a decrease of the surface waters pCO2@13°C (from 3000 µatm
prior to 1998 to 2000 µatm in 2000). These trends in pCO2and %O2are also consistent with the results from Soetaert et
al (2006, Limnology and Oceangraphy, 51(1)), who observed a significant decrease of ammonium, increase of nitrification and a reduction of organic matter (via a decrease of the chemical oxygen demand). Although this work needs further investigations, these preliminary results apart reflecting improvement of oxygen in the surface waters consecutive to waste water treatment policies as also observed by Soetaert et al (2006), suggest that water quality has also improved with regards to pCO2. As mentioned above, the Scheldt estuary received considerable amounts of
domestic waste through the Rupel that drains untreated waste water from Brussels. It seems then reasonable to expect that the implementation and functioning of the waste water treatment plant of Brussels (for April 2007) should improve water quality in terms of %O2and pCO2within the Scheldt estuary, as studied by Vanderborght et al (2006, Marine
Chemistry, in press). The surface waters pCO2monitoring (every minutes) in the HTZ of the Scheldt estuary (closed to
Antwerp) started since 2002 should be a key master to highlight these expected changes (Schiettecatte and Borges unpublished data). 10 13 15 18 20 23 25 28 30 33 35 0 1000 2000 3000 4000 5000 94 95 97 02 03 00 06 04 Salinity p C O2 @ 1 3 °C (µ a tm ) 1993 1995 1997 1999 2001 2003 2005 2007 0 1000 2000 3000 4000 5000 pCO2@13°C %O2 40 50 60 70 80 90 p C O2 @1 3 °C ( µ a tm ) % O 2
http://www.co2.ulg.ac.be/
European Geosciences Union
1
Chemical Oceanography Unit, B5, University of Liège, Belgium
General Assembly 2007
2Dept. Biologie, Campus Drie Eiken D.B014,Universiteitsplein 1,2610 Wilrijk, Belgium
Vienna, Austria, 15 – 20 Apr.07
*