IV
Université de Montréal
Zebrafish model of Glycine Encephalopathy
Par Raphaëlle Riché
Département de Neurosciences, Faculté de Médecine Mémoire présenté en vue de l’obtention du grade de maîtrise en Neurosciences Mai 2018 ©Riché, 2018IV
Résumé
L’encéphalopathie glycinergique (EG) est une maladie génétique récessive rare causée par un clivage de la glycine défectueux et caractérisée par l’accumulation de glycine dans l’organisme. Les patients atteints de la forme sévère d’EG présentent une forte létalité durant la première semaine post-natale, de l’hypotonie, de la léthargie, et survivent avec un retard développemental et des convulsions intraitables. Les traitements disponibles sont souvent inefficaces sur l’EG sévère, et peu de recherche translationnelle s’est penchée sur cette maladie. Ici, nous avons généré un modèle de la forme sévère d’EG chez le poisson zébré en invalidant l’orthologue du gène «GLycine DeCarboxylase» (GLDC), fréquemment muté dans la maladie. Nous montrons que les larves de poisson-zèbre gldc -/- récapitulent l’EG au niveau moléculaire, avec une réduction de l’expression de gldc et une augmentation des niveaux de glycine. Les mutants ont un phénotype rappelant les symptômes des patients, comme la léthargie, l’hypotonie, et la mort prématurée. La caractérisation moléculaire des mutants gldc -/- démontre qu’ils ont d’importants troubles métaboliques, affectant d’autres acides aminés et neurotransmetteurs que la glycine, avec de l’acidose lactique précédant la mort. Le cerveau des mutants présente aussi un déséquilibre transitoire de prolifération cellulaire, sans conséquence sur les principaux réseaux nerveux. Enfin, nous confirmons que le phénotype d’hypotonie des mutants est dû à la sur-activation des récepteurs NMDA et glycinergiques, et démontrons que l’hyperglycinémie à ces synapses est exacerbée, ce qui peut être sauvé pharmacologiquement en antagonisant ces récepteurs , et génétiquement en sur-exprimant le transporteur de glycine 1 (GlyT1).
IV
Mots-clés
Encéphalopathie glycinergique ; glycine ; métabolisme ; gldc ; poisson zébré ; génétique ; translationnel
IV
Summary
Glycine encephalopathy (GE) is a rare recessive genetic disease caused by defective glycine cleavage and characterized by increased accumulation of glycine in all tissues. In severe GE, patients have a high lethality in the first week of life, hypotonia, lethargy, and survive with variable developmental delay and intractable seizures. The treatments available are often inefficient on the severe form of the disease and little translational research has focused on the pathogenic mechanisms involved in GE. Here, we generated a zebrafish model of severe GE by knocking out the ortholog of the ‘GLycine DeCarboxylase’ gene GLDC, commonly mutated in the disease. We show that the gldc -/- zebrafish larvae recapitulate GE on a molecular level, with reduced gldc expression and increased glycine levels in the body. Gldc -/- also shows a phenotype reminiscent of severe GE symptoms, such as early lethality, hypotonia, and lethargy. A broad molecular characterization of gldc -/- mutants showed that there is a large metabolic disturbance affecting other amino acids and neurotransmitters than glycine, with lactic acidosis at stages preceding death. A transient imbalance was found in cell proliferation in the brain of gldc -/- but that does not have obvious consequences on major brain networks. Importantly, we confirmed that the gldc -/- hypotonic phenotype is due to NMDA and glycine receptor overactivation and demonstrated that there is an exacerbated hyperglycinemia at these synapses, which can be rescued pharmacologically using NMDA and/or glycine receptor antagonists, as well as genetically by overexpressing the glycine transporter GlyT1.
IV
Keywords
Glycinergic encephalopathy; glycine; metabolism; gldc; zebrafish; genetic; translationalIV
Table of content
Résumé……….ii Abstract………..……….…iv Table of contents………..……vi List of figures………..…vii List of acronyms………..vIV List of abbreviations ………..ix Acknowledgement………..….x Introduction………..……1 I.1. Glycine encephalopathy: presentation of the disease and research field……….1 I.1.a. Causes, symptoms, and treatments of glycine encephalopathy………...………….1 I.1.b. Previous studies on glycine encephalopathy models……….…………3 I.2. The role of glycine……….6 I.2.a. Glycine, a neurotransmitter………...….6 I.2.b. Glycine, an amino acid……….8 I.3. Zebrafish as a research model for glycine encephalopathy……….……….10 I.3.a. Advantages of zebrafish for translational research………..……10 I.3.b. Generating a model of glycine encephalopathy in zebrafish……….………12 I.3.c. Challenges associated with the modelling of glycine encephalopathy………13 Contributions……….15 Materials and Methods………...………....16 Results………...………27IV.1. Zebrafish gldc is expressed in the CNS and its loss-of-function induces glycine accumulation………...……….27
IV.2. Gldc -/- larvae die prematurely and depict GE-reminiscent motor phenotypes………30
IV.3. Metabolomics analysis indicates broad metabolic perturbations in gldc -/- larvae…………33
IV.4. Transcriptomics analysis reveals differences in the expression of cell cycle, proliferation, and metabolism-related genes in the gldc -/- mutant………35
IV.5. The main brain networks are not affected by gldc-KO despite a transient decrease of proliferation in gldc -/- brain ………..39 IV.6. Genetically and pharmacologically counteracting the exacerbated hyperglycinemia at the synapse rescues the motor phenotype of gldc -/- ………42 Discussion……….………47 Conclusion……….………..…………54 References……….……….………56
IV
List of figures
Figure I.1.1: The glycine cleavage system reaction………..2
Figure I.1.2: The action of GlyT1 to control glycine levels at NMDA-glutamatergic and glycinergic synapses……….5
Figure I.2.1: Glycine and NDMA receptors……….7
Figure I.2.2: The folate one-carbon metabolism (FOCM)………9
Figure I.3.1: The advantages of zebrafish for translational research………11
Figure I.3.2: Mechanism of action of the CRISPR/CAS9 mutagenesis technique……….13
Figure IV.1. Zebrafish gldc is expressed in the CNS and its loss-of-function induces glycine accumulation……….29
Figure IV.2. Gldc -/- larvae die prematurely and depict GE-reminiscent motor phenotypes…...31
Figure IV.3. Metabolomics analysis indicates broad metabolic perturbations in gldc -/- larvae………..35
Figure IV.4. Transcriptomics analysis reveals differences in the expression of cell cycle, proliferation, and metabolism-related genes in the gldc -/- mutant………38
Figure IV.5. The main brain networks are not affected by gldc-KO despite a transient decrease of proliferation in gldc -/- brain……….41
Figure IV.6. Genetically and pharmacologically counteracting the exacerbated hyperglycinemia at the synapse rescues the motor phenotype of gldc -/- ……….……45
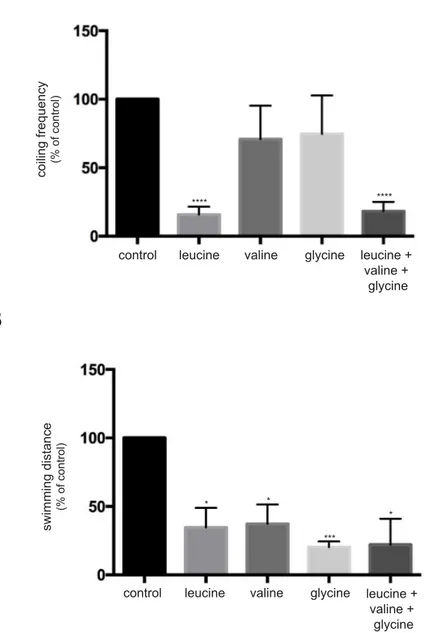
Figure V.1. Wild-type zebrafish show a hypotonic phenotype when treated with branched-chain amino acids and glycine………53
IV
List of acronyms
AMT: aminomethyltransferase AcTub: acetylated tubulin BCAA: branched-chain amino acid BCAT: branched-chain amino acid transferase BCKD: branched-chain α-ketoacid dehydrogenase CNS: central nervous systemCRISPR/CAS9: clustered regularly interspace short palindromic repeats/CRISPR associated protein 9 CSF: cerebrospinal fluid DLD: dihyrolipoamide dehydrogenase DNA: deoxyribonucleic acid Dpf: days post-fertilization ECM: extra-cellular matrix FOCM: folate one carbon metabolism GABA: gamma-aminobutyric acid GCS: glycine cleavage system GCSH: glycine cleavage system protein H GE: glycine encephalopathy GFP: green fluorescent protein GLDC: glycine decarboxylase GlyT1: glycine transporter 1 HRM: high resolution melting Hpf: hours post-fertilization IHC: immunohistochemistry KCC2: K+-Cl- cotransporter KO/KI: knock-out/knock-in LC-MS: liquid chromatography – mass spectrometry MSUD: maple syrup urine disease NMDA: N-methyl D-aspartate NTD: neural tube defect pH3: phosphorylated histone 3 RNA: ribonucleic acid RNAseq: ribonucleic acid sequencing gRNA: guide ribonucleic acid mRNA: messenger ribonucleic acid
IV RT-qPCR: quantitative reverse transcription polymerase chain reaction SHMT: serine hydroxymethyltransferase TH: tyrosine hydroxylase UAS-GAL4: upstream activation sequence-galactose4 vGluT: vesicular glutamate transporter VIAAT: vesicular inhibitory amino acid transporter WT: wild-type
Abbreviations
Indels: insertion/deletion of nucleotidesIV
Acknowledgment
I would like to thank all the authors and laboratory members that contributed to this work. Especially Eric Samarut, who took me under his wing throughout my Master’s, Kessen Patten for his great advices (“Salut, ca va?”), Alexandra Lissouba, Stefka Dzieciolowska, Gary Armstrong, Amrutha Swaminathan, and Marc Allard, for welcoming me in the laboratory and making the daily laboratory work more enjoyable and fun. I would like to thank Meiiang Liao for supporting me with the molecular biology, the fish facility members, Marina, Leo, the other lab members and of course my professor Pierre Drapeau, for taking me in his laboratory and giving me the opportunity to participate to international scientific congresses. And all the other students in the CRCHUM and at UdeM, with whom I became friends and shared great moments during those two years.
1
I. Introduction
1. Glycine encephalopathy: presentation of the disease and research
field
a. Cause, symptoms, and treatments of glycine encephalopathy
Glycine encephalopathy (GE), also known as nonketotic hyperglycinemia (MIM 605899), is a rare genetic defect in glycine metabolism characterized by increased cerebrospinal fluid (CSF) and plasma glycine levels, with elevated CSF:plasma glycine ratio [1-3]. GE has an autosomal recessive inheritance pattern and is classically caused by mutations in proteins of the glycine cleavage system (GCS), affecting approximately 1 in 76,000 births [4]. The GCS is an intramitochondrial enzyme complex composed of a glycine decarboxylase (GLDC), an aminomethyltransferase (AMT), a hydrogen carrier protein (GCSH), and a dihydrolipoamide dehydrogenase (DLD) (figure I.1.1) [4, 5]. The glycine decarboxylase gene GLDC is mutated in 72% of the GE cases, while the amino methyltransferase gene AMT is affected in 24% of the patients [2].
2
Figure I.1.1: The glycine cleavage system (GCS) reaction yields ammonia, CO2, and N 5-N 10-methylene tetrahydrofolate. The GCS is composed of 4 proteins: glycine decarboxylase (GLDC), tetrahydrofolate aminomethyltransferase (AMT), glycine cleavage system hydrogen carrier protein (GCSH), and lipoamide dehydrogenase (DLD). The symptoms of GE are commonly first observed during the neonatal period and are very heterogeneous among the patients [6]. This is due to the variety of mutations affecting the GCS genes, which determine whether there is residual GCS enzymatic activity. Patients with residual GCS activity develop a more attenuated form of the disease [4]. Individuals with attenuated GE often survive the neonatal period but show treatable epilepsy, spasticity, chorea, and variable developmental delay that can lead to intellectual disability [4, 6]. However, in severe GE the neonates present severe hypotonia, myoclonic jerks, lethargy and apnea due to respiratory depression, which often causes death within the first week of life. The neonates are sometimes born with brain malformations, such as hydrocephalus and
3
absence of corpus callosum [2]. The patients with severe GE surviving the neonatal period make no developmental progress and show spasticity, intractable seizures and hypotonia.
The treatments available for GE patients alleviate the symptoms caused by the increased glycine levels but do not resolve the underlying metabolic defects. Indeed, dextromethorphan, an NMDA receptor antagonist, is used to diminish the seizures in GE because it counteracts the effect of glycine as a co-agonist of the NMDA receptors, and sodium benzoate helps reduce glycine levels by elimination through the urine [6]. Unfortunately, even when combined, these treatments fail to improve the outcome of many GE patients and in the most severe form starting the treatment early in the neonatal period has no effect on the developmental deficiencies [6]. Thus, there is a real need for finding alternative treatments for this disease.
b. Previous studies on glycine encephalopathy models
Although the clinical research done on human patients has helped identify the genetic cause of the disease and characterize the spectrum of symptoms, it has not been very successful in understanding the molecular basis of GE. Some research efforts have been made to model the disease in mice and zebrafish. Mouse knock-outs of the AMT and GLDC genes have been generated in Nicholas Greene’s laboratory [7, 8]. The GLDC knock-out mice show features of glycine encephalopathy, such as hyperglycinemia, early lethality, and hydrocephalus. However, the authors did not characterize the molecular basis of the pathogenicity in GE as instead they focused on the prevalence of neural tube defects (NTDs)
4
in such mice models and the link between GE and NTDs. Indeed, the AMT and GLDC proteins participate in one-carbon folate metabolism (FOCM) by incorporating one-carbon units from glycine degradation. The FOCM is known to be crucial for cell proliferation and neural tube closure, and folic acid deficiencies are associated with a higher risk of neural tube defects in newborns. Moreover, this research group showed that GLDC mutations in humans predispose to NTDs [7]. In their work, the authors demonstrate that there was partially penetrant NTD in the homozygous GLDC mutant mouse embryos, decreased proliferation, and an imbalance in the folate compounds. They argue that the higher NTD prevalence is due to deficiencies in GLDC, which limits the supply of one-carbon units to the FOCM. Another mouse model of mild-GE was developed by diminishing the GCS activity using a dominant-negative gldc cDNA, but the authors characterized the behavioral features of this mouse and not the molecular aspect of the disease [9]. In zebrafish, the shocked mutant, in which the glycine transporter 1 (GlyT1) gene is knocked out has high extracellular glycine in the brain, and broad motor defects affecting spontaneous coiling (earliest motor output), the escape response, and swimming [10]. GlyT1 is a glycine transporter located at NMDA-glutamatergic synapses, on glial, pre-, and post-synaptic cells, and at glycinergic synapses on glial cells solely. At glycinergic synapses, GlyT1 acts to control the levels of glycine in the synaptic cleft, and at NMDA-glutamatergic synapses, GlyT1 keeps the extracellular concentrations of glycine below the saturating levels of the co-agonistic site of NDMA receptors (figure I.1.2) [11]. The GlyT1 was shown to be involved in a subtype of GE, in which the patients have a mild hyperglycinemia in the central nervous system (CNS) [12]. The shocked zebrafish mutant models a subtype of the disease
5
(with a brain-specific increase of glycine level) with only some features of GE, thus it cannot be used to understand the mechanisms underlying the pathogenicity of GE.
The lack of translational research on a model of GE and the need of finding an alternative treatment for the patient highlight the necessity of generating an accurate and reliable animal model of GE, more amenable to high throughput drug screens. To be able to describe the potential effects of hyperglycinemia on the system, one has to understand the role of glycine in the cell, in the brain, and in the body. Figure I.1.2: The action of GlyT1 to control glycine levels at NMDA-glutamatergic and glycinergic synapses. GlyT1 is located on glial cells at glycinergic synapses, and on glial, pre, and post-synaptic cells at NDMA-glutamatergic synapses. GlyR: Glycine receptor. AMPA: α-amino-3-hydroxy-5-methylisoxazole-4-propionic acid. VIAAT: vesicular inhibitory amino acid transporter. Taken from Harvey et al., 2013 [11].
6
2. The role of glycine
a. Glycine, a neurotransmitter In the nervous system, glycine acts as an inhibitory neurotransmitter when binding to glycine receptors by letting chloride ions flow inside the postsynaptic cell (figure I.2.1) [13]. Glycine receptors mediate the inhibitory circuitry of the spinal cord and the brainstem [14]. Glycine receptors are composed of 5 subunits: the alpha subunits, of which 4 types exist (GLRA1, GLRA2, GLRA3, GLRA4), bind glycine and contain the pore, and the beta subunit (GLRB) anchors the receptor to the membrane through its interaction with gephyrin [15]. In embryonic neurons, however, glycine receptors are excitatory when activated, due to increased intracellular chloride concentrations in immature neurons. In these conditions, when glycine binds, there is a depolarization of the cell, which leads to a calcium influx important for development of the neuron, particularly for the glycinergic synapse. When the neuron matures, there is expression of the extrusive K+-Cl- cotransporter KCC2, which lowers the intracellular concentration of chloride. This thereby reverses the flow of this ion when the glycine receptor is activated, leading to hyperpolarization and inhibition of the post-synaptic cell [14]. In the case of GE, inhibitory action of glycine on glycine receptors has been associated with respiratory depression and hypotonia [5].Glycine is also excitatory when binding the co-agonist site on NDMA-glutamatergic receptors (figure I.2.1). NMDA receptors are glutamate-gated cation channels that have the particularity of a high calcium permeability [16]. NMDA receptors are tetrameric channels composed of a combination of GluN1, GluN2, and GluN3 heterodimers. The GluN1 and 3 subunits bind glycine, whereas the GluN2 subunit binds glutamate. Each subunit exists in
7
many variants, and the variety of functions of the NMDA receptors is due to the variety of combinations of these subunits [17]. Activation of NMDA receptors requires the binding of L-glutamate to the GluN2 subunit and of glycine (or serine) to the GluN1 subunit, along with a simultaneous depolarization of the cell to remove the magnesium ion blocking the pore (figure I.2.1) [18]. NMDA receptors are known to be important for synaptic plasticity, more particularly through long-term potentiation and depression at synapses, processes crucial for learning and memory [19]. Interestingly, NMDA receptors are thought to be implicated in brain development, through experience dependent synaptic-plasticity [20]. Moreover, increased activation of the NMDA receptors has been hypothesized to be the cause of intractable seizures and brain damage in GE patients [5]. Overstimulation of these receptors might cause excitotoxicity and neurotoxicity [20]. Figure I.2.1: Glycine and NDMA receptors. The glycine receptor has 5 subunits, 4 alpha and 1 beta, and allows chloride to flow in the cell when glycine binds. Chloride flows inside the cell, which causes hyperpolarization and inhibition of neurotransmission. Glutamate binds to the GluN2 subunit of the NMDA receptor, while glycine binds to the GluN1 subunit. At the same time, a depolarization of the post-synaptic cell is required to remove the magnesium ion from the pore and let calcium and sodium ions flow in. Taken from Beecham et al., 2015 [15] and Cioffi et al., 2013 [18].
8 b. Glycine, an amino acid
Glycine is the simplest amino acid and in mammals, it is a nutritional non-essential amino acid, since it can be also synthesized in the body. Although deficiencies in glycine are not life threatening, chronic deficiencies might lead to suboptimal growth, making glycine essential for the support of maximum growth [21]. Indeed, glycine can be synthesized from threonine, choline, glyoxylate, and serine. All these reactions occur at various rates depending on the availability of glycine and substrates in the body. Threonine dehydrogenase catalyzes threonine conversion to glycine. Choline dehydrogenase converts choline to betaine, which is then used to produce methionine and sarcosine; sarcosine dehydrogenase then catalyzes the production of glycine from sarcosine. Alanine:glyoxylate aminotransferase uses the amino group of alanine and glyoxylate to yield glycine. The serine hydroxymethyltransferase (SHMT) synthesizes glycine from serine, and converts tetrahydrofolate to its activated form, N 5-N 10-methylene tetrahydrofolate, that is then
incorporated to the folate one carbon metabolism (FOCM) (figure I.2.2) [21, 22].
The major pathway of glycine catabolism occurs through the GCS, which yields ammonia and carbon dioxide, and also converts tetrahydrofolate to N 5-N 10-methylene tetrahydrofolate [1]. Glycine is thus an important carbon donor to the FOCM, crucial for many aspects of cellular functions, such as methylation reactions, synthesis of nucleic acids, proteins, lipids, proliferation, and redox balance. The FOCM is an integrator of nutritional status and is a major player in cellular proliferation [23]. On the physiological level, glycine plays an important role in the body. It represents 20% of protein amino acid
9
nitrogen, it is an important component of structural proteins such as collagen and it is used to produce glutathione, heme, creatine, purines, and serine. Glutathione is an important antioxidant and hemes are used for oxygen and mitochondrial energy transport. Creatine is crucial to muscle and nerve energy metabolism, and purines are necessary for DNA and protein synthesis, and thus cellular proliferation [21]. Glycine is therefore involved in a multitude of metabolic and physiological pathways in the body, and a disturbance in glycine levels could then affect these systems at multiple levels. Figure I.2.2: The folate one-carbon metabolism (FOCM). Glycine is an important donor of one-carbon units to the FOCM through its degradation by GLDC, or its production from serine by SHMT. Taken from Amelio et al., 2014 [22].
10
3. Zebrafish as a research model for glycine encephalopathy
a. Advantages of zebrafish for translational researchZebrafish is a great candidate for modeling rare genetic diseases such as GE since it offers a lot of advantages. First of all, it is a cheap and fast model, that is very favorable to the study of development. Indeed, the ex vivo fertilization of the embryos and its transparency allow to follow the development from the first cell to the larval stage. These features of the zebrafish embryo also permit access to the first cell for injections, making it a first line model for genomic modulation or modification. Then, spontaneous coiling is the earliest motor behavior of the embryos, occurring at 17-21 hours post fertilization (hpf), and it gives a read-out of the development of the motor system. This early motor behavior is also a very practical read-out for fast drug testing and functional genomic investigations [24, 25].
Secondly, as mentioned previously, zebrafish has the advantage of being easily genetically modified. Indeed, GAL4-UAS transgenic lines have been generated to enable the observation of various neuronal populations by expressing fluorescent proteins under cell-type specific promoters. Moreover, the zebrafish embryo is very amenable to the generation of knock-out/knock-in mutants using the CRISPR/CAS9 technique [26] In addition, by injecting RNA in the first cell of the embryo, one can transiently overexpress a gene in the embryo for up to 2 days. This allows for the monitoring of motor read-outs such as spontaneous coiling or the escape response which develops at 2 days post fertilization (dpf). Finally, zebrafish is an excellent model for translational research. Being a vertebrate, the zebrafish genome has a high homology to the human genome and a complex, yet easily accessible, central nervous system. Indeed, 80% of the human disease-causing genes have an
11
ortholog in zebrafish which makes it relevant for the study of human diseases [27]. Interestingly, many CNS-related disorders have been successfully modeled in the past such as Amyotrophic Lateral Sclerosis and Spinal Muscular Atrophy, epilepsy, and autism [28-32]. The size of the zebrafish embryo and larva allows the conduction of high-throughput drug-screens, by diluting the drugs directly in the bathing water of the fish. As mentioned before, there are many established motor read-outs for the effects of a drug on the nervous system (figure I.3.1). Figure I.3.1: The advantages of zebrafish for translational research.
12
b. Generating a model of glycine encephalopathy in zebrafish
With the aim of unraveling the molecular substratum of GE, we generated a zebrafish model of GE using the CRISPR/CAS9 mutagenesis system. Using this technique, one can introduce insertion/deletion of nucleotides (indels) in a region of a gene of interest, that can potentially lead to deleterious mutations and knock-out the gene of interest. This is done by injecting, in the first cell of the fertilized embryo, CAS9 mRNA and a guide RNA (gRNA), targeting a DNA sequence in the gene of interest for mutagenesis. The gRNA will bring the CAS9 endonuclease to the targeted genomic site, which will cut both strands of DNA at this region. One cellular mechanism of repair, non-homologous end joining, can lead to random insertion/deletion of DNA (figure I.3.2) [33]. Some of the indels can generate a frameshift of sequence and lead to the introduction of a premature stop codon, which will subsequently drive non-sense mediated decay of the transcript. These nonsense mutations often lead to loss-of-function of the gene [34]. The gldc gene is the most relevant target to model GE since it is the most commonly mutated in this disease. In 90% of the GE cases, there is a missense mutation affecting the function of the protein [35]. Moreover, human patient’s genetic data suggest that the more deleterious the mutation is, the more severe are the symptoms of GE. In such light, generating a zebrafish knock-out mutant of gldc is the first step to modeling severe GE since it will help understand the function of this protein and the effect of its deletion in the pathogenesis. Although there is no mutational hotspot in the GLDC human gene, a mutation in the glycine cleavage domain will most probably be pathogenic and affect the function of the protein [35].
13 Figure I.3.2: Mechanism of action of the CRISPR/CAS9 mutagenesis technique. Using CRISPR/CAS9, indels can be inserted in the genomic region of a gene of interest by designing a guide RNA targeting a short sequence in this gene. This guide RNA will bring the endonuclease CAS9 to the targeted sequence, which will cut the DNA at this site. Figure taken from Redman et al., 2016 [33]. c. Challenges associated with the modeling of glycine encephalopathy
Generating a loss-of-function mutant to model GE in zebrafish brings to light a few problematics. First of all, the molecular mechanisms underlying GE are for the most part unknown, and the effects of hyperglycinemia on the system need to be investigated. Indeed, glycine is an amino acid and a neurotransmitter in the brain, and an increase in glycine could have an effect on both metabolism and neurotransmission. The contribution of metabolism versus neurotransmission to the disease symptoms, and whether they are linked or independent pathogenic mechanisms, is still unclear. As described above, glycine acts as an inhibitory neurotransmitter in the CNS when it binds to glycinergic synapses, and as a co-agonist of the NMDA receptors at the excitatory glutamatergic synapse. Thus, hyperglycinemia in the brain, as occurs in GE, should lead to defective signaling at these
14
synapses. This aspect of pathogenicity linked to hyperglycinemia in GE has already been established, since the patients are treated with a drug antagonizing the NMDA-glutamatergic receptors, dextromethorphan, to alleviate the seizures, and the glycinergic receptors antagonist strychnine has been tried in the past [36]. However, the metabolic facet of the disease linked to glycine as an amino acid is still obscure, as it has not been much investigated in humans or translational animal models. Here, we set out to characterize the metabolic mechanisms involved in the pathogenicity of gldc loss-of-function in zebrafish, as well as the contribution of the neurotransmission defects to the GE-related phenotype.
15
II. Contributions
The mass spectrometry analysis of the mutant gldc fish was performed by different contributors: the metabolomics platform of the Research Center of the University of Montreal Hospital (CR-CHUM) contributed to initial glycine dosage and the neurotransmitter analysis, Izabella Pena of the Children’s Hospital of Eastern Ontario Research Institute and Department of Pediatrics contributed to the amino acid dosage, and Kit-Yi Leung in Nicholas Greene Laboratory at University College London contributed to the folate compound analysis. The RNA sequencing analysis was performed by Florent Guilloteau and Patrick Gendron at the genomic platform of the Institute for Research in Immunology and Cancer of Université de Montréal.
16
IV. Materials and Methods
Fish Husbandry and fish lines
Wild-type zebrafish (Danio rerio) were reared at 28.5°C, kept under a 12-hour dark, 12-hour light cycle and staged as described previously [37]. They were bred according to standard procedures [38]. All experiments were performed in compliance with the guidelines of the Canadian Council for Animal Care and conducted at the Research Center of the University of Montreal Hospital Center (CRCHUM). The dlx5-6:GFP, islet1:GFP and vglut2a:RFP transgenic lines are gifts from Marc Ekker and Shin-ichi Higashijima respectively [39, 40]. Whole mount in situ hybridization and probe cloning
A Specific gldc probe corresponding to the 5’ part of the coding sequence and first exon (951bp amplified with the following primers: Forward-gaaggacctttgtgagattacgg; Reverse- taatgcaggccagtgagtgag) was cloned within the pCS2+ vector using TOPO TA cloning kit (Invitrogen). After sequencing, antisense probe was transcribed in vitro using SP6 RNA polymerase. Whole-mount in situ hybridization of zebrafish embryos was performed as described by Thisse et al., 2008 [41]. Stained embryos were kept in 80% glycerol and photographed.
17 sgRNA and cas9 preparation and microinjection
The following gRNA sequence targeting the fourth exon of the gldc gene was designed using the online tool CRISPRscan ((PAM site is indicated in brackets): gggacacctcgggctggta(cgg). Synthesis of gRNA and Cas9 mRNA was performed as described by [42]. Tubingen long fin (TL) wild-type embryos were collected for microinjection. A 1nL drop of a mix of 100 ng/μL of Cas9 mRNA and 30 ng/L of gRNA was injected into one-cell stage embryos using a Picospritzer IV pressure ejector.
Tail clipping of embryos, fin clipping of adult and genomic DNA extraction
Tail clipping was done on 3 to 7 days old embryos that were transiently anesthetised in tricaine methanesulfonate (MS222) at a final concentration of 160 mg/L and a tiny piece of transparent tail at the caudal fin was cut using a microblade. Fin clipping was done on adult fish that were anesthetised in tricaine methanesulfonate at a final concentration of 160 mg/L and a small piece of the caudal fin was cut with a sharp blade. The fish were immediately put back in fresh water in isolated tanks. Genomic DNA extraction was performed in 10μL (embryos) or 20 μL (adult) of 50 mM NaOH. The samples were boiled for 10 minutes and 1/10 volume of 100 mM Tris-HCl pH 8 was added to buffer the reaction, as described in Samarut et al., 2016 [42].
High-resolution melting (HRM)
Primers were designed using the Universal Probe Library Assay Design Center (Roche).
18
TGGTCTGATAGTTGAGTAAGCTCTCC. The PCR reactions were made with 5 μL of the Precision Melt Supermix for HRM analysis (Bio-Rad #172-5112), 0.5 μL of each primer (10 μM) and 2 μL of genomic DNA and water up to 10 μL. The PCR was performed in a LightCycler 480 Instrument II (Roche) using white 96 well plates. Two-step Evagreen PCR reaction protocol was 95°C for 2 min, then 45 cycles of 95°C for 10 sec and 60°C for 30 sec, followed by 95°C for 30 sec, 60°C for 60 sec, the temperature was increased by 0.02°C/sec until 95°C for 10 sec, then cooling at 40°C. Curves were analyzed using the Roche LightCycler 480 software version 1.5.1.62.
PCR and sequencing
Primers were designed using the Universal Probe Library Assay Design Center (Roche) to amplify a 667bp fragment surrounding the CRISPR target site. Forward: AATGTATTATTTTTGTGTGAACTGTCCC; Reverse: TTCCGTACTTGGCTCTAGTTTGC. The PCR reactions were made with 0.5 μL of dNTP (10 μM), 0.5 μL of each primers (10 μM), 2.5 μL of 10x PCR buffer, 0.125 μL of Taq DNA polymerase (GenedireX), 1 μL of genomic DNA and water up to 25 μL. The PCR reaction protocol was 94°C for 5 min, then 35 cycles of 94°C for 30 sec, 60°C for 30 sec and 72°C for 45 sec and finally 72°C for 10 min. Samples were sequenced by Genome Quebec/McGill center using Applied Biosystems 3730xl DNA Analyzer.
Morphological analysis
6 dpf gldc +/+ and -/- larvae were anaesthetized and dorsal and lateral images of the whole body were acquired using the same parameters for all larvae. Body length, eye size, inter-eye
19
spacing were measured using the ImageJ measurement tools. Body length was measured from the anterior tip to the caudal peduncle. Eye size was measured with the diameter and the inter-eye spacing was measured from the middle of each eye.
Coiling analysis and swim tracking
20 hpf embryos were embedded in low melting agarose and covered with water, their movements inside the chorion were recorded using a camera for 20 minutes. The Danioscope software (Noldus) was then used to quantify the number of bursts over time. At 7 dpf, larvae were transferred individually into a 96-well plate and swim distance was recorded using Basler GenIcam camera and DanioVision recording chamber (Noldus). Analysis was performed using the Ethovision XT 12 software (Noldus) to quantify the distance swam. Hypotonia and swim balance tests One gldc -/- mutant and one sibling 7 dpf larva were placed in the center of a water-filled petri dish and we applied a water current circularly using a wash bottle. We took videos and tracked the trajectory of each fish and recorded the time taken to immobilize after application of the water current. For the swimming balance test, we placed 7 dpf gldc -/- and sibling larvae in two different plastic bottles filled with water, and recorded a video over 10 minutes. We generated a heat map tracking the movement of the larvae using the Noldus Danio Vision software, and we quantified the proportion of larvae in the upper and lower half of the water over 10 minutes.
20
Mass spectrometry liquid chromatography of folate compounds
Analysis of multiple folates was performed by UPLC-MS/MS as described previously [43]. Folate sample buffer containing 20mM ammonia acetate, 0.1% ascorbic acid, 0.1% citric acid and 100mM DTT at pH7 was added to the zebrafish samples. Each sample consisted of a pool of three zebrafish at 6-7 dpf. Samples were homogenized by sonication for 10 seconds using a hand-held sonicator at 60% amplitude. Protein was removed by precipitation with addition of 2 sample volume of acetonitrile, mixing for two minutes and centrifugation for 15 minutes at 12,000 x g and 4ºC. Supernatants were transferred to fresh tubes, lyophilized and stored at -80ºC prior to analysis. Folates were measured by multiple reaction monitoring (MRM) with optimized cone voltage and collision energy for precursor and product ions as described [44]. The folate distribution is calculated as relative amount of total folate in the sample and is expressed as percentage of the total folate. Mass spectrometry liquid chromatography of neurotransmitter, glycine and lactate Adapted from Wojnicz A et al. 2016 [45]. Extraction by cycles of freezing/thawing/sonication in acidified water followed by acetonitrile protein precipitation and sample concentration; Separation performed by HPLC on a C18-PFP column, detection by ESI-MS/MS. In details: Samples were protected from direct light as much as possible. 35µL of ice-cold 1.89% formic acid in MilliQ water containing d2-GABA and d3-lactate internal standards (solution 1) were added to samples of 2 to 4 embryos in 1.5mL polypropylene tubes. Samples were lysed by 2
21
cycles of freezing in liquid N2/ thawing/ sonication in a cup horn sonicator in ice-cold water during 60sec with pulses of 10sec on, 10sec off at 150W intensity. After a centrifugation at 20,000g, 10min, 4°C, 35µL of the supernatants were transferred to new 1.5mL tubes, then 140µL (4 volumes) of ice-cold acetonitrile were added. Tubes were vortexed 10 sec, kept on ice for 10min and centrifuged 20,000g, 15min, 4°C. Supernatants were transferred to new 1.5mL tubes, dried down under a stream of nitrogen at room temperature and stored at -80°C. Just before the analysis, samples were reconstituted in 35µL (2-3 embryos) or 50µL (4 embryos) of ice-cold 5% acetonitrile, 0.2% formic acid in MilliQ water, vortexed and centrifuged 10,000g, 5min, 4°C. Supernatants were transferred to HPLC vials and kept at 4°C before injections of 5µL in triplicate into a Nexera X2 HPLC system (Shimadzu). Separation of the analytes was achieved using a gradient elution (mobile phase A: 0.1% formic acid in MilliQ water; B: acetonitrile; 0 min = 5% B, 2 min = 5% B, 5 min = 90% B, 8 min = 90% B, 10 min = 5% B, 14 min = 5% B) with a flow of 0.6mL/min on a ACE C18-PFP 4.6 × 150 mm, 3 μm particle size HPLC column (Advanced Chromatography Technologies) following a ACE C18-PFP 3.0 x 10mm, 3μm particle size guard column (Advanced Chromatography Technologies), both kept at 30°C. Eluent was analyzed by electrospray ionization-MS/MS on a QTRAP 6500 mass spectrometer (Sciex) using MRM analysis looking for the following transitions in positive ion mode: GABA 104 => 87, d2-GABA 106 => 89, glutamate 148 => 84, dopamine 154 => 91, serotonin 177.05 => 159.9 and glycine 76 => 30.1; and in negative ion mode: lactate 88.8 => 43.2 and d3-lactate 91.8 => 41.8. All reagents were from Sigma, except d2-GABA from CDN Isotopes (Pointe-Claire, QC) and acetonitrile from EMD Millipore.
22 Mass spectrometry liquid chromatography of amino acids Amino acids were detected and quantified by LC-MS/MS as previously described [46]. Each replicate consisted of pools of five deep frozen 7 dpf larvae. For metabolite extraction, larvae were sonicated in 150 μL Methanol and 75 μL Chloroform in 10 cycles (10s on, 30s off) using Bioruptor Pico (Diagenode). Then, 112 μL of Chloroform and 112 μL of H2O were added to the lysate, vortexed and centrifuged at 20.000 x g for 20 min at 4°C allowing phase separation. The supernatant containing polar metabolites was collected and dried under nitrogen. The metabolite extract was resuspended in HPLC grade H2O (Sigma) and used for liquid chromatography-tandem mass spectrometry analysis (LC-MSMS). An ACQUITY UPLC BEH C18 1.7µM 2.1 x 100 mm column (Waters) was used at 30o C for reverse-phase chromatography. 0.5 mM Tridecafluoroheptanoic acid (TDFHA) in water was used as the aqueous mobile phase and 0.5 mM TDFHA in acetonitrile as the organic phase at a flow rate of 650 μL/min. Detection of amino acids analytes was performed in a Waters TQS triple quadrupole mass spectrometer operating in the positive ion mode and using a multiple reaction monitoring (MRM) method adapted from a published procedure [47]. Processing of the chromatograms obtained by LC-MSMS was done using TargetLynx (Waters), including peak detection, peak integration and concentration estimation based on calibration curves. For statistical analyses, Student’s T-test was used. Significance testing and graphing was performed with GraphPad Prism 7 software.
Transcriptomic assay, differential expression assay and pathway analysis
23
(Thermo Fisher Scientific) following the manufacturer’s standard protocol. For each sample, RNA extraction was made from 10 whole larvae. Absence of contamination with chemicals was assessed by nanodrop using 260/280 and 260/230 ratios. Quality of total RNA was assessed with the BioAnalyzer Nano (Agilent) and all samples had a RIN above 9.
1000 ng of total RNA was used for library preparation. Quality of total RNA was assessed with the BioAnalyzer Nano (Agilent) and all samples had a RIN above 8,6. Library preparation was done with the KAPA mRNAseq Hyperprep kit (KAPA, Cat no. KK8581). Ligation was made with 5,7 nM final concentration of Illumina Truseq index and 15 PCR cycles was required to amplify cDNA libraries. Libraries were quantified by QuBit and BioAnalyzer DNA1000. All libraries were diluted to 10 nM and normalized by qPCR using the KAPA library quantification kit (KAPA; Cat no. KK4973). Libraries were pooled to equimolar concentrations. Sequencing was performed with the Illumina Nextseq500 using the Nextseq High Output Kit 150 cycles (2x80bp) using 2.2 pM of the pooled library. Around 100-200 M paired-end PF reads was generated per sample. Library preparation and sequencing was made at the Institute for Research in Immunology and Cancer’s Genomics Platform (IRIC). Between 73 and 98 million reads were generated for each sample. Library preparation and sequencing was done at the Institute for Research in Immunology and Cancer’s Platform (University of Montreal). About 95% of high quality reads were mapped onto the zv9 version of the zebrafish genome (ensemble release 77) using TopHat version 2.0.10.
Differential gene expression analysis was assessed by DeSeq2 package using R software. Differential gene expression was filtered on a False Discovery Rate (or adjusted p value > 0.05). Pathway analysis was performed using DAVID bioinformatics resources [48]. The list of
24
differentially expressed genes was uploaded onto DAVID analysis wizard and a list of all expressed genes found in our dataset was used as a background for gene enrichment analysis.
RT-quantitative PCR (RTqPCR) and RT-PCR
qPCR primers were designed using the Universal Probe Library tool from Roche. Primers for gldc: Forward: tctcctttcagcccaacagt, Reverse: tctggagttcagataggctttga. All other primer sequences are available upon request. Reverse transcription was performed from 500ng of total RNA using the superscript VILO reverse transcription mix (Invitrogen). Quantitative PCR was performed on 2 µL of 1:10-diluted cDNA using SYBR Green I master (Roche) on a LightCycler 80 thermocycler. Polr2d gene (ENSDART00000108718) was used as a reference gene for ddCt quantification.
Immunohistochemistry and pH3 and pav7 quantification
Gldc -/- and +/+ embryos were anaesthetized in 0.2% tricaine, fixed with 4%
paraformaldehyde for 1h30 at room temperature (or in Dent’s overnight at 4ºC for pH3 IHC).
Samples were stored in Methanol at -80°C until use. Immunohistochemistry was performed
as previously described [49]. Briefly, fixed fish were blocked and permeabilized with -80ºC
acetone for 7-15 minutes, 0.1% Triton X100 diluted in PBS washes, incubated for 1-2h with block solution (PBS 0.1%Triton, 2% NGS, 2%BSA, 1%DMSO) at RT and then incubated overnight at 4ºC with anti Ac-Tub (1:1000, T6793, sigma), anti-pH3 (polyclonal, 1:500, 06-570, millipore), anti-TH (1:400, mab318, millipore), anti vGluT1 (1:500), or anti-pav7 (1:1000,
25 both gifts of Masahiko Hibi). After several washes, fish were incubated during 2h with goat anti-rabbit antibodies coupled to Alexa Fluor 488. Quantification of Pav7- and pH3-positive cells was done blindly by using the count tool on Photoshop. Transgenic line confocal imaging and dlx5/6 quantification Gldc -/- and +/+ larvae (3 and 7 dpf) were anesthetized in 0.2% tricaine, and embedded in low melting agarose in the dorsal-up position. They were kept hydrated during the fluorescence imaging under the confocal microscope (Olympus BX61W1 equipped with a Quorum Technology spinning disk head connected to a Hamamatsu ORCA-ER camera). Using the 4x or 10x zoom, 2µm-spaced images were acquired using 491nm or 561nm lasers. For analysis, stacked images were exported, and quantification of dlx5/6-positive cells was done using 8-bit images on ImageJ, setting a threshold, applying fixed parameters in the particles analysis tool so to detect only cells, and using the count mask. Drug treatments All drugs were obtained through Sigma. The drug solutions were prepared as follows: 10mM stock solution of strychnine (S0532) was prepared by dissolving 33.4mg of powder in 10mL of water; 10mM stock solution of Dextromethorphan (D9684) was prepared by dissolving 37mg of powder in 10mL of water. The stock solution was dissolved in fish water to reach the final concentration. Embryos and larvae were individualized in glass beaker in a total volume of 50mL and were incubated overnight in a lightproof box at 28.5ºC.
26
Glycine Transporter 1 cloning and mRNA in vitro synthesis
Total RNAs from 24 hpf embryos was extracted using phenol-chloroform RNA extraction method and 500ng of total RNAs were retro-transcribed using VILO RT enzyme (Invitrogen). 1µl of retro-transcription reaction was used to amplify the full-length cDNA of GlyT1 using the following primers: Forward: ATGAACAGCAGAAAGAATGGAGCA; Reverse: CTATGCGCTGGGTGTGGG. The PCR product was cloned within the pCS2+ vector using TOPO TA cloning kit (Invitrogen). After sequencing, the corresponding mRNA was transcribed in vitro using SP6 RNA polymerase.
Statistical analyses
For statistical analyses, the Student T-test was used when comparing two groups. For more than two groups, one-way and two-way ANOVA were used as required. The post-hoc test used for one-way and two-way ANOVA was Fisher’s LSD test. Significance testing and graphing was performed with GraphPad Prism 7 software. Analysis of the neurotransmitter and lactate was performed as described by [45].
27
IV. Results
1. Zebrafish gldc is expressed in the CNS and its loss-of-function induces glycine accumulation
We started by examining the gldc sequence and its expression in zebrafish embryos. In contrast to the common gene duplication in teleost fish, a single copy of the gldc gene can be found in the zebrafish genome (ENSDAR00000035120) and it shows more than 60% overall amino acid identity with the human protein. We also assessed the expression pattern of gldc during zebrafish development by in situ hybridization from 8 hours post-fertilization (hpf) to 42 hpf. Gldc is broadly expressed in the nervous system until 32 hpf, and at 42 hpf its expression is in specific brain regions (fig. IV.1.A). The significant level of identity between human and zebrafish GLDC and its strong expression in the embryonic CNS suggest a robust evolutionary conservation of GLDC function, thus supporting the pertinence of a gldc knock-out zebrafish to model the human disease.
In designing gRNAs for the CRISPR/CAS9-mediated mutagenesis, we targeted the beginning of the glycine cleavage domain with the aim of reproducing a pathogenic loss-of-function mutation. We selected for non-sense mutations that introduced stop codons in the glycine cleavage domain, as previously reported in GE patients, most likely leading to a loss-of-function [50]. We selected a founder transmitting a 5 nucleotide deletion and 3 nucleotide mismatches early in the glycine cleavage domain, creating a stop codon at the 189th amino acid (fig. IV.1.B-C). Using the high-resolution melting (HRM) analysis [42], we could easily
identify all three genotypes (+/+, -/+, -/-) (fig. IV.1.B). We confirmed gldc knock-out by RT-28
qPCR and showed that -/- embryos have reduced levels of gldc expression compared to their siblings, as seen in patients [51]. More importantly, Liquid Chromatography – Mass Spectrometry (LC-MS) analysis of glycine levels in whole 7 dpf larvae supported the loss-of-function nature of the mutation, since gldc -/- larvae display 4 times more accumulated glycine than their siblings (fig. IV.1.D). The fact that only homozygous larvae depicted hyperglycinemia is also consistent with the recessive nature of the disease, confirming that one allele of gldc is enough to maintain glycine metabolism homeostasis. Altogether, these results show that our newly generated gldc-KO line recapitulates the main molecular hallmarks of GE.
29 Figure IV.1: Zebrafish gldc is expressed in the CNS and its loss-of-function induces glycine accumulation. A. In situ hybridization of gldc mRNA at 8, 18, 24, 32, and 42 hpf. B. CRISPR/CAS9 mutagenesis targeting the 4th exon of Gldc led to substitution of 2 nucleotides and deletion of 5 nucleotide. These DNA mutations in gldc -/- induce a melting curve shift compared to +/+. C. Nonsense mutations leading to insertion of stop codons in the glycine cleavage domain of the human GLDC protein have been found in GE. In red in the zebrafish GLDC protein, the location of the CRISPR mutation. D. RT-qPCR analysis of the gldc mRNA levels, reveals a significant decrease in
gldc -/+ and -/- compared to +/+, at 7 dpf (ANOVA p=0.0002; then post-hoc, respectively p=0.0007 and
p=0.0002; N=4). E. LC-MS dosage of glycine levels in whole 7 dpf larvae reveals a significant increase in gldc -/-, but not -/+, compared to +/+ (ANOVA p=0.0017; then post-hoc, p=0.002, N=3).
30
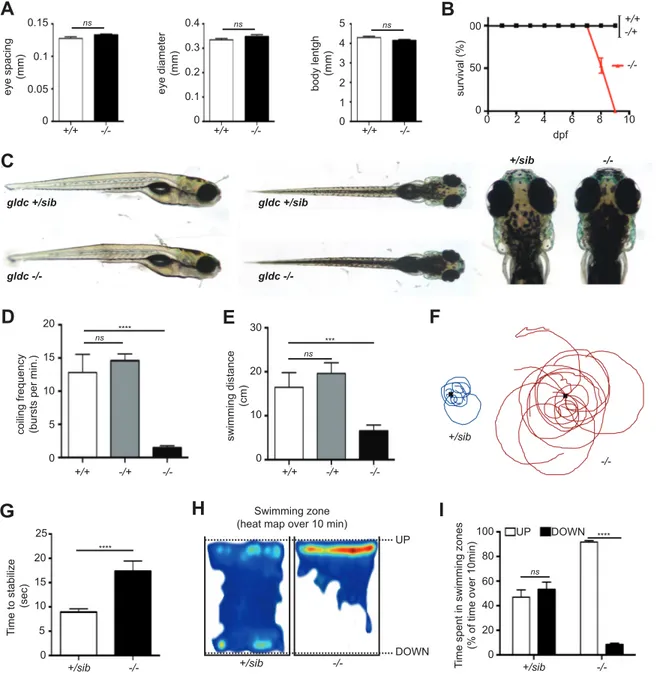
2. Gldc -/- larvae die prematurely and depict GE-reminiscent motor phenotypes We monitored the survival of the three genotypes expected upon crosses of heterozygotes fish: gldc +/+ (wild type), gldc -/+, and gldc -/-. While most of the gldc +/+ and -/+ larvae survived for the first 10 days post fertilization, all the gldc -/- larvae died between 7 and 9 dpf (fig. IV.2.A). Although there was no evident explanation for this lethality, it was interestingly reminiscent of the early death of neonates in the severe form of GE. After measuring the body length, eye size and inter-eye distance of -/- larvae compared to their siblings, we did not notice any morphological abnormalities of the mutant larvae (fig. IV.2.B). However, gldc -/- larvae from 6 dpf depict an evident hyperpigmentation, which is practical to easily separate them from the siblings (fig. IV.2.C). This hyperpigmentation phenotype segregates with the mutant alleles of gldc through multiple generations of fish, thus suggesting that, although unexpected, it is specific to gldc loss-of-function.
Since the GE patients show early motor symptoms such as hypotonia and lethargy, we analyzed the larval motor function of the gldc mutants. Spontaneous coiling is the first motor output in zebrafish embryos occurring between 17-21 hpf and consisting of frequent un-evoked movements of the tail in the chorion [25]. Analysis of this motor behavior indicated a decrease in coiling frequency of gldc -/- embryos compared to their siblings (1.46 ± 0.31, 12.81 ± 2.73; fig. IV.2.D). At the larval stage, we assayed the swimming activity of gldc mutants by recording the total distance swam over one hour. Consistently with the early impairment of motor function, we noticed a reduction of swimming activity in gldc -/- larvae at 7 dpf (650.6mm ± 138.4, 1646mm ± 332.1; fig. IV.2.E).
31
We then aimed at describing in more detail their motor phenotype in order to better compare with the human patient condition. Since hypotonia and lethargy are respectively defined as a state of low muscle tone and a lack of vigor, we tested the capacity of gldc larvae to swim against a water current. When we tracked the path swam by the larvae after applying a circular water current, as well as the time needed to immobilize in the dish (e.g. stabilize their position), we noticed abnormalities in gldc -/- behavior. Indeed, while the siblings can actively swim against the water current in order to maintain their position, gldc -/- mutants were unable to fight against it and to stabilize their position. As a result, they were passively carried through the dish by the water current in a lethargic and hypotonic fashion (see swimming tracks in fig. IV.2.F). Moreover, because of their passive hypotonic behavior, the time to stabilize their position after applying a water current is significantly increased compared to their siblings (fig. IV.2.G). Furthermore, we noticed an anomaly in the swimming balance of gldc -/- larvae. Indeed, by analyzing the time spent in the upper versus lower water section of their tank, we noticed that while the siblings are exploring their tank by swimming throughout it, most of the gldc -/- larvae float at the surface, unable to explore their environment, indicating a swimming balance impairment (fig. 3H-I). Taken together these results show that the gldc -/- mutants display motor phenotypes reminiscent of GE symptoms in human patients, such as early lethality, hypotonia, and lethargy.
32
Figure IV.2: Gldc -/- larvae die prematurely and depict GE-reminiscent motor phenotypes. A. There is no
difference in the eye spacing, eye diameter, and body length of gldc -/- (n=13) compared to +/+ (n=7). B. Gldc -/- larvae die prematurely between 7 and 9 dpf (N=3). C. There is no morphological defect in gldc -/- at 7 dpf. D.
Analysis of the frequency of spontaneous coiling of the tail at 21 hpf reveals a decrease of this behavior in gldc -/- (n=14) larvae, compared to +/+ (n=11) (ANOVA, p=0.0002). E. Analysis of the total distance swam over 1h at 7
dpf reveals a significant decrease of swimming in gldc -/- (n=23) compared to +/+ (n=10) (ANOVA, p=0.0077). F. Tracking of the position of gldc +/+ and -/- 7 dpf larvae from the center point after application of a water current (both n=15). G. Gldc -/- larvae take significantly more time to stabilize their swimming after application +/+ -/+ -/-100 50 0 dpf 2 4 6 8 10 0 +/+ -/-eye spacing (mm) 0.15 0.1 0.05 0 ns +/+ -/-0.3 0.2 0.1 0 +/+ -/-3 2 1 0 4 5 0.4 ns ns eye diameter (mm) body lentgh (mm) survival (%) C gldc +/sib gldc -/-gldc +/sib gldc -/-+/sib -/-A B +/+ -/-coiling f requency
(bursts per min.)
15 10 5 0 ns 20 swimming distance (cm) 30 20 10 0 ns **** *** -/+ +/+ -/+ -/-Swimming zone (heat map over 10 min)
+/sib -/-UP DOWN D E H +/sib -/-T ime spent in sw imming zones
(% of time over 10min)
60 40 20 0 ns 80 **** I 100 UP DOWN +/sib -/-T ime to stabilize (sec) 15 10 5 0 20 **** F 25 +/sib -/-G
33
of the water current compared to gldc +/+ (both n=15) (t-test, p=0.0008). H. Heatmap tracking of the swimming zone of 7 dpf larvae over 10 min reveals that gldc -/- larvae are swimming only in the upper part of water, whereas gldc +/+ swim in both upper and lower sections of the water (both n=10). I. Quantification of the time spent in the upper versus lower swimming zone of the water reveals that gldc -/- spend significantly more time in the upper swimming zone compared to +/+ (both n=10) (t-test, p<0.00001).
3. Metabolomics analysis indicates broad metabolic perturbations in gldc -/- larvae.
After characterizing the disease-related phenotype of gldc -/- mutants, we sought to describe the molecular mechanisms involved in pathogenicity. Since glycine acts as an essential amino-acid as well as a neurotransmitter in the CNS, we conducted a broad assay of metabolites by LC-MS in order to titrate the level of all proteinogenic and the main non-proteinogenic amino acids, as well as the main neurotransmitters, in 7 dpf gldc -/- larvae compared to their siblings. Interestingly, we found that extracts from gldc -/- larvae showed a significant increase in many amino acids other than glycine, such as sarcosine, proline, valine, cystathionine, leucine, and arginine (fig. IV.3.A). This suggests that the degradation of amino acids other than glycine is also impaired when gldc is knocked-out, which might play a role in GE pathogenesis. Moreover, we found that gldc -/- larvae depicted a significant reduction in the levels of GABA and glutamate compared to gldc +/+ (fig. IV.3.B) whereas dopamine and serotonin levels were not significantly affected. Likewise, this suggests that gldc-KO impairs the metabolism of amino-acid/neurotransmitters other than glycine.
The GCS is also involved in folate one carbon metabolism (FOCM) since by degrading glycine, gldc donates one carbon units to this metabolic cycle [8]. The output of FOCM is mainly building blocks for the cell important for growth and proliferation [23]. Interestingly,
34
Greene et al. showed that FOCM homeostasis is specifically affected in a mouse model of GLDC-KO and that this imbalance may be involved in neural tube closure defects [8]. Thus, we examined the levels of FOCM-related metabolites in gldc -/- larvae in order to check whether an imbalance in this metabolism is consistently observed in our fish model. However, LC-MS titration of different folate-related metabolites did not reveal any defect of the FOCM in gldc -/- larvae as compared to gldc +/+ (fig. IV.3.C). Finally, we also investigated the levels of lactate, since lactic acidosis is common in a number of metabolic inborn errors and has been reported in patients with GE [52-54]. We found that the levels of lactate in gldc -/- mutants were significantly increased at 7 dpf (fig. IV.3.D). Then, we checked the level of lactate, GABA, glutamate, and amino acids that were increased in gldc -/- compared to +/+ at an earlier time point to see if the defects in the amount of these compounds were already present in gldc -/-. Interestingly, whereas the levels of glycine are already increased at 2 dpf in gldc -/-, there was no difference in the levels of lactate, GABA, glutamate, and all the amino acids except sarcosine in gldc -/- and +/+ at 2 dpf (fig. IV.3.E). This suggests that there is a progressive accumulation of lactate and amino acids, and a progressive decrease in GABA and glutamate over time that might contribute to the death of mutant larvae at 7-9 dpf.
Altogether, these results demonstrate that gldc loss-of-function induces previously unknown broad metabolic perturbations. Indeed, it not only affects glycine, but also the level of other amino acids and neurotransmitters (including GABA and Glutamate), and it leads to lactic acidosis. However, no specific metabolic deficiency in the FOCM was observed suggesting that FOCM may not be directly involved in the phenotype of gldc -/- fish.
35 4 2 0 A 6 0 0.5 1 1.5 8
Fold change to WT Fold change to WT
60 40
0 20 80
Proportion of total folate (%)
B C AMINOACIDS NEUROTRANSMITTERS FOLATE METABOLITES
*
*
*
*
*
*
*
*
*
*
Taurine P-ethanolamine Aspartic acid Threonine Serine Asparagine Glutamic acid Glutamine Sarcosine Aminoadipic Proline Glycine Alanine 2-Aminobutyric Valine Saccharopine Methionine Cystathionine Isoleucine Leucine Tyrosine B-Alanine Phenotylalanine Ethanolamine Ornithine Lysine Histidine Tryptothan Arginine 3-M-Histidine Glycine GABA Glutamate 5-HT Dopamine DHF THF CH-THF CH2-THF 5m-THF CHO-THF ns ns ns ns ns ns ns nsRiché et al., Figure 4
Fold Change to WT 150 100 50 0 D 200 Lactate Fold Chan ge to WT 6 4 2 0
*
LACTATE Sarcosine Proline Glycine V aline Cystathionine Leucine Arginine GABA Glutamate Lactate*
*
-/-+/+ -/-+/+ -/-+/+ -/-+/+ -/-+/+ CHANGES AT 2 DPF E36
Figure IV.3: Metabolomics analysis indicates broad metabolic perturbations in gldc -/- larvae. A. LC-MS
analysis of the levels of the main proteogenic and non-proteogenic amino acids at 7 dpf reveals a significant increase in sarcosine, proline, glycine, valine, cysthationine, leucine, and arginine in gldc -/- compared to +/+ (n=4) (t-test, respectively, p=0.035, p=0.0062, p<0.00001, p=0.0006, p=0.0006, p=0.029, and p=0.0006). B. LC- MS analysis of the main neurotransmitter at 7 dpf reveals a significant decrease in glutamate and GABA in gldc -/- compared to +/+ (n=9) (t-test, both p<0.00001). C. LC-MS analysis of folate compounds did not reveal any difference between gldc -/- (n=6) and +/+ (n=4) at 7dpf. D. LC-MS analysis of lactate levels revealed a significant difference between gldc -/- and +/+ at 7 dpf (n=3) (t-test, p=0.05). E. LC-MS analysis at 2 dpf revealed that there is no difference in the amount of GABA, glutamate, and amino acids increased at 7 dpf (except sarcosine, t-test, p<0.001) between gldc -/- and +/+, whereas there was a significant increase in glycine levels at 2 dpf (n=3) (t-test, p<0.001).
4. Transcriptomics analysis reveals differences in the expression of cell cycle, proliferation, and metabolism-related genes in the gldc -/- mutants
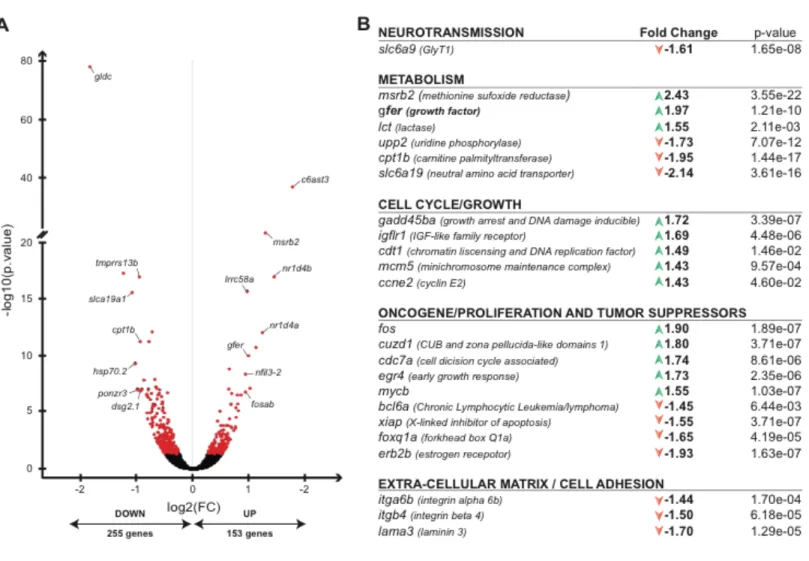
In the continuity of the unbiased metabolomics analysis in the gldc -/- mutants, we carried out a whole transcriptome analysis by deep-sequencing of RNAs extracted from 7 dpf gldc -/- and +/+ larvae. There were 408 differentially expressed genes in gldc -/- versus gldc +/+ larvae, of which 153 were up- and 255 were downregulated (fig. IV.4.A). Using gene clustering and pathway analysis from the list of significant differentially expressed genes, we identified multiple pathways whose gene expression was affected. As expected, multiple genes involved in general metabolism are mis-regulated in gldc -/- larvae. As an example, the amino acid transporter slc6a19 was downregulated in gldc -/- (Fold change: -2.14, p=3.61E-16, and its mutation in human causes a metabolic disorder of neutral amino acid transport, Hartnup disease (fig. IV.4.B) [55]. Unexpectedly, only few brain-specific genes were found differentially expressed. However, one of them, glycine transporter 1 (slc6a9), was down-regulated (Fold change: -1.61, p=1.65E-08) in gldc-/- compared to +/+, and is relevant in the context of a neurological disorder like GE.
37 In addition, genes involved in cell adhesion and the extracellular matrix (ECM), such as integrin beta 4 (Fold change: -1.5, p=6.18E-05) and laminin 3 (Fold change: -1.7, p=1.29E-05), were found downregulated in gldc -/- mutants. More interestingly, many genes involved in the cell cycle (e.g. gadd45ba; Fold change: 1.72, p=3.39E-07, as well as known oncogenes (e.g. c-fos and myc-b; Fold change: 1.9, p=1.89E-07 and Fold change: 1.55, p=1.03E-07) and tumor suppressor genes (bcl6a; - Fold change: 1.45, p=1.03E-07) were mis-regulated in gldc -/- compared to gldc +/+ larvae.
Altogether, these transcriptomic data suggest that the majority of genes whose expression is affected by GLDC-KO are related to metabolism and that, surprisingly, no major transcriptomic changes occur in the CNS. Moreover, these data pointed out that cell-cycle homeostasis may be perturbed in gldc -/- larvae suggesting that cell proliferation may be affected in gldc -/- mutants.
38
Figure IV.4: Transcriptomics analysis reveals differences in the expression of cell cycle, proliferation, and metabolism-related genes in the gldc -/- mutants. A. RNA sequencing analysis of 7 dpf larvae reveals that 408
genes are differentially expressed, with 255 up-regulated and 153 downregulated, in gldc -/- compared to +/+. B. Pathway analysis of the differentially regulated genes reveals that genes involved in metabolism, cell cycle/growth, oncogene/proliferation and tumor suppressor, extracellular matrix, and one in neurotransmission are mis-regulated in gldc -/- compared to +/+ (DESeq analysis, then filtered with False Discovery Rate adjusted at p>0.05).
39
5. The main brain networks are not affected by gldc-KO despite a transient decrease of proliferation in gldc -/- brain
The imbalance in the expression of proliferation-related genes observed in gldc -/- mutants from the RNAseq analysis led us to investigate the proliferation homeostasis in the brain throughout neurodevelopment. Moreover, a decreased proliferation at embryonic stages has been reported in a mouse model of GLDC-KO [8]. Thus, we performed immunohistochemistry (IHC) at different developmental time points (1, 3 and 7 dpf) using an antibody against the phosphorylated form of Histone 3 (pH3), which marks cells undergoing mitosis. Interestingly, this assay revealed a significant decrease in cellular proliferation in the brain of gldc -/- mutants at 3 dpf although no difference was observed at 1 dpf (fig. IV.5.A and I). However, this slight decrease in proliferation does not sustain until later stages, since no difference is observed at 7 dpf between gldc -/- and +/+ larvae (fig. IV.5.I). Since a difference in proliferation homeostasis at early stages of neurodevelopment may have an impact on the content of specific neural cell populations, we sought to investigate whether the major cell populations and/or structures of the brain neuronal networks were affected. First, we checked the general morphology of neuronal fibers in the brain of gldc -/- larvae compared to their siblings by immunolabelling acetylated tubulin (ac-Tub). No difference in the labeling of axonal tracks in the brain of gldc -/- and +/+ was observable at 24 hpf, nor later stages (4 dpf) (fig. IV.5.B). Then, we aimed at checking the structure and neural content of (i) the GABAergic network using the dlx5-6:GFP transgenic line (fig. IV.5.C) [39], (ii) glutamatergic network using the vglut2:RFP transgenic line (fig. IV.5.D) [56], (IV) the dopamine network through immunolabelling against tyrosine
![Figure I.1.1: The glycine cleavage system (GCS) reaction yields ammonia, CO2, and N 5 -N 10 -methylene tetrahydrofolate . The GCS is composed of 4 proteins: glycine decarboxylase (GLDC), tetrahydrofolate aminomethyltransferase (AMT), glycine cleavage system hydrogen carrier protein (GCSH), and lipoamide dehydrogenase (DLD). The symptoms of GE are commonly first observed during the neonatal period and are very heterogeneous among the patients [6]. This is due to the variety of mutations affecting the GCS genes, which determine whether there is residual GCS enzymatic activity. Patients with residual GCS activity develop a more attenuated form of the disease [4]. Individuals with attenuated GE often survive the neonatal period but show treatable epilepsy, spasticity, chorea, and variable developmental delay that can lead to intellectual disability [4, 6]. However, in severe GE the neonates present severe hypotonia, myoclonic jerks, lethargy and apnea due to respiratory depression, which often causes death within the first week of life. The neonates are sometimes born with brain malformations, such as hydrocephalus and](https://thumb-eu.123doks.com/thumbv2/123doknet/2041715.4782/12.918.179.730.141.514/tetrahydrofolate-decarboxylase-tetrahydrofolate-aminomethyltransferase-dehydrogenase-heterogeneous-malformations-hydrocephalus.webp)