HAL Id: hal-01724604
https://hal-mines-albi.archives-ouvertes.fr/hal-01724604
Submitted on 10 Jul 2018
HAL is a multi-disciplinary open access
archive for the deposit and dissemination of
sci-entific research documents, whether they are
pub-lished or not. The documents may come from
teaching and research institutions in France or
abroad, or from public or private research centers.
L’archive ouverte pluridisciplinaire HAL, est
destinée au dépôt et à la diffusion de documents
scientifiques de niveau recherche, publiés ou non,
émanant des établissements d’enseignement et de
recherche français ou étrangers, des laboratoires
publics ou privés.
On the thermal sensitivity and resolution of a YSZ:Er
3+ /YSZ:Eu 3+ fluorescent thermal history sensor
Stéphane Amiel, Etienne Copin, Thierry Sentenac, Philippe Lours, Yannick
Le Maoult
To cite this version:
Stéphane Amiel, Etienne Copin, Thierry Sentenac, Philippe Lours, Yannick Le Maoult. On the
thermal sensitivity and resolution of a YSZ:Er 3+ /YSZ:Eu 3+ fluorescent thermal history sensor.
Sensors and Actuators A: Physical , Elsevier, 2018, 272, p.42-52. �10.1016/j.sna.2018.01.040�.
�hal-01724604�
On the thermal sensitivity and resolution of a YSZ:Er
3+
/YSZ:Eu
3+
fluorescent thermal history sensor
Stéphane Amiel
∗, Etienne Copin, Thierry Sentenac, Philippe Lours, Yannick Le Maoult
Institut Clément Ader (ICA), Université de Toulouse, CNRS, Mines Albi, UPS, INSA, ISAE-SUPAERO, Campus Jarlard, 81013 Albi CT Cedex 09, France
Keywords: Fluorescence Thermal history sensor Phosphor
Intensity ratio Lifetime analysis Thermal resolution
a b s t r a c t
This paper deals with the problem of thermal history analysis of high temperature components for applications such as furnaces, nuclear reactors and jet engines. It focuses on fluorescent thermal history sensors, which exhibit permanent changes in their luminescence properties when exposed to high tem-perature. These changes can then be quantitatively evaluated to determine the temperature of exposure from a previous thermal event. The main objective of this paper is to investigate the thermal sensitivity and the thermal resolution of a yttria-stabilized zirconia (YSZ) Er3+-doped phosphor produced by a
sol-gel route and combined with a thermal history insensitive YSZ:Eu3+reference, which was selected for
its high sensitivity to thermal history above 1173 K. In particular, the interest of this YSZ:Er3+/YSZ:Eu3+
sensor is discussed in the view of the physical properties of sol-gel deposited YSZ coatings, the selection of an appropriate excitation wavelength and the practical measurement of coatings fluorescence prop-erties. The sensitivity and the resolution of two thermal history measurement fluorescence methods, based on intensity ratios and lifetime analysis, were determined and compared. A comparison is also made with standard non-contact temperature measurement methods such as infrared thermography and thermochromic paints.
1. Introduction
For many industrial processes in energy [1], aeronautical [2], automobile engineering [3] or in microelectronics [4], tempera-ture is a key parameter for their design, for their control and for the durability of their associated components. However, tempera-ture measurement under high heat-flux conditions and in confined environments such as furnaces, nuclear reactors and aircraft jet engines remains challenging. In particular, the use of standard on-line measurement methods (thermocouples [4], IR thermogra-phy methods [5–7], etc.) is sometimes not appropriate in harsh environments involving limited optical access and fast- moving components such as jet turbine engines [8]. Such environments require robust, reliable and non-intrusive sensors that can be used with the relevant component surface. Some type of sensors, called thermal history sensors, have the ability to record the temperature to which they are exposed during a thermal event so that anneal-ing temperatures can be extracted from a later off-line analysis at room temperature.
∗ Corresponding author.
E-mail address:stephane.amiel@laposte.net(S. Amiel).
The most widely-used thermal history sensors are ther-mochromic paints [9], which exhibit permanent changes of colour with temperature and duration of exposure. These paints are for instance used for off-line temperature determination on coated parts after running a test engine in a predefined cycle [10–12]. How-ever, the thermal resolution of such temperature-sensitive paints, which relies on the number of their discrete colour changes, varies between 10 K and more than 100 K [9]. Furthermore, some sub-stances present in the pigments are now restricted by European Union REACH regulations.
This context has led to the development of a new alterna-tive class of thermal history sensors, based on temperature-driven changes in the emission properties of fluorescent markers embed-ded within a coating [13,14]. These markers, or phosphors, are made up of an inorganic matrix containing luminescent centres, typically trivalent lanthanide ions, which have the ability to emit photons when excited at an appropriate wavelength, as a result of radiative electronic transitions. For short-time exposure to high temperature, the temperature-induced physicochemical changes occurring within a phosphor at the atomic scale can permanently modify the electronic structure of the activator ions and the radia-tive electronic transition probabilities, hence causing permanent changes in the spectral (wavelength and intensity) and temporal (decay time) fluorescence emission properties. The off-line
analy-sis at room temperature of its fluorescent properties can thus reveal the peak temperature undergone by the fluorescent sensor under stationary annealing conditions. Changes in the fluorescence char-acteristics have an advantage over colour changes, in that they are continuous and readily measurable quantitatively using standard spectroscopic equipment, making it possible to measure a continu-ous spectrum of temperature rather than temperature thresholds. Currently, crystal phase transition process [15], enhancement of crystallinity [13,14,16,17], oxidation of activator ions [18,19] and diffusion of activator or sensitizer/quencher species [14,20] are the four main thermoactivated mechanisms identified in fluorescent thermal history sensors which can cause a temperature sensitivity appropriate for thermal history sensing. Phase transitions between allotropic forms of Mn2+doped Zn3(PO4)2, synthesized by Salek
et al. [15] caused strong changes in its fluorescence emission chro-maticity in the range 873 K–1273 K, making it suitable for recording thermal history. Gonzàlez et al. [18,19,21] observed that the process of oxidation from Eu2+to Eu3+in a BaMgAl10O17is
temperature-sensitive up to 1673 K. The emission ratio built from the 445 nm and 611 nm emission lines of Eu2+and Eu3+ions after a 20 min-long
isothermal heat treatment exhibited a threefold order of magni-tude increase from 973 K to 1373 K, with repeatability of the ratio better than 10 K. On the same principle, Rabhiou et al. [18], from the same team, observed that the phosphor SrAl14O25:Eu2+/3+could
provide a dynamic range extending from 873 to 1573 K. The same authors also demonstrated that an amorphous-to-crystalline tran-sition in sol-gel synthesized Y2SiO5:Tb3+after 20 min-long heat
treatments causes a monotonic increase in fluorescence inten-sity and decay time over a temperature range from 773 K up to 1073 K, which also makes this phosphor suitable for thermal history sensing [14,16,18]. The accuracy of these phosphors, when put in suspension in a commercial binder and painted on a disk submitted to the flame of a burner for 40 min was estimated to be better than 50 K [16]. A water-based paint containing an amorphous Eu doped matrix developed by the same team also showed monotonic vari-ation in its decay time within the temperature range 373–1073 K, with excellent repeatability. Finally, other thermal history sensor coatings for high temperature based on the enhancement of crys-tallinity were also reported by Pilgrim et al. [22] (Eu3+and Dy3+
doped YAG, 573 K–1073 K) and Stenders et al. [23] (Eu3+/Tb3+doped
Y2O3, 973 K–1273 K).
Over the last few years, the Institut Clément Ader has been developing YSZ phosphors and coatings prepared by a sol-gel route for high temperature sensing in thermal barrier coatings, such as YSZ:Eu3+and YSZ:Er3+[24–26]. In particular, the latter was found
to be a suitable candidate for thermal history sensing [27]: the continuous enhancement of crystallinity of YSZ:Er3+powders
pro-duced by a sol-gel route with temperature for 15 min long heat treatments between 1173 K and 1423 K induced substantial and consistent increases of their green emission intensity and fluores-cence decay time in the ranges 1223 K–1423 K and 1173 K–1373 K respectively [27]. As shown inFig. 1, the intensity of the main emis-sion lines at 540 nm and 560 nm were indeed observed to increase with crystallinity by a factor of almost 50 after 15 min at 1423 K. These strong temperature dependencies could allow off-line tem-perature sensing with an estimated theoretical resolution for those temperatures ranging between 0.3 and 1 K and between 6 and 2 K for intensity and decay time respectively, surpassing the resolution of actual thermochromic paints in that temperature range. Prelim-inary investigations confirmed the potential of an intensity ratio approach, using a red emitting, temperature insensitive YSZ:Eu3+
reference (Fig. 1), as a robust method regarding small variations in experimental measurement conditions for future applications in off-line temperature mapping. Furthermore, the stability of the thermal exposure temperature sensing capability for relatively long time heat treatments below 973 K that was observed is expected
Fig. 1. Evolution of the relative intensity increase of the fluorescence emission of a sol-gel synthesized YSZ:Er3+powder with the temperature of exposure after 15 min
long heat treatments [27]. The position of the main emission peaks of YSZ:Eu3+,
which could be used as a reference because of its little sensitivity to temperature of exposure when fully crystallized, is also indicated.
to allow to directly co-deposit these two YSZ:Eu3+and YSZ:Er3+
phosphors as a thermal history sensing coating using sol-gel depo-sition methods such as air-spraying followed by a low temperature consolidation heat treatment (<973 K).
This paper aims to provide a more in-depth analysis of this fluo-rescent YSZ:Er3+thermal history sensor, in regards with its practical
application in the form of a coating deposited by a sol-gel process in combination with a thermal history insensitive YSZ:Eu3+
refer-ence. In particular, the interest of this YSZ:Er3+/YSZ:Eu3+coating is
discussed in the view of the physical properties of sol-gel deposited YSZ coatings, the selection of an appropriate excitation wavelength and the practical measurement of coatings fluorescence properties. The sensitivity and the resolution of a hybrid YSZ:Er3+/YSZ:Eu3+
phosphor for both an intensity ratio and lifetime analysis based approaches, determined from temperature calibration curves from earlier work [27], are investigated and compared with standard methods for measuring temperature.
2. Experimentation
2.1. Preparation of YSZ: Eu and YSZ: Er phosphor and coatings YSZ:Er3+ powder of composition (YO
1.5)0.083(ErO1.5)0.015
(ZrO2)0.902 and YSZ :Eu3+ powder of composition (YO1.5)0.078
(EuO1.5)0.02(ZrO2)0.902were synthesized by a sol-gel route using
the protocol described in reference [27]. Samples of the YSZ:Er3+
powder, in a partially crystalline state after calcination at 973 K for two hours, were further annealed for 15 min under isothermal conditions at various temperature between 1173 K and 1423 K with 50 K steps. During these heat treatments, the samples were introduced in the furnace already set at the intended temperature and were removed after 15 min and let for cooling in open air, in order to recreate conditions of thermal history sensing close to that of real applications of thermochromic paints (3–5 min) [10–12].
The YSZ:Eu3+powder, also in a partially crystalline state after
calcination at 973 K for two hours, was simply annealed for 2 h at 1373 K to ensure full crystallization [27], as this phosphor was selected to play the role of a reference with little sensitivity of its fluorescence emission properties to thermal history when further calcined for 15 min between 1173 K and 1423 K.
Finally, 20–40 !m thick YSZ:Eu3+coatings were deposited on
Ni-base super alloy coupons using a sol-gel method involving air spraying at room temperature. The coatings were then consolidated at a temperature below 973 K, before undergoing a heat treatment at 1273 K to ensure complete crystallization. Complete details of the preparation of these coatings cannot be disclosed for the sake of confidentiality.
2.2. Characterisation of fluorescence properties 2.2.1. Fluorescence excitation spectra
The excitation spectra of YSZ:Eu3+coatings and YSZ:Er3+
sin-tered disks in the spectral range between Ultra-Violet (200 nm) and near infrared wavelengths (1000 nm) were collected with a spec-tral scanning multimode reader (Varioskan, Thermo Fisher) [28,29]. The excitation wavelength was selected using a xenon flash lamp as a light source, combined to two adjustable monochromators connected serially for scanning the excitation range. The band-width selection was determined by the monochromator slit band-width. The intensity of the emission signal at a fixed wavelength, corre-sponding to an emission line of the phosphor, is collected for each excitation wavelength by a photomultiplier tube equipped with two other monochromators connected serially. The resolution of such a device is about 1 nm.
The bandwidth of the excitation window and the gain of the experimental set-up were adjusted at 5 nm and using the auto-scale function of the Varioskan (after an initial 10 ms flash used to select the correct photo-multiplier tube gain) respectively, in order to optimize the signal-to-noise ratio RS/Nof excitation peaks
without significant detrimental effect on quality and resolution of spectra. The bandwidth of the detection integration window was set to 10 nm to remain consistent with the 10 nm integrating win-dow corresponding to the bandwidth of the optical filters used for the collection of emission spectre later on. Only the excitation peaks with RS/Nvalues above 3 were considered as appropriate excitation
wavelengths [30].
2.2.2. Fluorescence emission spectra
Fluorescence emission spectra of phosphors were measured under the excitation of a frequency-doubled, continuous wave diode-pumped Nd:YAG laser irradiating at 532 nm with max-imum power of 1.1 W and a beam diameter of 1.2 mm (CNI laser) redirected to the samples using a mirror. Emission inten-sity spectra in the 400–700 nm range were collected with a USB 2000 + spectrometer (Ocean Optics, spectral resolution of 0.15 nm) equipped with an optical fibre which collecting lens was located 20 cm above the sample surface. A high-pass filter with a cut-off wavelength of 535 nm was also used to protect the spectrometer from contributions of the laser beam. The signal sensitivity to the detection angle was investigated by modifying the detection angle of the optical fibre head, defined by the angle between the viewing direction of the fibre and the normal to the sample surface.
Fluorescence emission intensity maps were measured on YSZ:Eu3+ coating specimen (26 mm × 20 mm) in order to check
thickness homogeneity. The experiments were performed with the spectral scanning multimode reader Varioskan configured with an excitation wavelength of 535 nm while measuring the intensity of the emission peak of Eu3+ions at 611 nm. The spot size for the
construction of the map was around 1 mm. 2.2.3. Fluorescence decay time
Finally, fluorescence decay-time measurements were carried out on the annealed YSZ: Er3+powder using an experimental setup
dedicated to lifetime analysis, illustrated inFig. 2. An acousto-optic modulator operating in digital mode (1250C model, Isomet), com-bined with a diaphragm, was used to generate short laser pulses
with the 1st order of the diffracted beam of the continuous 532 nm laser used previously for collecting emission spectra. A pulse gen-erator was used to control pulse duration (from 20 !s to 1 ms) and frequency (10 Hz). For all measurements, the pulse duration was finally set at 200 !s, in order to avoid phosphor saturation, and so as to obtain the maximum fluorescence signal and a stable lifetime with the pulse length. The fluorescence intensity decay after each pulse was collected with a Si photomultiplier (SensL) equipped with a narrow bandpass filter (FWHM ∼10 nm) centred on the main emission line of the phosphors investigated (560 nm for Er3+ions).
The signal was then digitized and averaged over 64 consecutive pulses with a semi-digital oscilloscope (Fluke), and post-processed using the commercial software Matlab.
Electron relaxation from an excited energy level is the result of a combination of radiative and non-radiative processes. In most cases the number of excited electrons over time can be expressed by an exponential decay. If it is assumed that the emission inten-sity is proportional to the electron population, with a lifetime that depends on the temperature viewed by the sample during a past thermal event, then the phosphor intensity decay can often be described by an exponential decay sum which is expressed by the following equation: I(t) = n
!
i=1 Ai.exp"
−!t i(T)#
n = 1, 2... (1)where Aiis the amplitude of the exponential i, t is the time and !iis
the time constant of the exponential i for the studied phosphor. The number of the exponential which parameters have to be estimated depends on the fluorescent site in the phosphor under considera-tion: in the case of two closely electronic states in the forbidden band, two non-radiative relaxation pathways can be considered, which induce two different decay rates [31]. In another way, two close emission lines could also generate two additional decay expo-nential signals. Lifetime values were therefore estimated from the fit of the experimental data using a Nonlinear Least-Square approach (NLS) [32–34] and Laplace-Padé approximation [35–37] with a theoretical mono-exponential model (Eq. (1)). Both methods gave nearly equivalent results for the parameter estimations, more particularly for a noisy signal. These algorithms appear to be robust in the case of a poor quality signal with a signal-to-noise ratio equal to 5. Therefore the two methods are reliable with close accuracy. However, the Laplace-Padé approximation appears to be faster than the least-square method, and is independent of the signal quality. Other algorithms such as the Prony method [38], modulating func-tions [39], method of the moments [40] or the Tittlebach-Helmrich method [41] were also studied, but they were not sufficiently robust for our signal analysis.
3. Results
3.1. Determination of thermal history sensing using a fluorescence intensity approach
As it can be seen inFig. 1, using an intensity-based approach would allow to take advantage of the strong sensitivity to ther-mal history of the fluorescence intensity of the YSZ:Er3+marker.
Thermal history sensing in application domains such as energy and aerospace engineering requires the capacity to perform pre-cise temperature measurements on large or complex shaped parts, for which intensity ratio methods using CCD cameras are common, efficient and robust strategies. They rely on the monitoring of the ratio of the intensity of a peak sensitive to the temperature with, for instance, the intensity of a peak that is not or only slightly sensi-tive to temperature, and which is used as a reference to determine temperature [18,42].
Fig. 2. Experimental setup used for fluorescence lifetime analysis.
In the case of YSZ:Er3+, a previous work [27] has shown that
YSZ:Eu3+fluorescence emission could play the role of a chemically
compatible reference in a YSZ:Er3+/YSZ:Eu3+ phosphor coating.
The emission spectra of YSZ:Er3+presents two emission peaks at
545 nm and 562 nm that depend on the annealing temperature (Fig. 1). In contrast, YSZ:Eu3+has two emission peaks at 590 nm and
606 nm which are weakly dependent of temperature (for 15 min heat treatments) when already in a fully crystallized state [26]. The intensity ratio method selected is therefore based on the reference YSZ:Eu3+emission peak at 606 nm (better resolved), assumed to
be little dependent of temperature in the range of interest (fully crystallized), and the temperature-dependent peaks of YSZ:Er3+
at 545 nm or 562 nm. The corresponding intensity ratio R(T) is expressed as follows (Eq. (2)):
R(T) =
$
"#1
$
IEr3+(T)(562 nm or 545 nm) "#2IEu3+(T)(606 nm)(2) with IEr3+(T) and IEu3+ are the absolute fluorescence intensities
of erbium and europium ions for the selected emission peaks, and""1 and ""2are the integration window widths (10 nm for
both peaks). In the envisioned application, YSZ:Er3+(partially
crys-tallized) and YSZ:Eu3+ (fully crystallised) powders, synthesized
separately, would be intimately mixed in appropriate proportions before deposition as a coating by a sol-gel process, so that the intensity ratio R(T) is derived from a direct reading of the absolute intensities IEr3+(T) and IEu3+. Such an intensity ratio would allow to
be independent of geometric effects such as angle distribution of fluorescence signal and coating thickness inhomogeneity, which were observed to be quite significant on the YSZ:Eu3+ coatings
deposited by a sol-gel process.
3.1.1. YSZ:Eu3+coatings: effects of thickness homogeneity and
fluorescence angle distribution
The air-spray sol-gel process that was used allowed to obtain fully crystallized, crack-free YSZ:Eu3+coatings after consolidation
and calcination at 1273 K, with various thicknesses between 20 and 40 !m. The thickness homogeneity of coatings, which could affect the quality of fluorescence intensity measurements, was evaluated with 2D intensity cartography (excitation wavelength of 535 nm). A typical spatial distribution of the fluorescence intensity of the 606 nm peak for a 26 mm × 20 mm YSZ:Eu3+coating (30 !m
average) is shown onFig. 3(a). This map shows the fluorescence inhomogeneity of the coating and underlines an emission gradient over the sample length, which illustrates the coating handing. As the coating is obtained by sol-gel deposition through air-spraying, a thickness gradient appears on the coating. From the intensities map, a profile was extracted and plotted inFig. 3(b), which confirms the inhomogeneity due to the thickness difference. This gradient
of thickness, of around 20 !m for this 30 !m thick coating, was confirmed by confocal scanning
The signal sensitivity to the detection angle is also an impor-tant issue, in particular for parts with significant curvatures like turbine blades for instance.Fig. 4shows the angle distribution of the europium fluorescence obtained on the same YSZ:Eu3+coating.
The angle $ is defined by the angle between the viewing direction of the spectrometer fibre and the normal to the sample surface. The experimental curve shows that up to a 45◦ angle the signal
is higher than 80% of the normal value. Therefore, it is estimated that for practical applications the signal quality can be maintained with a viewing angle between 0 and 30◦. For a skirting angle higher
than 30◦, the fluorescent emission falls rapidly. Working with angle
range where the signal is less sensitive to the viewing direction allows to identify geometry where a measurement correction is not necessary. Besides, for intensities ratio method, a low sensitive angle measurement ensures to work with a constant ratio which only depends to the annealing temperature.
The fluorescent angle distribution can be described by a Lam-bertian profile which is modelled by the following equation:
I
%
$&
= I (0) .cos%
$&
(3)with I(#) the fluorescent intensity at the viewing angle #. Using this law, experimental measurements in industrial processes can be corrected to find the normal intensity value, although using an intensity ratio approach eliminate the need for such a correction. The same behaviour has been observed for coating thicknesses in the range 10–40 !m and for annealing temperatures in the range 1173–1473 K. Considering the material thickness that the fluores-cence emission, collected by the detector, passes through as the optical path, this behaviour can be explained by a thickness effect: for a volume illuminated by the incident flux remaining constant, the optical path increases when the viewing angle increases, there-fore the viewing vertical depth penetration decreases. Indeed, the excitation spot can be considered as a point source with 1.2 mm diameter, which is small compared to the distance to the collection lens which is about 20 cm. For small viewing angles (observation direction close to that of the laser incidence direction), the observed volume is described by the illuminated volume, whereas for high angles the proportion of the emitted flux in the observation direc-tion is smaller due to the lower viewing depth penetradirec-tion and the flux absorption by the material.
In terms of practical applications of YSZ:Er3+/YSZ:Eu3+coatings,
it is expected that small thickness effects on the fluorescence inten-sity caused by coatings inhomogeneity and the variation of the viewing angle problem would be easily overcome by the use of an intensity ratio approach from Er3+and Eu3+emissions.
Fig. 3. (a) Intensities map of the fluorescence emission of a 30 !m average thick YSZ:Eu3+coating annealed at 1273 K, considering the emission line at 606 nm (excitation
wavelength at 535 nm), and (b) intensity profile extracted from the same intensity map in (a).
Fig. 4. Angular distribution of fluorescence emission of an average 30 !m thick YSZ:Eu3+coating annealed at 1273 K, considering the emission line at 606 nm (excitation
wavelength at 535 nm).
in the literature for air-plasma sprayed and EB-PVD YSZ coatings [43–46], and from an earlier work for sol-gel deposited YSZ coatings [26] shows that the relative difference in absorption at the wave-length of Er3+green emissions (545 nm) and of Eu3+red emissions
(606 nm) should be comprised between 5% and 20%. Therefore, the intensity ratio R(T) built from the green thermal history sensitive emission of Er3+ions and the red thermally insensitive emission of
Eu3+ions (Eq. (2)) should not be significantly impacted by thickness
inhomogeneities and for variations of the viewing angle involving small variations of the probed volume (15–20 !m). However, this might not be the case if the thermal treatment involves the forma-tion of any contaminant surface layers that might generate more significant differential attenuation at the Er3+and Eu3+emission
wavelengths, such as combustion by-products in an engine test. The selected viewing angle for our measurements is about 0◦.
3.1.2. Excitation wavelength selection
Excitation spectra of YSZ:Er3+and YSZ:Eu3+sintered disks are
shown on Fig. 5. The excitation spectrum of YSZ:Er3+ exhibits
three main excitation peaks at 380 nm, 488 nm and 515 nm, while YSZ:Eu3+main excitation peaks are at 398 nm, 467 nm and 535 nm.
In the case of a coating or a powder with several dopants, multiple excitation sources can be useful, but a common excitation source for both activators can be also defined here. Indeed, the product of the two different excitation spectra, normalized by their higher
respective peaks, leads to a general excitation spectrum, which helps to define an overall excitation source. Using the product of the normalized spectra of europium and erbium, the best excita-tion wavelength common to both dopants was identified at 535 nm (cf.Fig. 5), a little higher than the wavelength of the frequency-doubled Nd:YAG laser (532 nm) selected for fluorescence intensity measurements. This figure illustrates that the selected wavelength is close to optimal for exciting both Er3+and Eu3+.
3.1.3. Thermal sensitivity of the intensity ratio R(T)
The calculation of the ratio absolute sensitivity, which is the derivative of the calibration law relating R(T) (Eq. (2)) to tempera-ture, requires to establish the calibration curves. These calibration curves for YSZ:Er3+ and YSZ:Eu3+ powders in proportions 1:1
(molar) are plotted in Fig. 6, for annealing temperatures rang-ing from 1223 K to 1423 K. Over this range of temperature, the ratio built with the Er3+ 545 nm emission and the Er3+562 nm
emission increases by a factor of 11 and 10 respectively. These cal-ibration curves show again that the intensity ratio method is an efficient method to determine temperature with good resolution, as discussed in reference [27]. This method uses a relative inten-sity measurement rather than an absolute inteninten-sity measurement for temperature determination, thus avoiding significant sources of errors, such as geometric errors. However, the method would remain sensitive to any selective attenuation at the wavelength of
Fig. 5. Normalized excitation spectra of YSZ:Eu3+(phosphor coating) and YSZ:Er3+(sintered disk) samples annealed at 1273 K, considering the emission wavelengths of
610 nm (Eu3+) and 562 nm (Er3+). The product of the two normalized spectra is plotted as a black solid line.
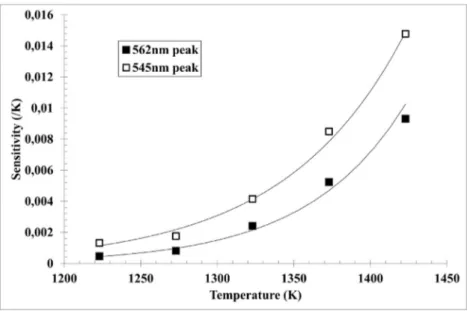
Fig. 6. Intensity ratios as a function of the annealing temperature for YSZ:Er3+sample (phosphor powder), considering two emission lines at 562 nm and 545 nm (excitation
wavelength at 532 nm). YSZ:Eu3+powder is used as a reference for calculating the ratios.
Eu3+and/or Er3+emissions by contaminant surface layers that could
potentially form during heat treatments involving a combustion environment.
The curves which express the intensity ratio as a function of the annealing temperature can be modelled with a simple mono-exponential function between 1223 and 1423 K. It should be noted that beyond 1423 K, the intensity ratio calibration curve cannot be extrapolated due to an asymptotic behaviour toward the inten-sity ratio obtained with YSZ:Er3+in its assumed final state (fully
crystallized). The derivative of the function gives the absolute sen-sitivity of the sensor material regarding thermal history, which evolution with temperature is plotted around each experimen-tal data point in Fig. 7. These sensitivity curves show that the phosphor YSZ:Er3+/YSZ:Eu3+offers a growing sensitivity with the
increase of temperature. The ratios built with the 545 nm and 562 nm wavelengths exhibit close sensitivities in spite of an ampli-tude difference. The sensitivity obtained with the Er3+emission
line at 545 nm increases from 0.001 K−1 to 0.015 K−1 whereas
with the emission line at 562 nm it increases from 0.0004 K−1 to
0.009 K−1. Since the sensitivity increases over the temperature
range 1223 K–1423 K, it appears that this YSZ:Er3+/YSZ:Eu3+
sen-sor would be especially appropriated for measuring temperatures higher than 1273 K, which are representative of the targeted indus-trial process operating temperatures (eg. gas turbines).
3.1.4. Resolution of the method (noise equivalent temperature difference)
In order to discuss the thermal resolution of this YSZ:Er3+/YSZ:Eu3+ phosphor, and to compare its performance
with other temperature measurement methods, the determina-tion of the Noise Equivalent Temperature Difference is introduced. Noise Equivalent Temperature Difference (NETD) is a classic indi-cator of the temperature resolution of a thermal radiation detector, and is often used in infrared thermography [5]. Commonly, the NETD is determined with a 303 K blackbody, from temperature absolute sensitivity and signal to noise ratio, to express infrared camera thermal resolution. In our case, the NETD calculation is extended to a higher temperature range, based on the fact that in
Fig. 7. Absolute sensitivity of the intensity ratio method as a function of the annealing temperature for YSZ:Er3+samples (phosphor powder), considering two emission lines
at 562 nm and 545 nm (excitation wavelength at 532 nm). YSZ:Eu3+powder is used as a reference for calculating the ratios (Eq. (2)).
the case of a thermal history sensor the actual measurements are made at room temperature, although the results are related to a high temperature experienced beforehand. NETD is therefore cal-culated for each experimental data point to compare the efficiency with classical thermography technics. Its expression is given by the following equation (Eq. (4)):
NETD =S%i
Ti
(4)
where %iis the standard deviation of the measured intensity
cor-responding to the thermal treatment temperature, relating to the uncertainty of the detector (spectrometer), and STi is the sensor
absolute sensitivity around the thermal treatment temperature Ti,
given by the following equation (Eq. (5)):
STi=
"
dR dT#
T=Ti (5)The evolution of the absolute sensitivity with temperature is determined using the exponential model previously identified between 1223 K and 1423 K (Fig. 7). For each temperature, the uncertainty of the detector was estimated by considering the stan-dard deviation from over the 30 averaged spectra. Since the ratio is built from the measurements of two different emission lines (for YSZ:Er3+and YSZ:Eu3+respectively), the uncertainty %
iconsidered
takes into account the standard deviation of the measurement for both phosphors.
Fig. 8shows the evolution of NETD as a function of the heat treatment temperature for the two considered intensity ratios (Er3+peaks at 545 nm and 562 nm). The NETD are first observed
to decrease from 4.9 K to a minimum value of 1.5 K between 1223 K to and 1323 K, before increasing slightly afterwards until reaching roughly 2.1 K at 1423 K. Overall, the NETD calculations between 1223 K and 1423 K give a theoretical temperature reso-lution between 1.6 K and 5 K. These NETD values will be further discussed and compared with the performance of other methods (infrared thermography and thermal indicating paints) in the Dis-cussion section.
3.2. Determination of the thermal history sensing using lifetime analysis
Previous work [27], dealing with the luminescence lifetime study of the YSZ:Er3+system (sol-gel synthesized powder), has
shown that the fluorescence lifetime of the 562 nm emission line exhibits a linear increase with the annealing temperature between 1173 K and 1373 K as a result of the enhancement of the crystallinity of the material. The decay time was observed to increase from 28 to 42 !s over this temperature range. Beyond this temperature range, this linear behaviour cannot be extrapolated since after 15 min at 1423 K the lifetime has already converged to the value obtained with the assumed fully crystallized final state (44 !s).
Since the model which describes the evolution of the lifetime with temperature is linear, the absolute sensitivity of the fluores-cence lifetime of YSZ:Er3+with the temperature is a constant value
(0.061 !s/K). As done previously with the theoretical thermal res-olution calculated for the intensity ratios (i.e. NETD, Eq. (4)), the theoretical thermal resolution is estimated considering this lin-ear model. The standard deviation of this calculation considers the general uncertainty with its enlargement coefficient expressed through the error bars onFig. 9. As shown inFig. 9, the NETD val-ues are comprised between 1.7 K–5.8 K in the temperature range 1173 K and 1373 K. As expected, the graph does not exhibit any specific NETD tendency with the sample annealing temperature, and the lowest values are obtained for 1323 K and 1373 K.
4. Discussion
YSZ:Er3+phosphor produced by a sol-gel route exhibit a strong
sensitivity of its fluorescence emission with temperature for short duration heat treatments (Fig. 1), which makes it a potential indi-cator of the temperature experienced during past thermal events. Results obtained with YSZ:Eu3+coatings shows that a sol-gel
pro-cess combined with an air-spray deposition method would be a suitable solution to deposit this YSZ:Er3+sensor for practical
mea-surement of thermal history in applications such as jet turbine engine design and testing.
As for direct measurement of temperature by phosphor ther-mometry, a typical intensity ratio approach using fully crystallized YSZ:Eu3+emission as a reference (Fig. 5) can be used to improve the
Fig. 8. NETD as a function of the annealing temperature for intensity ratios (YSZ:Er3+samples phosphor powder), considering two emission lines at 562 nm and 545 nm
(excitation wavelength at 532 nm).
Fig. 9. NETD as a function of the annealing temperature for lifetime analysis (YSZ:Er3+samples phosphor powder), considering emission line at 562 nm (excitation wavelength
at 532 nm).
directly affect absolute intensity measurements, such as thickness uniformity and angle of observation (Fig. 3 and Fig. 4). The depo-sition of the corresponding self-referenced coating would simply be achieved through the co-deposition of YSZ:Er3+and YSZ:Eu3+
powders mixed in appropriate proportions (prepared individually instead of co-doping YSZ, to avoid energy transfer between Eu3+and
Er3+ions) by air-spraying. However, results obtained with YSZ:Er3+
and YSZ:Eu3+coatings were not introduced in this paper for the sake
of confidentiality.
Alternatively, single YSZ:Er3+coatings could be applied if the
linear increase of fluorescence lifetime of Er3+ions with heat
treat-ment temperature is to be used as an indicator of thermal history instead. Although more complex to put in application than an inten-sity mapping approach, fluorescence lifetime mapping would have the advantage to make the use of the YSZ:Eu3+reference
unnec-essary and to be more robust regarding possible contamination by optically absorbing contaminant surface layers in combustion environments.
Analysis of intensity and lifetime-based calibration curves shows that NETD appears to be a useful tool for comparison between temperature measurement methods, as a formal indica-tor of the temperature resolution of the sensor for a given detecindica-tor across the whole investigated temperature range. Indeed, sensi-tivity alone does not take into account the uncertainties brought by the detector, which can significantly impact the actual resolu-tion at a given temperature. Hence, while the absolute sensitivity of the intensity ratio built from the 545 nm Er3+ emission line
steadily increase from 0.0013 K−1 to about 0.0143 K−1 over the
1223 K−1423 K range (Fig. 7), the NETD achieve a minimum of 1.5 K at 1323 K before stabilizing at around 2 K for higher temperatures (Fig. 8). This difference in behaviour is caused by the increase of the uncertainty from the detector with increasing level of intensity collected at some point: in the considered temperature range the calculated standard deviation %i increases from 0.008 to 0.0205,
which attenuates a bit the potential benefits on the thermal reso-lution of the exponentially growing sensitivity of YSZ:Er3+.
Table 1
Sensitivity and NETD of the intensity ratio and the lifetime analysis methods as a function of the temperature ranges between 1173 K and 1423 K for YSZ: Er3+samples
(phosphor powder).
Temperature (K) 1173 K 1223 K 1273 K 1323 K 1373 K 1423 K
Lifetime Analysis Sensitivity S (!s K−1) 6.10E-2 6.10E-2 6.10E-2 6.10E-2 6.10E-2 –
Relative sensitivity $ (% K−1) 0.216 0. 192 0.174 0.154 0.148 –
NETD (K) 5.8 3.5 5.7 1.7 2.3 –
Intensity Ratio (545 nm) Sensitivity S (K−1) – 1.30E-3 2.18E-3 4.89E-3 8.71E-3 1.43E-2
Relative sensitivity $ (% K−1) – 1.24 1.24 1.24 1.24 1.24
NETD (K) – 4.7 2.5 1.5 1.7 1.9
Intensity Ratio (562 nm) Sensitivity S (K−1) – 9.50E-4 1.61E-3 3.49E-3 6.05E-3 9.38E-3
Relative sensitivity $ (% K−1) – 1.18 1.18 1.18 1.18 1.18
NETD (K) – 4.9 2.7 1.7 2 2.1
Table 1show the evolution of NETD, absolute sensitivity, and relative sensitivity of intensity ratios R(T) and the lifetime ! (T) across the range 1173 K−1423 K. The relative intensity ˛(Ti) around
a given temperature Tiis defined by Eq. (6):
˛Ti= 1 A(Ti) .
"
dA dT#
T=Ti (6)where A(Ti)is the output at Tiin %/K (either the intensity ratio R or
the fluorescence lifetime !). It expresses the output increase, as a percentage of the local output A(Ti),per increment of temperature.
In the case of the intensity ratio, which follows a simple exponential model, the relative sensitivity is thus constant with temperature, while the relative sensitivity of the fluorescence lifetime, which follows a linear model, decreases with the reciprocal of lifetime. Comparing relative sensitivity values, the fluorescence lifetime appears to be much less sensitive to thermal history than the inten-sity ratios (relative sensitivity between 6 and 8 times lower), yet both methods have relatively similar NETD over the whole tem-perature range, which means that both methods would in theory produce similar temperature- resolved measurements if carried out in the same conditions than presented in this paper (punc-tual measurements). The choice of one method over the other will therefore also greatly depend on the level of complexity tolerable (for coatings preparation) and the presence of optically absorbing contaminant surface. However, the NETD results presented here cannot be extended to temperature mapping, as it will depend on the performance of the chosen detectors, likely to be different between intensity mapping and lifetime mapping.
The NETD therefore appear to be a relevant complementary metric to the sensitivity to illustrate the performance of a thermal history sensor for a given detector. For thermal history sensing in critical areas on turbine components, where knowing precisely the temperature could allow to design systems with better optimized upper limit operating temperature, NETD might become a better criteria than sensitivity for selecting the measurement method. Results have shown that for punctual measurement, YSZ:Er/Eu sen-sor would be interesting to use in critical areas subjected to the hottest temperature range in such application (close to 1473 K), because of its small theoretical resolution when compared to other methods such as thermochromic paints [11,12,47]. For areas where less precision on temperature is acceptable (eg. lower temperature range 900◦C–1000◦C), it might be less relevant though, especially
for thin coatings (potentially stained by contaminants) where low fluorescence intensity levels can be expected.
Table 2compares the thermal resolution of fluorescent methods with those of classical thermography technics, through the NETD expressions. Classic temperature measurement methods used in industrial processes are presented, such as infrared technology and thermochromic paints with their NETD [9,48–50]. In the high temperature range (above 1223 K), the fluorescent thermal sen-sors present efficient thermal resolution with an NETD lower than 5 K, but still higher than IR methods. In the temperature range
Table 2
NETD comparative table between different temperature measurement methods for various temperature ranges.
Method NETD (K) Temperature Range (K) Reference
Lifetime Analysis 2–5 1173–1373 – Intensity Ratio (540 nm) 1.5– 4.8 1223–1423 – Intensity Ratio (560 nm) 1.7–5 1223–1423 – IR Camera (8–12 !m) 0.6–0.7 1273–1473 – IR Camera (3–5 !m) 0.03–0.1 253–423 [48] IR Camera (3–5 !m) 0.3 253–1773 [49] Thermochromic Paint 10–20 423–583 [50] Thermochromic Paint 10–100 853–1253 [9]
between 253 K and 1773 K, infrared cameras (operating between 3 and 5 !m), have typically a NETD value between 0.03 K and 0.3 K. With infrared camera, if the measurement range is increased to superior temperature range, the NETD could be higher due to the decreased sensitivity of the camera. It is the result of the filter inser-tion and unchanged noise. The IR measurements performed in band III exhibit an NETD lower than 1 K with a value around 0.6 K. This value was calculated from over 300 consecutive images acquired in front of a black body to determine the standard deviation. The band II takes a higher sensitivity then the band III, however at low temperatures the signal noise is more present. The IR technology offers advantages over an online 2D surface temperature measure-ment. However, this technology is difficult to implement, due to optical access, in case of inaccessible harsh environment. Besides, the emissivity value is a main issue for infrared temperature mon-itoring. Furthermore, infrared measurements are very sensitive to reflective fluxes more particular in case of metallic surface.
Thermochromic paints give information on the maximum tem-perature history with an offline analysis, and therefore can readily be used in areas difficult to access with other methods. However, theoretical resolution are significantly less good, with “NETD” val-ues exceeding 10 K and in some cases reaching valval-ues as high as 100 K, due to the discrete nature of the colour changes used to determine temperature. In addition, this method requires a skilled operator to link colour changes with the surface temperature seen by the part during a past thermal event, which adds to the already relatively poor theoretical resolution.
Therefore, these fluorescent methods applied to the YSZ:Er3+/YSZ:Eu3+ phosphor (lifetime analysis and intensity
ratios), appear to be relevant methods to measure temperature in areas which are difficult to access, as an alternative to ther-mochromic paints. The calculated NETD, presented inTable 1, are the result of the spectral characterization of the YSZ:Er3+/YSZ:Eu3+
phosphor with punctual detectors, but other phosphors could also work in different temperature ranges with different NETDs. It should be also noted that NETD values might be very different if using 2D detectors such as cameras for temperature mapping. Thus, fluorescent thermometric methods are alternative candi-dates for temperature measurements in industrial processes in the form of coatings.
Table 3
Comparative table between the intensity ratio method and the lifetime analysis method.
Intensity Ratio Lifetime Analysis
+ ! Higher sensitivity of the two methods ! Independent of experimental conditions
! Easy to use ! Absolute measurement
! Less sensitive to surface contamination
− ! Potential dependence on experimental conditions ! Lower sensitivity
! Emission line independent of temperature required ! Knowledge required of multi exponential order in the sum ! Potential differential attenuation risk for one emission wavelength ! Constraint on the signal quality (offset, . . .)
! Constraints on the excitation source modulation 5. Conclusion
5.1. Overview
In this paper, the offline analysis of fluorescent thermal his-tory sensors has been introduced through the example of Eu3+and Er3+doped YSZ. The paper describes both spectral and temporal methods suitable for complex sample geometry. The compari-son between the intensity ratio method and the lifetime analysis method (Table 3) underlines that the first method is more sensitive to the thermal history for the studied sample.
In the temperature range 1223 K–1423 K, the YSZ:Er3+/YSZ:Eu3+
sample, with an efficient sensitivity and a thermal resolution between 2 and 5 K, appears to be a very good candidate for thermal history sensing. The lifetime analysis is more independent of exper-imental conditions and staining by contaminants than the intensity ratio method, but the low sensitivity of the method is a working limit, more particularly for temperatures higher than 1273 K where the intensity ratio method is more efficient.
These two methods offer a better theoretical resolution (esti-mated with Noise Equivalent Temperature Difference, NETD) than thermochromic paints, and appear to be easier to use because they do not need subjective colour comparison. As shown inTable 2, thermochromic paints still provide a complementary temperature sensing range from 423 to 1423 K, although with an increasing NETD with temperature. The NETD appears to be a relevant metric complementary to sensitivity for comparison of the performance of different methods, as the integration of the uncertainties brought by the detector can provide a better insight of the theoretical res-olution that can be achieved in the considered temperature range. Infrared cameras work in various harsh environments where real-time analysis with a fast acquisition frequency is major issue in surface monitoring. Consequently an optical access to the target is required. In spite of a higher NETD value, fluorescent methods still offer a large application field where they could be more suitable than IR methods, more particular in the offline analysis. In conclu-sion, the two fluorescent methods are complementary, and their applications depend on the studied material, the accuracy required and the measurement environment constraints.
5.2. Future work
The experimental setup introduced in this paper is a multipur-pose setup which is intended to perform intensity acquisition and lifetime analysis. For a better study of the excitation angle depen-dence, the excitation source can be improved using a fibered laser. By using the optical fibre, the excitation direction can easily be directed to the studied sample and allow a wide and easy range of angle.
The fluorescent thermography method can be also extended to 2D measurements for building an intensity ratio map from mea-surement at two different wavelengths. Therefore, thermal history maps could be obtained instead of punctual measurement, allowing to study large surfaces of interest as required in industrial
pro-cess involving thermal history sensing. Future work will look at the NETD that could be achieved in temperature mapping with the developed YSZ:Er3+/YSZ:Eu3+coatings. The experimental setup has
already been upgraded to install LED technology, which is used in many scientific domains [51–53]. LEDs allow a large range of wavelengths in order to study various phosphors with different excitation wavelengths. LEDs could offer source stability to obtain better measurement accuracy and the combination of several dif-ferent LEDs used with samples doped with various phosphors offers a useful modularity of the bench. The main issue with LED is the power limit in the UV range. However in visible range numer-ous wavelengths are available. The possibility for using the current diode technology as a pulsed source will be investigated.
Acknowledgements
The authors would like to thank Guillaume Pujol for his kind assistance with the materials synthesis and the deposition of the coatings. This research is included in the FRIMATT programme from Aerospace Valley with funding from OSEO, the Aquitaine & Midi-Pyrénées Regions and the department of the Ariège.
References
[1] X. Courtois, M.H. Aumeunier, M. Joanny, H. Roche, F. Micolon, S. Salasca, C. Balorin, M. Jouve, IR thermography diagnostics for the WEST project, Fusion Eng. Des. 89 (2014) 2472–2476,http://dx.doi.org/10.1016/j.fusengdes.2014. 01.022.
[2] J. Douglas, C.A. Smith, S.J.R. Taylor, An Integrated Approach to the Application of High Bandwidth Optical Pyrometry to Turbine Blade Surface Temperature Mapping, IEEE, 1999,http://dx.doi.org/10.1109/ICIASF.1999.827143, pp. 4/1-4/6.
[3] J. Thevenet, M. Siroux, B. Desmet, Measurements of brake disc surface temperature and emissivity by two-color pyrometry, Appl. Therm. Eng. 30 (2010) 753–759,http://dx.doi.org/10.1016/j.applthermaleng.2009.12.005. [4] M. Kuball, G.J. Riedel, J.W. Pomeroy, A. Sarua, M.J. Uren, T. Martin, K.P. Hilton,
J.O. Maclean, D.J. Wallis, Time-resolved temperature measurement of AlGaN/GaN electronic devices using micro-raman spectroscopy, IEEE Electron. Device Lett. 28 (2007) 86–89,http://dx.doi.org/10.1109/LED.2006.889215. [5]G. Gaussorgues, La thermographie infrarouge: principes, technologies,
applications, in: rev. et augm, 4. éd., Tec & Doc, Paris, 1999.
[6] H. Kasem, J. Thevenet, X. Boidin, M. Siroux, P. Dufrenoy, B. Desmet, Y. Desplanques, An emissivity-corrected method for the accurate radiometric measurement of transient surface temperatures during braking, Tribol. Int. 43 (2010) 1823–1830,http://dx.doi.org/10.1016/j.triboint.2010.01.015. [7] T. Loarer, J.-J. Greffet, M. Huetz-Aubert, Noncontact surface temperature
measurement by means of a modulated photothermal effect, Appl. Opt. 29 (1990) 979,http://dx.doi.org/10.1364/AO.29.000979.
[8] T. Sentenac, R. Gilblas, D. Hernandez, Y. Le Maoult, Bi-color near infrared thermoreflectometry: a method for true temperature field measurement, Rev. Sci. Instrum. 83 (2012) 124902,http://dx.doi.org/10.1063/1.4769802. [9] C. Lempereur, R. Andral, J.Y. Prudhomme, Surface temperature measurement
on engine components by means of irreversible thermal coatings, Meas. Sci. Technol. 19 (2008) 105501,http://dx.doi.org/10.1088/0957-0233/19/10/ 105501.
[10]J.R. Chamberlain, Temperature Indicating Paint and Method of Preparing a Specimen With the Same, Brevet US5008136 (A), 1991.
[11]E. Hodgkinson, H. Watson, Temperature Indicating Paint, Brevet US6673271 (B2), 2004.
[12]M. Hughes, Temperature Indicating Paint, Brevet US8012375 (B2), 2011.
[13] J.P. Feist, J.R. Nicholls, A.L. Heyes, F.J. Peter, J.R. Nicholls, A.L. Heyes, Determining Thermal History of Components, 2008,https://www.google. com/patents/US20110069735(Accessed September 15, 2016).
[14] A. Rabhiou, J. Feist, A. Kempf, S. Skinner, A. Heyes, Phosphorescent thermal history sensors, Sens. Actuators Phys. 169 (2011) 18–26,http://dx.doi.org/10. 1016/j.sna.2011.04.022.
[15] G. Salek, A. Demourgues, V. Jubera, A. Garcia, M. Gaudon, Mn2+ doped Zn3(PO4)2 phosphors: irreversible thermochromic materials useful as thermal sensors, Opt. Mater. 47 (2015) 323–327,http://dx.doi.org/10.1016/j. optmat.2015.05.049.
[16] A.L. Heyes, A. Rabhiou, J.P. Feist, A. Kempf, Thermal History Sensing With Thermographic Phosphors, 2013, pp. 891–896,http://dx.doi.org/10.1063/1. 4821412.
[17] J.P. Feist, S. Karmakar Biswas, C.C. Pilgrim, P.Y. Sollazzo, S. Berthier, Off-line temperature profiling utilizing phosphorescent thermal history paints and coatings, J. Turbomach. 137 (2015) 101003,http://dx.doi.org/10.1115/1. 4030259.
[18] A. Rabhiou, A. Kempf, A. Heyes, Oxidation of divalent rare earth phosphors for thermal history sensing, Sens. Actuators B Chem. 177 (2013) 124–130,http:// dx.doi.org/10.1016/j.snb.2012.10.012.
[19] Á.Y. González, S. Skinner, F. Beyrau, A.L. Heyes, Reusable thermal history sensing via oxidation of a divalent rare earth ion-based phosphor synthesized by the sol–gel process, Heat Transf. Eng. 36 (2015) 1275–1281,http://dx.doi. org/10.1080/01457632.2015.994998.
[20] Y. Lan, H. Wang, N. Skula, X. Chen, Y. Lu, G. Chen, Z. Ren, Determination of thermal history by photoluminescence of core-shelled quantum dots going through heating events, part, Part. Syst. Charact. 32 (2015) 65–71,http://dx. doi.org/10.1002/ppsc.201400100.
[21] Á. Yá˜nez-González, E. Ruiz-Trejo, B. van Wachem, S. Skinner, F. Beyrau, A. Heyes, A detailed characterization of BaMgAl10O17: Eu phosphor as a thermal history sensor for harsh environments, Sens. Actuators Phys. 234 (2015) 339–345,http://dx.doi.org/10.1016/j.sna.2015.09.020.
[22] C.C. Pilgrim, A.L. Heyes, J.P. Feist, Thermal history sensors for non-destructive temperature measurements in harsh environments, in: AIP Conf. Proc., AIP Publishing, 2014, pp. 1609–1616,http://dx.doi.org/10.1063/1.4865016. [23] D. Stenders, B. Atakan, I. Karadagli, C. Pflitsch, Sol-gel deposited
thermographic phosphors as possible thermal history coatings, in: Institution of Engineering and Technology, 2014, pp. 2.2,http://dx.doi.org/10.1049/cp. 2014.0537.
[24] L. Pin, C. Pilgrim, J. Feist, Y. Le Maoult, F. Ansart, P. Lours, Characterisation of thermal barrier sensor coatings synthesised by sol–gel route, Sens. Actuators Phys. 199 (2013) 289–296,http://dx.doi.org/10.1016/j.sna.2013.03.022. [25] É. Copin, T. Sentenac, Y. Le Maoult, F. Blas, F. Ansart, V. Vidal, P. Lours,
Feasibility of luminescent multilayer sol-gel thermal barrier coating manufacturing for future applications in through-thickness temperature gradient sensing, Surf. Coat. Technol. 260 (2014) 90–96,http://dx.doi.org/10. 1016/j.surfcoat.2014.08.077.
[26] E. Copin, Fonctionnalisation de barrières thermiques aéronautiques YSZ issues de la voie sol-gel : mesure de température et diagnostic de L’endommagement par fluorescence, phdthesis, Ecole Nationale Supérieure des Mines d’Albi-Carmaux, 2015, https://tel.archives-ouvertes.fr/tel-01304767/document(Accessed September 15, 2016).
[27] E.B. Copin, X. Massol, S. Amiel, T. Sentenac, Y.L. Maoult, P. Lours, Novel erbia-yttria co-doped zirconia fluorescent thermal history sensor, Smart Mater. Struct. 26 (2017) 015001,http://dx.doi.org/10.1088/0964-1726/26/1/ 015001.
[28] M. Raitio, J. Lampinen, International Calibration System of Thermo Scientific Varioskan Flash with Improved Sensitivity, Accuracy and Dynamic Range, (n.d.).
[29] Varioskan Flash, (n.d.).
[30]J. Max, J.-L. Lacoume, Méthodes et techniques de traitement du Signal, Dunod, Paris, 2004.
[31] S. Berciaud, L. Cognet, B. Lounis, Luminescence decay and the absorption cross section of individual single-walled carbon nanotubes, Phys. Rev. Lett. 101 (2008),http://dx.doi.org/10.1103/PhysRevLett.101.077402.
[32] A.A. Istratov, O.F. Vyvenko, Exponential analysis in physical phenomena, Rev. Sci. Instrum. 70 (1999) 1233,http://dx.doi.org/10.1063/1.1149581. [33] N. Fuhrmann, J. Brübach, A. Dreizler, On the mono-exponential fitting of
phosphorescence decays, Appl. Phys. B. 116 (2014) 359–369,http://dx.doi. org/10.1007/s00340-013-5700-2.
[34] J. Brübach, J. Janicka, A. Dreizler, An algorithm for the characterisation of multi-exponential decay curves, Opt. Lasers Eng. 47 (2009) 75–79,http://dx. doi.org/10.1016/j.optlaseng.2008.07.015.
[35] E.H. Hellen, Padé–Laplace analysis of signal averaged voltage decays obtained from a simple circuit, Am. J. Phys. 73 (2005) 871,http://dx.doi.org/10.1119/1. 1927551.
[36] Claverie, Szpiro, Topol, Identification des modèles à fonction de transfert: la méthode padé-transformée en z, Ann. DÉconomie Stat. 145 (1990),http://dx. doi.org/10.2307/20075776.
[37] Z. Bajzer, J.C. Sharp, S.S. Sedarous, F.G. Prendergast, Padé-Laplace method for the analysis of time-resolved fluorescence decay curves, Eur. Biophys. J. 18 (1990),http://dx.doi.org/10.1007/BF00183269.
[38] Z. Zhang, K.T.V. Grattan, Y. Hu, A.W. Palmer, B.T. Meggitt, Prony’s method for exponential lifetime estimations in fluorescence-based thermometers, Rev. Sci. Instrum. 67 (1996) 2590,http://dx.doi.org/10.1063/1.1147219. [39] J. Ortin, V. Torra, T. Castan, E. Cesari, Thermogenesis: identification by means
of modulating functions, Thermochim. Acta 70 (1983) 123–131,http://dx.doi. org/10.1016/0040-6031(83)80186-5.
[40] I. Isenberg, R.D. Dyson, R. Hanson, Studies on the analysis of fluorescence decay data by the method of moments, Biophys. J. 13 (1973) 1090–1115,
http://dx.doi.org/10.1016/S0006-3495(73)86047-3.
[41] K. Tittelbach-Helmrich, An integration method for the analysis of multiexponential transient signals, Meas. Sci. Technol. 4 (1993) 1323–1329,
http://dx.doi.org/10.1088/0957-0233/4/12/003.
[42] A.H. Khalid, K. Kontis, Thermographic phosphors for high temperature measurements: principles, current state of the art and recent applications, Sensors 8 (2008) 5673–5744,http://dx.doi.org/10.3390/s8095673. [43]J.I. Eldridge, T.J. Bencic, S.W. Allison, D.L. Beshears, Depth-penetrating
temperature measurements of thermal barrier coatings incorporating thermographic phosphors, J. Therm. Spray Technol. 13 (2004) 44–50.
[44] L. Yang, D. Peng, C. Zhao, C. Xing, F. Guo, Z. Yao, Y. Liu, X. Zhao, P. Xiao, Evaluation of the in-depth temperature sensing performance of Eu- and Dy-doped YSZ in air plasma sprayed thermal barrier coatings, Surf. Coat. Technol. 316 (2017) 210–218,http://dx.doi.org/10.1016/j.surfcoat.2017.03. 029.
[45]C.C. Pilgrim, J.P. Feist, A.L. Heyes, On the effect of temperature gradients and coating translucence on the accuracy of phosphor thermometry, Meas. Sci. Technol. 24 (2013) 105201.
[46]C.C. Pilgrim, S. Berthier, J.P. Feist, A.L. Heyes, High resolution erosion detection in thermal barrier coatings using photoluminescent layers, Surf. Coat. Technol. 232 (2013) 116–122.
[47] H.M.L. Watson, Temperature indicating paint, US6682665 B2, 2004.http:// www.google.fr/patents/US6682665(Accessed February 21, 2016). [48] M. Vollmer, K.-P. Möllmann, Infrared thermal imaging: fundamentals, in:
Research and Applications, Wiley-VCH Verlag GmbH & Co. KGaA, Weinheim, Germany, 2010,http://dx.doi.org/10.1002/9783527630868(Accessed September 15, 2016).
[49]J. ˇSafránková (Ed.), 22nd Annual Conference of Doctoral Students, WDS’13 “Week of Doctoral Students 2013, Faculty of Mathematics and Physics, Charles University in Prague, Czech Republic, June 4, 2013 - June 7, Matfyzpress, Praha, 2013, 2013 [proceedings of contributed papers]. Pt. 2: Physics of plasmas and ionized media.
[50]K. Azar, Thermal Measurements in Electronics Cooling, CRC Press, 1997.
[51] J. Xu, Y. Xiong, S. Chen, Y. Guan, A lamp light-emitting diode-induced fluorescence detector for capillary electrophoresis, Talanta 76 (2008) 369–372,http://dx.doi.org/10.1016/j.talanta.2008.03.027.
[52] N. Ryˇskeviˇc, S. Jurˇs ˙enas, P. Vitta, E. Bakien ˙e, R. Gaska, A. ˇZukauskas, Concept design of a UV light-emitting diode based fluorescence sensor for real-time bioparticle detection, Sens. Actuators B Chem. 148 (2010) 371–378,http://dx. doi.org/10.1016/j.snb.2010.05.042.
[53] S. Ek, B. Anderson, S. Svanberg, Compact fiber-optic fluorosensor employing light-emitting ultraviolet diodes as excitation sources, spectrochim, Acta Part. B At. Spectrosc. 63 (2008) 349–353,http://dx.doi.org/10.1016/j.sab.2007.11. 026.
![Fig. 1. Evolution of the relative intensity increase of the fluorescence emission of a sol-gel synthesized YSZ:Er 3+ powder with the temperature of exposure after 15 min long heat treatments [27]](https://thumb-eu.123doks.com/thumbv2/123doknet/12414954.333220/3.892.475.839.117.405/evolution-relative-intensity-increase-fluorescence-synthesized-temperature-treatments.webp)