Advanced Therapy Learning Algorithm for Spinal
Cord Stimulation
by
Amanda Dawn Gaudreau Balderrama
B.S. Electrical Engineering
Massachusetts Institute of Technology (2009)
MASSACHUSETTS INSTITUTE OF TECHNOLOGY
DEC 16
2010
LIBRARIES
ARCHIVES
Submitted to the Department of Electrical Engineering and Computer
Science in partial fulfillnment of the requirements for the degree of
Master of Engineering in Electrical Science and Engineering
at the
MASSACHUSETTS INSTITUTE OF TECHNOLOGY
September 2010
@
Massachusetts Institute of Technology 2010.
Author
...
CDepartment
All rights reserved.
1 A A
.
...
of Electrical Engineering and Computer Science
August 20. 2010
Certified by...
...
...
Dr. Collin M-1. Stultz. MD
W. M. Keck Associate Professor of Biomedical Engineering
Thesis
Supervisor
C ertified by
...
. . . ...
Eric Panken
Scientist. Medtronic,
Inc.
-
Neuromodulation
I -~
Thesis Supervisor
A ccepted by ...
...
Dr. Christopher J. Terman
Chairman, Department Committee on Graduate Theses
Advanced Therapy Learning Algorithm for Spinal Cord
Stimulation
by
Amanda Dawn Gaudreau Balderrama
B.S. Electrical Engineering
Massachusetts Institute of Technology (2009)
Submitted to the Department of Electrical Engineering and Computer Science
on August 20, 2010, in partial fulfillment of the
requirements for the degree of
Master of Engineering in Electrical Science and Engineering
Abstract
Spinal Cord Stimulation (SCS) is a technique used to treat chronic pain and has
been shown to be an effective method of treatment, both financially and
socioeco-nomically. Stimulating electrodes are surgically implanted into the epidural space,
outside the dura, a protective sac filled with cerebral spinal fluid (CSF) surrounding
the spinal cord. The thickness of the CSF changes according to body orientation,
causing the distance between the stimulating electrodes and the spinal cord to vary.
This phenomenon has been reported to cause painful or ineffective stimulation. In
order to detect postural behavior and adjust SCS parameters accordingly, a tri-axial
accelerometer based algorithm has been developed. The algorithm enables patients
to adjust stimulation therapy parameters real-time, associates the patient indicated
parameters with a vector, and stores them in a therapy library. Stimulation therapy
parameters are then automatically selected by classifying incoming TA data according
to the vectors in the therapy library, providing individualized, closed-loop stimulation
therapy.
Thesis Supervisor: Dr. Collin M. Stultz, MD
Title: W. M. Keck Associate Professor of Biomedical Engineering
Thesis Supervisor: Eric Panken
Acknowledgments
Medtronic's commitment to improving the quality of life for people suffering with life-threatening diseases and conditions is extremely prevalent and inspiring. Their contribution to my experience at MIT has been invaluable. I would like to thank the corporation as a whole for giving me this opportunity and for supporting the VI-A program, which has made a huge impact on my aspirations, achievements, and future.
I am in debt to the many who made my experience at Medtronic so memorable
and productive, especially my advisor Eric Panken. Eric's abundant support and insightful guidance were vital to the development of this thesis. In addition, I would like to extend my gratitude to Lynn Davenport, Tim Dennison, Elizabeth Fehrmann, Justin Kemp, Dave Linde, Nicholas Mairs, and Dennis Skelton, who each offered me their own wealth of knowledge. These people contributed immensely to the devel-opment of this project and are fondly remembered for their continual support and willingness to help.
I would also like to thank my most influential professors at MIT, my thesis
ad-visor Professor Collin Stultz, and my academic adad-visor Professor George Verghese. Professor Stultz first ignited my passion for Biomedical Engineering in 6.022 - Organ Transport Systems. Since then, his expertise and understanding have gone a long way in my career at MIT. Professor Verghese's unending support and encouragement were undoubtedly one of the essential elements in helping me achieve my goals. I could not count the times he helped me nor can I measure my gratitude for all of his
benefaction.
Finally, and most importantly, I would like to thank my family, friends, and boyfriend for all they have done to support me. Mom, Christina, Jeromey and Jessica,
I could not have made it through MIT without my periodic visits home filled with
games, laughter and love. David, if any of this were possible without you, I know it would not have been worth as much, or have been as enjoyable. To my friends in "Toys-R-Us" and Ame, thank you for filling my life with more than just problem sets. Thank you all for giving my work meaning and for loving me through the difficulties.
Contents
1 Introduction 11
2 Background 15
2.1 Spinal Cord Stimulators . . . . 15
2.2 Physiological Motivation for Body Orientation Based Stimulation . . 18
2.3 Body Orientation Based Algorithm for Stimulation (BOBAS) using an Accelerometer... . . . . . . . ... 19
2.4 Description of Study Data . . . . 22
2.4.1 Three-day Qualification Protocol... . . . . . . .. . 22
2.4.2 In-clinic Validation Protocol... . . . . . . . 26
3 Adaptive Therapy Learning Algorithm for Stimulation (ATLAS) 29 3.1 System Overview . . . . 30
3.2 Data Association: Mapping of Therapy Parameters to a Position Vector 34 3.3 Library Modification: Redefinition of Therapy Vector Space . . . . . 39
3.4 Data Classification: Selection of Stimulation Therapy Parameters . . 41
4 Assessment of Algorithm Functionality 43 4.1 Effects of Parameters on Data Association Vectors and Therapy Library 43 4.1.1 Parameter Screening Using Design of Experiment . . . . 44
4.1.2 Effect of Dlibmod on Therapy Library . . . . 54
4.2 ATLAS versus BOBAS Comparisons . . . . 61
4.2.2 Computational Complexity.... . . . . . . ... 65
5 Conclusion
69
A Glossary
73
B MATLAB Scripts
77
B.1
ATLAS Main Function ... ... 77B.2 Data Association Function ... 81
B.3
Library Modification Function . .... ... 83List of Figures
2-1 Electrode types and SCS system. . . . . 2-2 Physiological views of SCS implant location...
2-3 Spinal cord movement due to posture. . . . .
2-4 Temporal and spatial representation of orientation vectors. .
2-5 BOBAS three-space partitioning. . . . . 2-6 Study ambulatory data recording device... ... 2-7 Activity log input versus changes in posture and stimulation
parameter levels... . . . . . . . . 3-1 3-2 3-3 3-4 4-1 4-2 4-3 4-4 4-5 4-6
Three function state diagram of ATLAS . . .
Detailed state diagram of ATLAS . . . .
ATLAS time based main script architecture
Data association function flowchart . ...
therapy
. . . . 31
. . . . 32
. . . . 34
. . . . 38
Design of experiment entry spread calculation. . . . . 48
DoE main effect plots for
f(assoc)
responses. . . . . 51DoE interaction plots for
f(assoc)
responses. . . . . 53Effect of Dlod on number of therapy library entries. . . . . 55
Effect of Dlibmod on entry spread. . . . . 57
3D library entry vref locations for subject 106 and large Dlibmod. . . . 58 4-7 3D library entry vref locations for subject 207 and using operating
4-8 ATLAS misclassification of face up as hysteresis using ICdata. . . . . 4-9 ATLAS misclassification of left as face up using ICdata. . . . .
Chapter 1
Introduction
Implantable Neurostimulators (INSs) are a broad class of devices used to treat a variety of neuropathological conditions using electrical stimulation. By stimulating different target nerves or regions in the brain, INSs can be used to improve a variety of conditions including sleep apnea [1], chronic headaches [2], and chronic pain [3]. The most basic understanding of the therapeutic effect induced by an INS is that the electrical pulse generated disrupts or blocks pathological nerve signals thereby reducing symptoms associated with the disease being treated. Therapeutic effects of neurostimulation include reduction of tremor in Parkinson's Disease patients, preven-tion of seizures in epilepsy patients, and pain relief by induced paresthesia in chronic
pain patients.
INSs require a defined set of stimulation therapy parameters (STPs) to specify various aspects of the electrical stimulation, such as pulse width, frequency, voltage (or current) amplitude, and electrode configuration. The exact correlation between stimulation therapy efficacy and STPs is still not completely understood for many INS applications, such as with deep brain stimulation [4] and spinal cord stimulation [5]. Often times, programming of these devices is done via trial and error [6], and is an arduous task for both clinician and patient [7]. In the field of spinal cord stimulation
(SCS), various theoretical models [8] and automated methods [7] have been designed
to aid with initial STP selection and electrode configuration based on surgical lead position and patient feedback. Selecting appropriate lead configurations such that the
paresthesia induced by the device is concordant with painful regions is the definition of success for this therapy therapy [9].
The "single most important factor" which dictates the magnitude of the pulse required to produce a therapeutic effect (in terms of energy delivered to the spinal cord) is the distance between the stimulating electrodes and the neural structures being targeted in the spinal cord [5]. Various researchers have found that the difference between the stimulation amplitudes required to elicit therapeutic responses in upright versus supine postures to be statistically significant [10] [11] [12]. Methods developed for compensating for these variations in distance between the stimulating electrodes and the neural target include constant current models [12] and ultrasonic distance detection [13]. The former has been deemed an ineffective method, as impedance does has no statistically significant dependence on posture [9], and the latter has not been fully developed and decreases battery life of the device by approximately 20%.
A SCS device which 1) accommodates for changes in STPs over time and 2)
au-tomatically adjusts STPs according to distance between the stimulating electrodes and the spinal cord, had not be developed until recently. A device designed to meet these unmet needs has been underway at Medtronic. Since the position of the spinal cord in the spinal column has been found to vary based on body orientation [14],
Medtronic assessed the feasibility of detecting five basic postures using a single,
tri-axial accelerometer (TA). The TA provides information about a patient's posture,
which is then used to automatically select appropriate STPs. This concept has lead to the development of a newly emerging, closed-loop SCS, currently commercially
released in Europe and under clinical investigation in the US.
The work described in this thesis is an extension of the TA based posture detection algorithm developed by Medtronic. Instead of using five, predefined postures to select
STPs, the proposed algorithm allows patients to indicate STPs at any given time.
The algorithm associates the information with a vector in three-space, and uses the
information to automatically administer stimulation therapy for future TA data. This
method allows patients to develop their own closed-loop SCS therapy such that it
uniquely suits their therapy needs.
Chapter 2 provides a basic background on SCS systems and spinal cord physi-ology. It also describes the relevant research supporting the development of body orientation based SCS systems. The body orientation based algorithm for stimula-tion (BOBAS) developed by Medtronic is outlined, and details regarding the data available for assessing the performance of the algorithm developed in this thesis is also described. Chapter 3 explains the functional aspects of the Advanced Therapy Learning Algorithm for Stimulation (ATLAS) and the parameters involved in defin-ing an individualized stimulation therapy plan. The performance of ATLAS in terms of defined objectives and comparisons with BOBAS are presented in Chapter 4. A summary of the optimal algorithm implementation is given in Chapter 5, along with suggestions for future work.
Chapter 2
Background
This chapter gives the basic information necessary for understanding the develop-ment of the Adaptive Therapy Learning Algorithm for Stimulation (ATLAS). First, the history, basic functional components, and implantation of a spinal cord stimu-lation system will be presented. A discussion of the research which motivated the development of a posture detection algorithm will follow. The current closed-loop algorithm developed by Medtronic will then be described in detail. Finally, the study data used to design the algorithm developed in this thesis will be discussed.
2.1
Spinal Cord Stimulators
Spinal cord stimulation (SCS) is an effective technique used to treat a variety of chronic pain conditions including failed back syndrome, degenerative disk disease, and complex regional back syndrome [15] [16] [17]. In 1965, Melzack and Wall's Gate
Control Theory of Pain proposed that transmission of pain is performed by central
transmission cells which relay pain signals to the brain [18]. This theory lead to the first experiment attempting to treat pain by means of percutaneous epidural spinal cord stimulation in 1967, conducted by Shealy et al [19]. This experiment, though followed shortly by death of the patient due to an undiagnosed bacterial infection in the brain, demonstrated that SCS was a feasible and effective technique for pain management. Since then, advancements in surgical techniques, stimulation methods,
and device designs have transformed SCS therapy from an extremely risky procedure to an effective alternative for pain management [3].
Despite the risks associated with the therapy [20], it has been found to improve quality of life in the long term [21]. With proper patient selection and surgical techniques, SCS has been identified as an effective method for pain management, leading to a reduction in pain and increased patient satisfaction when compared to conventional medical management alone [22]. In addition, SCS has been found to reduce the net per patient cost when compared to conventional pain management treatments [23].
As shown in Figure 2-1(b), a SCS is an IPG with one or more insulated conductive lead wires connected to it. At the end of the lead wire, a lead with exposed conductive electrodes delivers the electrical impulse from the IPG to the spinal cord. As shown in Figure 2-1(a), the number, shape and size of lead and electrodes varies. The lead is implanted beneath the lamina, into the epidural space (Figure 2-2(a)), either via a laminectomy or through percutaneous needles depending on the lead design [24][25]. The other end of the lead wire is attached to the IPG (Figure 2-2(b)). The IPG is typically implanted in the lower abdominal or gluteal region (Figure2-2(c)), and generates an electrical pulse which is then sent to the spinal cord via the stimulating electrodes. The electrical pulse interrupts the pain signal to the brain and replaces it with a tingling sensation known as paresthesia [12].
The parameters of the electrical impulse generated by the IPG are called stimula-tion therapy parameters (STPs). STPs include pulse width, rate, voltage or current amplitude, and electrode configuration. In addition, the SCS can be programmed to cycle through multiple programs, where each program may have electrondes config-ured to target different pain regions. The anode-cathode configuration of the elec-trodes can also be specified as a means of steering the electric field generated to achieve different therapeutic effects. STPs are set by a clinician shortly after implan-tation [24] [12]. Recent SCS systems come with a patient programmer (PP), shown in Figure 2-1(c). The PP allows patients to adjust their STPs outside of the clinic. While the PP does improve the overall efficacy of a patient's SCS therapy, it still requires
(a) (b) (c)
Figure 2-1: (a) Percutaneous type lead with eight-electrodes (top left) and paddle
type lead with two, eight-electrode arrays (bottom right)
-
Courtesy of Boston
Sci-entific. (b) SCS device, RestoreUltra
-
Courtesy of Medtronic. (c) MyStim Patient
Programmer - Courtesy of Medtronic.
patients to manually change STPs whenever the SCS therapy is either not masking
pain, or worse, causing uncomfortable or painful stimulation. Medtronic was among
the first companies to incorporate closed-loop functionality into their SCS system,
aiming to reduce patient burden and improve patient's quality of life.
-had L-electrode --lamina -lamioomy k -wireslead yield Crpc (a) (b) (c)
Figure 2-2: The "T#" identifies the Thoracic Vertebrae. (a) Sagittal view of
elec-trode placement
-
Courtesy of Mayfield Clinic. (b) Posterior view of electrode
place-ment
-
Courtesy of Mayfield Clinic. (c) Overall view of SCS device placement
-Courtesy of Neuron Medical Art.
2.2
Physiological Motivation for Body Orientation
Based Stimulation
Originally, SCS leads were placed subdurally, resulting in a high degree of risk and
morbidity associated with the therapy. To mitigate these detrimental factors, leads
were instead placed in the dorsal epidural space [18]. Coupled with the prevalent
use of percutaneous electrodes rather than paddle type electrodes, this meant that
a less invasive surgery could be used to implant the electrodes using a percutaneous
needle [26]. While this made SCS a more viable technique for treating chronic pain,
it also introduced other technical challenges. Because of the distance separating the
electrodes from the neural target - namely, the transmitter systems in the dorsal
horns [27] - the varying thickness of the dorsal cerebral spinal fluid layer changes
the effective electric field received at the target location. In addition to the varying
thickness of the cerebral spinal fluid depending on spinal level [8], body orientation has
been shown to change the position of the spinal cord in the spinal column [9][13][28].
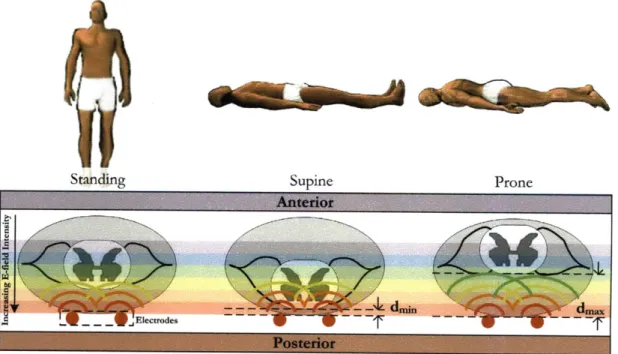
Standing
Supine
Prone
Electrodes
Figure 2-3: Spinal cord movement in the spinal column due to body orientation.
going from standing to supine. Since the distance between the spinal cord and the stimulating electrodes is decreased, this causes an effective increase in the electric field intensity and could lead to a painful or shocking sensation [12]. The difference between the therapeutic stimulation voltage required for upright versus supine postures has been found to be statistically significant [11][10]. To compensate for the adjusted stimulation level required to elicite a therapeutic effect, Medtronic developed a Body Orientation Based Algorithm for Stimulation which uses a tri-axial accelerometer to detect five basic postures. Based on these posture detections, the stimulation therapy parameters (STPs) are automatically adjusted to patient preferred levels for each posture, mitigating the likelihood of over-stimulation.
2.3
Body Orientation Based Algorithm for
Stimu-lation (BOBAS) using an Accelerometer
Motivated by the literature suggesting a statistically significant difference between standing and supine stimulation voltages, Medtronic developed a body orientation based algorithm for stimulation (BOBAS) which could reliably detect five basic pos-tures: standing upright (UP), lying face up (FU), lying face down (FD), lying on the right side (R), and lying on the left side (L). The algorithm uses five orientation vec-tors (VORS) corresponding to UP, FU, FD, R, and L to partition three space and sort TA data according to its spatial location relative to the VORS. The five vectors are
defined during an initialization period, during which data is collected while the pa-tient assumes each of the five postures. Stable data within the start and end times of an orientation, indicated by shaded purple boxes in Figure 2-4(a), is used to compute a mean vector for each orientation. Ideally, the VORs would be orthogonal; however, factors such as implant location and physical constraints result in the relative vector positions that are far from ideal. In order to clearly differentiate upright postures from lying ones, a virtual upright (VvirtUp) orientation vector is synthetically created as the vector normal to the plane approximated by the lying vectors. The VORs, which
include
VvirtUP,are depicted spatially in Figure 2-4(b).
104) ... ... 150 80 - UP.. ... ... ... ... - -- - - --.... Virtual UP -.-100 - Z .... - -- --... - ... -... --- FD-- FU-50 -- ---- ---_ -- -- _ ---- - -- - - ... ..-.. -.... . -. 20, - -..-... 0- - - --- 0 --- ---- ---- - . -. -.. .---. 0 -2 .. -..~FU
-100 -... --- --- --- --- 0-0 150 1 1 X5 FO~
0 m100 50 x-accel (Cent s) (a) (b)Figure 2-4: (a) Temporal representation of
VORS.Shaded purple regions indicate data
that was used to aggregately equal the final
VOR.(b) Spatial representation
of VORStransformed into xyz-coordinates.
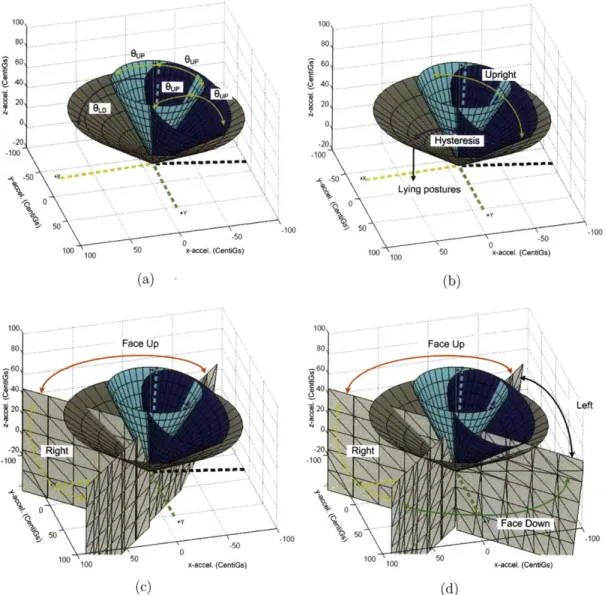
A set of partitioning parameters are used to uniquely divide three-space according
to the position of the
VORs.Two parameters, Oup and
OLD,are used to form cones
around vUP and vvietup. As shown in Figure 2-5(a), two cones
0p around both vup
and VvirtUp define upright postures. Another cone 0LD
from voirtUp divides upright
from lying therapy space. Anything greater than
0LDfrom
VvirtUP
is considered a
lying posture. Data that fall between these two defined regions are classified as
hysteresis postures. Therapy space regions are shown in Figure 2-5(b). Planes that
are equidistant between two adjacent lying vectors further divide the lying therapy
space into four regions, as shown in Figure 2-5(c) and (d).
For a pain patient, these six
VORsdefine the basis of the therapy space. Optimal
STPs are selected for each of the five basic postures and are used for stimulation
therapy whenever the posture corresponding to the
VORis detected by BOBAS. Both
the
VORdata and the associated STP values are stored in a therapy library. Each
column of the therapy library contains the xyz-coordinates of one of the
VORand
the associated STP values. The information in the column of the therapy library
is referred to as an entry. Since BOBAS uses five basic postures, a BOBAS therapy
0 -50 0 -50 -100
100 50 x-accel. (CentiGs) 100 100 50 x-accel. (CentiGs)
(a) (b) 100, 0 Face UpFaceUp 40, 4 20,20Lf N0 0 00 so 50 -50 0100
1 100 sox-accel. (CentiGs) 10 0 0x-accel. (CenfiGs)
(C)
(d)Figure 2-5: (a) Two cones defined
00from
VUP(blue) and
virtUp(cyan) specify the
upright region shown in (b). A third cone (grey)
9LOD
from
VvirtUpdivides the upright
therapy-space from the lying down therapy-space, with a hysteresis region between
the two broad posture regions, shown in (b). (c) and (d) Planes equidistance between
two neighboring lying vectors divide the lying therapy space into four regions.
library always has five entries. In addition to the five static posture detected, BOBAS
may also classify a TA signal as "Upright and Active" using an concurrently running
activity detection algorithm. Since the algorithm developed in this work only develops
a detection algorithm for static postures, the activity algorithm will not be discussed.
2.4
Description of Study Data
The data used to design and validate the closed-loop adaptive algorithm developed in this work was collected in a two-part, Medtronic run research study called the PRS Study. The first protocol of the study was a three-day monitoring period designed to identify subjects who made frequent STP adjustments due to changes in posture or activity. In order to participate in the second protocol of the study, enrolled subjects were required to make at least two amplitude adjustments per 24 hour period during the first part of the study. The first portion of the study will be called the "qualification protocol" since subjects were required to meet certain criteria in order to qualify for the second part of the study. The second part of the study will be called the "validation protocol" since the objective of this portion of the study was to evaluate the performance of BOBAS and subject's satisfaction with algorithmically derived stimulation therapy adjustment. The validation protocol was a 4 hour, in-clinic protocol. The objective and description of each protocol and the constraints of the data sets collected will be discussed in detail in Sections 2.4.1 and 2.4.2.
The two-part study was conducted over an eight month period from August 2008 to April 2009. A total of 19 subjects completed the qualification protocol and 16 com-pleted the validation protocol. Of these data sets, 16 and 11 were available from the qualification and validation protocols respectively for development of the algorithm described in this thesis. Subjects who participated in the study were ambulatory chronic pain patients with a Medtronic Restore or Restore Advanced SCS device im-planted for at least three months. Subjects were required to be at least 18-years-old, have a BMI of 40 or less, and implanted with percutaneous thoracic leads. Hardware for each protocol of the study will be described in each subsection.
2.4.1
Three-day Qualification Protocol
In the qualification protocol, subjects were instructed to change their SCS STPs as they normally would throughout the day and were asked to maintain an activity log. Subjects were given a personal data assistant (PDA) to keep their activity log. The
device was specially formatted for the qualification protocol. An ambulatory data
recorder, called a [pADR (mircoADR) (Figure 2-6), is an external, battery powered
device which is adhered to the hip or abdomen of a subject before beginning the
study. It encases a TA (ADXL 330, Analog Devices) and onboard memory used to
record data over the three-day period. The [tADR itself does not have the
capabil-ity of delivering, monitoring or augmenting therapy, but rather simply records TA
data. To change STPs, subjects were given a research PP identical to the one
pic-tured in Figure 2-1(c) with modified software to record all programming changes and
associated timestamps made by the subject.
Figure 2-6: The Micro Ambulatory Data Recorder (paADR) is a small device
ap-proximately 1.5 x 2 inches which is adhered to a subject's gluteal region. It encases a
triaxial accelerometer (ADXL-330, Analog Devices) as well as a data recording device.
The objective of the qualification protocol was to summarize the time course and
type of STP changes made relative to TA data collected. No algorithm was used to
automatically administer therapy during the course of the qualification protocol.
Be-fore beginning the study, orientation vectors were defined and used for post-processing
purposes to broadly characterize daily activity for pain patients. These data were
also used to validate BOBAS posture detection accuracy. Data sets resulting from
the qualification protocol are referred to as three-day study data (3data). Each data
set included the following information:
o Two to four days worth of TA xyz-data
e PP data indicating changes to STPs and the timestamp associated with each
change (required modification to commercial software available for the device)
" Patient activity log information recorded using a PDA data. The activity
be-ing performed and the timestamp associated with the activity log entry was recorded.
" Five orientation vectors recorded in-clinic
" Post-processed BOBAS posture and activity classifications for each TA data
point
Subjects were able to have four active programs at any given time. In each pro-gram, the simulation voltage amplitude, pulse width, or rate can be adjusted. Addi-tionally, the device may be turned on or off. A string indicates the STP adjustment and the corresponding timestamp. This information is then saved in a PP data file. These changes are identified by 'Inc Amp #', 'Dec Amp #', 'Inc PW #', and 'Dec PW #' where
#
is an integer 1-4 representing the program which was changed. Changes in rate are identified by 'Inc Rate' and 'Dec Rate' and turning the SCS on or off is indicated by strings 'Stim On' and 'Stim Off'. Along with the string descriptions and timestamps, the final STPs after each PP input are given for each program.The intention of the subject annotated activity log from the PDA was to validate the basic BOBAS functionality; however, actual daily activity and precision of any subject's activity log could not be asserted, as subjects were not visually monitored. Activity annotations were only loosely considered as a validation tool. Subjects an-notated their activity by selecting from a predefined list: Bath, Car Ride, Go To Bed, Lie Down, On Back, On Left Side, On Right Side, On Stomach, Other, Shower, Sit, Stand, Wake Up, and Walk. On average, subjects made 20.5 activity annotations per day with a standard deviation of 13.3 and minimum and maximum annotations per day of 6.3 and 49.3, respectively.
Based on post-posture classifications from BOBAS and observation of the data in three space, subjects frequently annotated an activity before or after physically performing the indicated activity. An example would be a subject indicating "Go To Bed" while remaining in a posture classified as upright for several minutes before ulti-mately assuming lying postures for several hours. These deviations between activity
log annotations and true engagement of the annotated action made it difficult to as-sign a true start and end time to any given activity log annotation. Similarly, subjects would make STP changes before or after assuming one of the five BOBAS postures for an extended period of time, making it difficult to attribute the STP change to a specific posture or posture transition. A common phenomenon was changing STPs from high, "awake amplitudes" to lower, "sleeping amplitudes" before going to bed. Many subjects would lower stimulation amplitudes in active programs 2-30 minutes before assuming a lying posture for several hours, indicating the while a STP change was being made, it was actually intended for a posture somewhat far in the future.
Figure 2-7 depicts the two scenarios described above. The subject indicates "Go to Bed" as the current activity at 1900.2 minutes (indicated by the cyan line); however, as shown by the BOBAS classification of the TA data, his posture is still classified as UP until about 1924.2 minutes (indicated by the magenta line). In addition, the stimulation amplitude voltage is changed from 5 V or greater to 2 V at 1912.7 minutes (indicated by the green line). A stimulation amplitude of 5 V or greater was used for about 13 hours before the subject turned the amplitude down to 2 V, which was the stimulation voltage level he used for the following 7.7 hours. Primarily lying postures were assumed from 1924.2 to 2364.5 minutes of this particular subject's qualification protocol data, indicating that he was sleeping and that the 2 V stimulation level was intended for the sleeping period.
Other problems which made the data difficult to interpret were (1) using a wide range of stimulation amplitudes in a single posture (or region of three space), and (2) using the same stimulation amplitude for a variety of postures (or a vast region of three space). While the relationship between the activity annotations, STP changes and the BOBAS basic posture classifications may be reasonably inferred by examining the data, these discrepancies are difficult to resolve without artificially creating a data
Activity Log Inout _o To Bed 1001 50
-0 50 ... Ca 00 U P . .-. ... ... ...L ... FU...---... ... 5) V<-.. Al---) 2V 1900 1905 1910 1915 1920 1925 1930 1935 Time (Mintes)
Figure 2-7: Activity log input versus changes in posture and stimulation therapy
pa-rameter levels. The cyan line indicates time associated with the "Go to Bed" activity
log input, the green line marks the time associated with stimulation voltage
adjust-ment from 5.1 V to 2 V, and the magenta line indicates the time when the subject
goes from primarily UP BOBAS classifications to primarily lying classifications.
2.4.2
In-clinic Validation Protocol
The data from this portion of the study is referred to as in-clinic study data (ICdata).
As mentioned, to qualify for the validation protocol, subjects were required to make
at least two posture or activity related programming changes per 24-hour period in
the qualification protocol. The objective of the validation protocol was two-fold: to
demonstrate a statistically significant difference between standing and supine
ther-apeutic stimulation amplitudes, and to compare the satisfaction of algorithmically
versus manually changed STPs. In the verification protocol, a clinician instructed
subjects to perform a sequence of physical tasks, such as stand, lie supine, lie prone,
ect., while the BOBAS algorithm ran real-time to adjust STPs based on detected
posture.
For the validation protocol, subjects were given a pADR capable of wireless
com-munication with a separate memory module. The memory module, which is a
sep-arate, battery powered unit, connects to a lab programmer (LP) via USB. As TA
data is collected from the pADR, it is wirelessly sent to the memory module and
interpreted by the LP. The LP runs BOBAS and performs real-time STP selection
based on the posture classification of the given TA data. The stimulation information
is then telemetered to the implanted SCS and is used to adjust stimulation therapy. Various metrics were collected in order to asses how satisfied subjects were with the algorithmically derived STPs and how comfortable the stimulation therapy was for each physical task in the protocol.
Each data set from the validation protocol included the following: " About 15 minutes of TA xyz-data
" Event timestamps and labels which correspond to the time and type of activity the subject was instructed to perform
" Truth postures associated with the BOBAS classification for each of the physical tasks in the protocol
" Five orientation vectors recorded in-clinic, as well as a calculated virtual upright vector
Since the ICdata was collected in a controlled environment and at a higher sam-pling frequency than the
3data,
it was used to characterize the signal features of stable postures, noise, and transitions between postures. Values for typical point to point distance variation for each these TA features were derived using these data sets. This information was used to define the preliminary parameter values for the algorithm described in this work. These data sets were also used to compare the classification accuracy between BOBAS and ATLAS. Results from this comparison will be detailed in Section 4.2.1.Chapter 3
Adaptive Therapy Learning
Algorithm for Stimulation
(ATLAS)
As discussed in Section 2.3, given a set of TA data, BOBAS will determine appro-priate stimulation therapy parameters (SPTs) using a therapy library seeded with five orientation vectors (VORS). While the STPs associated with each VOR may be
redefined by the patient at any time, the number of library entries is fixed at five and the xyz-coordinates of the VORS used by BOBAS must be defined in a clinical setting. BOBAS has the following limitations:
1. The practical inter-postural variation from the VORs recorded in clinic. A pos-ture assumed outside of the clinic may correspond to a somewhat different area in three-space relative to the VOR defined in the therapy library.
2. The utility of any given VOR outside of the clinic. For instance, it is common for patients to avoid lying down on the side that the IPG is implanted on. If the IPG is implanted on the right side, the patient may rarely lie on that side, thus making the library entry unnecessary.
3. The possible need for a greater density of vectors to adequately describe the
For these reasons, an algorithm which allows patients to define arbitrary refer-ence vectors (Vrefs) without associating them with any body orientation or fixing the number of library entries would allow patients to dynamically customize and fine tune their therapy space. Using a patient programmer (PP), patients can indicate preferred STPs real-time and the Adaptive Therapy Learning Algorithm for Stimu-lation (ATLAS) will progressively build a therapy library containing valid vrefs and their associated STPs. If VoQs are required for diagnostic purposes, two or more VORs can be defined as part of the clinical initiation process.
Section 3.1 will give a high level overview of the interaction between ATLAS's three functions. Sections 3.2- 3.4 will discuss the data association function (f(assoc)), library modification function (f(libmod)), and data classification function (f(class)) of ATLAS in detail.
3.1
System Overview
ATLAS operates within a global environment where information from the therapy
library, TA, and PP dictate execution of functions. There are three functions: data association, library modification, and data classification. Initially, a clinician will seed the therapy library with at least one default entry. Until a PP input is registered, the data classification function selects STPs based on the distance between the incoming
TA data and the vrefs currently stored in the therapy library.
Once a PP input is registered, the data association function (f(assoc)) is executed. In the
f(assoc),
association criteria is used to search for a series of stable data to generate a valid association vector (Vassoc). The Vassoc, along with the STPs indicated by the PP input, are collectively called association data. If a stable series of data isidentified, the association data will be passed into the
f(libmod)
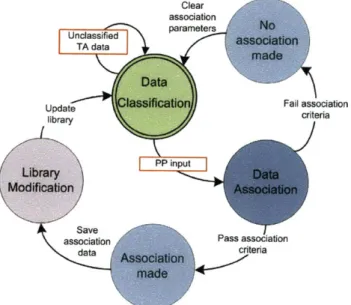
and the library will be updated according to similarity criteria imposed within the function. Figure 3-1 shows the interaction between the three ATLAS functions and the events which result in a change in the functional state.time, distance, and noise criteria are used to evaluate whether the STPs indicated by
the PP input can be reliably associated to a
Vassoc.If a time series of data passes the
stability and same posture distance criteria for the duration of the stable timer
(Ttable)within a search timer
(Tsearch)period, a
Vassocwill be generated and the association
data will be passed into the f(libmod). The f(libmod) then assesses whether the
new
Vasocis sufficiently similar to any of the existing Vref in the therapy library or
whether the new
Vassocis different enough to create a new library entry with the
association data. A detailed state diagram with the high level processes performed
during transitions from one state to another is shown in Figure 3-2.
Clear association
Unclassified
parans
TA data
Diata
Update
bu)
fian
Lion
Fail associat onlibrary criteria
PbP
input
d
Library,
Modfcation
asso ad
Pass
desocition
data
criteria
Figure 3-1: Basic state diagram depicting relationship between the Data Classification
(green), Data Association (blue) and Library Modification (purple) functions. The
boxes outlined in red indicate incoming input data which will change the current
functional state.
The algorithm was implemented in MATLAB where a main script' reads in data files containing time-series TA and PP data. Figure 3-3 describes the main function of
ATLAS in flow chart format. The variable naming scheme used in Chapter 3 is given
on Table 3. 1. The time-series data is read in one data point at a time at a frequency
Of
frA
Hz. For each sample, the xyz-coordinates of the current TA data point (ot), the time when the last PP input was recorded (tpp) and the current sample time (t)Unclassified TA data Fail Clear association parameters Outside search period
Reference vector similar to an existing library entry
Figure 3-2:
Association
Detailed state diagram showing states of the Data Classification, Data
and Library Modification functions in green, blue and purple respectively.
are known. In addition, a collection of flag variables (Ftype) indicate the current state
of the algorithm.
Abbreviation Type of Variable
Units
Ttype
Period of time
seconds
ttype
Time keeping variable
seconds
Ftype
Flag
binary value (0 or 1)
Dtype
Distance threshold
metric dependent
d2
Distance between two vectors
metric (D, E, or S, see
Table 3.2)
Vtype
xyz-data points
centi-g
variablet_,
Value of variable at time t-n where variable dependent
n corresponds to number of samples
Table 3.1: General reference for variable and parameter symbolic nomenclature and
their definitions and units of measurement.
By default, the f(class) is executed.
Until an input is received from the PP,
STPs will be selected for each incoming TA data point using the therapy library.
ATLAS begins executing the f(assoc) when a new PP input is received (Fnew=1).
Associate PP input
i
Pass Insearch periodh In stable period " Reference vector sufficiently different thanexisting library entries
Save association
data
Outside stable period
The registered PP input prompts the initialization of the time keeping variables tsearch
and tstable, as well as other data keeping variables which control the generation of a
vassoc within the f(assoc). The f(assoc) is executed as long as Fassociate = 1. As
shown in Figure 3-2, the f(assoc) will continue to be executed with each new sample until either the search timer has expired (t - tsearch Tsearch) or an association
vector, Vassoc, has been formed (which occurs when t - tstable Tstable). The former
case occurs in the main script when Fassociate, Fnew, and Flibrary all equal zero and
the latter case occurs when the the library modification flag is set (Flibary = 1). The
method by which these flags get set and the Vassoc gets formed will be discussed in detail in Section 3.2.
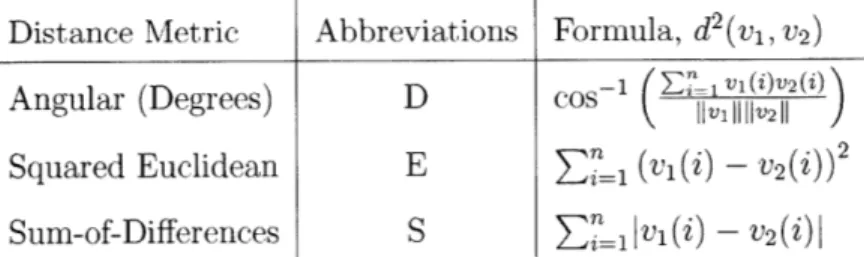
All three functions require that the distance between two points be measured.
Three distance metrics are used throughout ATLAS to measure the relative position of two vectors: Angular (A2), Squared-Euclidean (E) and Sum-of-Differences (S3).
The distance metrics are defined on Table 3.2. Each time ATLAS is run, the same distance metric is used to measure all require distances throughout the algorithm. The three methods for calculating distance were chosen to explore the performance between different methods of partitioning three-space. In addition, the computational complexity of each of the distance metrics ranges from very complex (requiring a trigonometric operation as well as two square root operations for D) to very simple
(requiring only simple addition and absolute value for S).
Distance Metric Abbreviations Formula, d2(vi, v2)
Angular (Degrees) D cos- i V11V2
)
Squared Euclidean
E
(v(i) - ))2Sum-of-Differences
S
= IIV1(i) -v
2(i)
Table 3.2: Distance metrics used in ATLAS to compute the distance between two vectors, vi and v2. The vectors are three dimensional (n = 3) where the first, second
and third elements correspond to x, y, and z components of the vector.
2While the angle between two vectors is not necessarily a distance, it will be referred to as
such in this work. Vectors will always be formed as lines extending from the origin to the vector's xyz-coordinates.
Resetf(assoc) variables
Figure 3-3: Functional layout of the ATLAS main script implemented in MATLAB.
The data association, data classification and library modification functions are called
from this script. Variable abbreviations and definitions can be found on Table 3.1.
3.2
Data Association: Mapping of Therapy
Pa-rameters to a Position Vector
The
f(assoc)
is the most computationally intensive function of ATLAS. This function
must identify a segment of data that corresponds to the postural behavior causing
a patient to make a STP change. A natural technique for a problem of this
na-ture would be to implement a machine learning algorithm and collect training data
over some period of time. Unsupervised learning techniques were explored, but were considered unsuitable since they require large data storage capacity and impose signif-icant patient burden during the training period. In addition, since machine learning algorithms tend to be sensitive to factors such as initial conditions [30], there is no guarantee that the output would accurately reflect a patient's stimulation therapy needs.
The method used to associate a segment of data to a PP input in the
f(assoc)
minimizes the computational complexity and gives patients the ability to refine their therapy space whenever necessary. While the capability to update STPs associated with a VOR is possible using BOBAS, thef(assoc)
of ATLAS allows patients to define STPs in whatever way best suits their individual therapy needs. Presumably, patients change their STPs upon experiencing inadequate or painful stimulation therapy. For instance, if a patient were to go from FU to UP4, he may require a higher stimulationamplitude. Upon standing, he might therefore increase the stimulation amplitude, and continue doing whatever activity he stood up to do.
The main objective of the
f(assoc)
is to generate a representative vector which can be used to identify the STPs indicated by the PP input. Due to the variation in the position of the TA vector, this presents a major challenge. The distance between successive TA data points is constantly changing. Even when a patient is reasonably still, some variation in the location of the TA data points is expected as a result of insignificant patient movement or measurement error. When a patient changes his STPs to suit the new body orientation he is in, thef(assoc)
attempts to identify a concise region in three-space which is representative of the body orientation which caused the patient to change his STPs. The concise region is identified by a vector called an association vector (Vassoc). If a Vassoc is generated in thef(assoc),
it is passed into thef(libmod)
along with the indicated STPs and is incorporated into the therapy library.The generation of a Vassoc is triggered by a PP input. Once a PP input is registered in the main function, the new PP input flag is set (F=ew 1) which causes the
f(assoc)
to get executed (see Figure 3-3). The f(assoc) uses six data association parameters and a variety of data variables to generate a Vassoc. There are two distance thresholds, two timers, and two noise allowance parameters. Collectively, the parameters are used to select a segment of data following a PP input which is suitable for generation of a Vassoc. The parameters and their function will be described below and the various operations performed during each iteration of the f(assoc) are detailed in flow chart format in Figure 3-4. The data variables keep track of the state of the f(assoc) and maintain data upon each iteration of the function. The function uses the following variables to dictate the generation of a vassoc:
* Three time keeping variables
- tsearch Time associated with the receipt of a PP input
- tstable Time indicating the beginning of a stability period
- tbuffer A data vector with N elements which saves the last N times from previous iterations
* Two TA data recording variables
- Vstable xyz-data of the Vassoc being generated
- Vbuffer A data vector with N sets of xyz-data corresponding to the last N TA data points from previous iterations
* A logical buffer
-Bp2 : A logical buffer with N elements corresponding to the result of the
stability criterion (explained below)
" Three flags
- Few : Indicates the detection of a new PP input
- Fassociate : Indicates whether a PP input is in the process of being
- Flibmod : Indicates whether the
f(assoc)
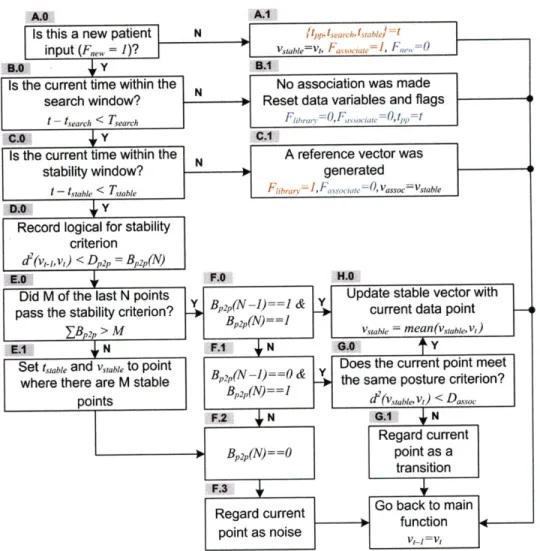
has successfully generated a Vassoc for a registered PP input or notUsing a point to point threshold (Dp2p), a same posture threshold (Dassoc) and two
parameters which control the amount of noise acceptable out of N points (Mof N), data with an acceptable amount of noise and spatial variation is identified and used to create a Vassoc. The four parameters impose three criteria which must be met to create a Vassoc: (1) a stability criterion, (2) a noise criterion, and (3) a same posture criterion. In order for an association to be made, all three criteria must be met within a specified time frame. The stable timer, Ttable, specifies the amount of data required to generate the Vassoc, and Tsearch limits the span of time during which a Vassoc can be generated after the receipt of a PP input. At the beginning of each iteration of the function, these time period requirements are checked. First, the search period it checked (t - tearch Tsearch, Figure 3-4 B.0). If the current time is outside of
the search period, then the STPs indicated by the PP input are not incorporated into the therapy library (Figure 3-4 B.1). If the current time is within the search period, a check to determine whether the stability period has expired is conducted
(t - tstable < Tstable, Figure 3-4 C.0). If it has, Vtable is associated with the STPs
indicated by the PP input, and is referred to as an association vector (Figure 3-4 C.1). Both the vector and the STPs information are then passed into the
f(libmod).
The stability criterion is used to identify "stable" data which has very little vari-ation in three-space. On the second itervari-ation of the
f
(assoc), the distance betweenthe previous TA data point, Vt_1, and the current TA data point, Vt, is measured and compared to Dp2p (Figure 3-4 D.0). If the distance between t-1 and vt is less than Dp2p
(d
2(t_ 1, Vt)<
Dp2p), the two vector components are averaged together togenerate a single stable vector, Vstable (Vstable - mean(vt, Vt_1), Figure 3-4 H.0). New data points that pass the stability criterion continue to get averaged into the value
of Vstable (Vstabte -
mean(vt,
vstable)). The first time the distance between Vt1 and vtexceeds Dp2p, then the TA data point is flagged as noise (Figure 3-4 F.2 and F.3).
A.0 A.1
Is this a new patient N {tpp'tsearei,
input (Fae, = 1)? vstable=Vl, Fassoc
B0 - Y BA
Is the current time within the N No associatic
search window? Reset data vari
t -dtseae < Tseaeh B0PN'
C.0 Y C
Is the current time within the
stability window? _gn
I - tstante < T,,ase Firn=/ asca
Record logical for stability criterion
d2(v,-1,v,) < Dpze = Bp2p(N)
Did M of the last N points Bp(]-=l&Y U
pass the stability criterion? B p2 p(NJ% =1
}~B2 > M
EA N0
Set tsb, and vsat, to point &YDo
where there are M stable B~()= h
N. Noascai
C.1
tsabIej =t
iae =1, F,,,=0
n was made ables and flags
Oeihnte=0,t1'1=t
vector was
rated
pdate stable vector with current data point
vstahte = mean(vtabe, v)
--Y
es the current point meet same posture criterion?
d (v,,aie,vt) < Dsa
GAM N
Regard current point as a transition
Figure 3-4: Data association function flowchart.
criterion for the last N points. A value of 1 or 0 is stored in the N"h element depending
on whether the criterion is passed or failed. Initially, the Bp
2pis padded with N ones.
After the stability criterion is checked (Figure 3-4
D.0),
the noise criterion is verified
by summing the elements of Bp2p to ensure that at least M of the last N data points
were considered suitable for inclusion in the
Vstable(Figure 3-4 E.0). If greater than
N
-
M of the last N points failed the stability criterion
()IZ
Bp
2p(k) < M, Figure
3-4
E.1),
it indicates that the patient is either active or that the signal has too much
variation to specify a concise region in three-space. If this occurs, the stability time
keeping variable,
tstable,is reset so that the maximum number of noisy points are
If Vt fails the stability criterion, as long as the noise criterion is met, the point is regarded as noise. Once the noisy data subsides (as indicated by Bp2p(N) = 1, Figure 3-4 F.1), the distance between vt and Vstable is measured and compared to a same posture threshold, Dassoc (d2
(vt,
ostable) < Dassoc, Figure 3-4 G.0). This iscalled the same posture criterion. Passing the same posture criterion indicates that the the point to point deviation in three-space between t-2 and t_1 was caused by noise, or an insignificant movement. The current data point is therefore incorporated into the calculation for Vstable (Vstable = meao(vt, Vstable)). If vt fails the stability criterion, the noisy data is considered to represent a transition rather than noise (Figure 3-4 G.1), and the Vstable and tstable are reset to the current data and time (Vstable - vt and tstable t ).
3.3
Library Modification: Redefinition of Therapy
Vector Space
Once an association between a PP input and a vector is made in the
f(assoc),
thef
(libmod) determines how the new association data should be incorporated into thetherapy library. The objective of this function is to maintain a therapy library which accurately describes a patient's stimulation therapy space according to changes they have made to their STPs over time. To minimize the amount of computation and storage space necessary, it is important to keep only sufficiently different information. This function first measures the distance between every existing vref in the therapy library and the Va...c from the
f
(assoc). The minimum distance between any of theVref and vassoc is compared to the
f
(libmod)'s same posture threshold, Dlibmod. If thedistance is less than Dlibmod, then the library entry is considered sufficiently similar, and is replaced by the association data corresponding to the associated PP input. If
Vassoc is greater than Dlibmod away from all existing therapy library vref, then a new entry is created and filled with the association data.