International Conference
on Water, Energy and
Environment 2011
Promoting a global collaboration among faculty, students,
engineers and managers on ecological economics and water,
energy and environment resources management.
November 14–17, 2011
Auditorium, Main Building, AUS
Sponsored by:
OFFICE OF PUBLIC AFFAIRS
OFFICE OF PUBLIC AFFAIRS
ﺔﻣﺎﻌﻟﺍ ﻥﻭﺆﺸﻟﺍ ﺐﺘﻜﻣ
OFFICE OF PUBLIC AFFAIRS
OFFICE OF PUBLIC AFFAIRS
ﺔﻣﺎﻌﻟﺍ ﻥﻭﺆﺸﻟﺍ ﺐﺘﻜﻣ
OFFICE OF PUBLIC AFFAIRS
OFFICE OF PUBLIC AFFAIRS
2
PROCEEDINGS
The 2011 International Conference
on
Water, Energy and Environment
ICWEE
14-17 November, 2011
Sharjah
United Arab Emirates
Edited by
Nabil Abdel-Jabbar, Raafat Alnaizy and Taleb Ibrahim
College of Engineering
American University of Sharjah
United Arab Emirates
3
FOREWORD
Under the patronage of his highness Sheikh Dr. Sultan Bin Mohamed Al-Qassimi, Ruler of
Sharjah and member of high UAE Rulers council,the American University of Sharjah (AUS),
with cooperation of United Arab Emirates University (UAEU)organized “The
2011International Conference on Water, Energy and Environment (ICWEE)”. The
conference is sponsored by the Canadian International Association for Sharing Knowledge
and Sustainability (IASKS), Arab Academy of Science (AAS), and Islamic Education,
Scientific and Cultural Organization (ISESCO), ADNOC, Bee'ah, Dow Chemical,
HuberTechnology and Metito. The objective of the ICWEE conference is to promote a global
collaboration among faculty, students, engineers, managers on ecological economics, and
water, energy, and environment resources management.
The papers appearing in this book contribute significantly to the progress of issues related to
water regulation and policies, water resources and sustainable development of the region,
water protection and remediation, desalination, wastewater treatment, energy, environmental
impact, economic management and development of water resources, environment, and other
water related topics.
We thank all the authors and delegates who contributed to the success of ICWEE2011 by
sharing their work and knowledge with their colleagues. Our special thanks go to the keynote
speakers, session chairpersons, International Advisory Board and all other committee
members for their contribution and effort.
Raafat Alnaizy
Taleb Ibrahim
Yousef Alhayek
Sharjah
November 2011
4
Acknowledgments
The organizing committee acknowledges the support of the Dean of College of Engineering,
Dr. Yousef Al Assaf at the American University of Sharjah.
The committee would like to sincerely thank the co-sponsor companies: ADNOC, Bee’ah,
Dow Chemical, Metito and Huber.
The committee expresses our sincere thanksto the following AUS offices for their various
support activities including, Office of Development & Alumni Affairs, Office of Strategic
Communication and Media, and the Officeof Public Affairs.
The committee would like to thank our students who assisted in the preparation, especially
Youssef Chehade and Saeed Nusri.
5
Conference Chairs
Raafat Alnaizy
Taleb Ibrahim
Yousef Haik
Steering Committee
Raafat Alnaizy
Taleb Ibrahim
Yousef Haik
Hans G. Huber
Ibrahim Abu-Reesh
Antonio Baptista
Yung-Tse Hung
Organizing Committee
Yousef Al Assaf
Nabil Abdel-Jabbar
Ahmed Aidan
Mohamed Gadalla
Maruf Mortula
Sofian Kanan
Adnan Badran
Bilal Akash
Elias Baydoun
Fariq Billa
Darwish Gobaisi
John Hillmanl
Mousa Mohsen
Reyad Sawafta
Ibrahim Kocabas
Mohamed Abouleish
Serter Atabay
Kazi Parvez Fattah
Salwa Mohamed
Web & IT
Khalil Darwish
International Advisory
Board
Mark Holtzapple, USA
Mahmoud El-Halwagi, USA
Ibrahim Dincer, Canada
Clayton Maugans, USA
Karl Rudolph, Germany
Stefania Paris, Germany
Nidal Hilal, UK
L. Rizutti, Italy
V. Nenov, Bulgaria
Tim fuhrmann, Germany
Hisham Ettouney, Kuwait
I. Al-Mutaz, Saudi Arabia
Nabil Fayad, Saudi Arabia
Rodger Macfarlane, UAE
Tamer Gadallah, UAE
Youssef Mouneimne,
Lebanon
Ramdhane Dhib, Canada
Mehrab Mehrvar, Canada
Fawzi Banat, Jordan
Mousa Abu Orabi, Jordan
S. Al-Sulaiman, Oman
K. Bourouni, Tunisia
Maazuza Othman, Australia
Joonkyu Kim, Korea
Sergio Mussati, Argentina
Tamer Shahin, UAE
Basem Yousef, UAE
Symposium Secretariat
Aileen Yulay
Technical Committee
Nabil Abdel-Jabbar
(Co-Chair)
Mohamed Gadalla
(Co-Chair)
Serter Atabay (Co-Chair)
Ahmed Aidan
(Tutorial, Exhibition Chair)
Kazi Parvez Fattah
(Poster Session Chair)
Maruf Mortula
Abdallah Shanableh
Naif Darwish
Dana Abouelnasr
Mohamed Ibn Kahla
Zarook Shareefdeen
Sameer Al-Asheh
Hasan A. Hasan
Hassan Arafat
Farouq Mjalli
Jamil Nasser
Bassam Tawabini
Khawla Al-Shayji
Kevin Loughlin
Ibrahim Kocabas
Isaac Wait
Basel Alsayyed
Salah Al-Omari
Ali Al Naqbi
Emad Elnajjar
Samir Emam
Mohammad Hamdan
Saud Khashan
Mohamed Younes Selim
Tamer Shahin
Basem Yousef
6
1. Stressed Marine Environment - Physico-chemical Evidences from Sulaibikhat Bay, Kuwait ... 10
2. Impact of Barrages on Water Quality of Rivers Upstream and on Air Entrained in the Hydraulic Jump Downstream ... 17
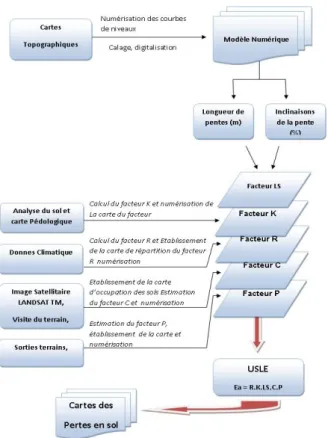
3. The Use of GIS and Remote Sensing for Quantitative Evaluation of Water Soil Erosion, Case Study in the West of Algeria ... 23
4. Optimum Operation of Canal Barrages ... 27
5. Development of Biochemical Acidogenic Potential Test for Evaluating WAS Digestibility ... 32
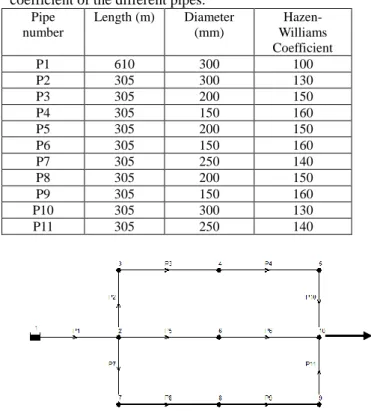
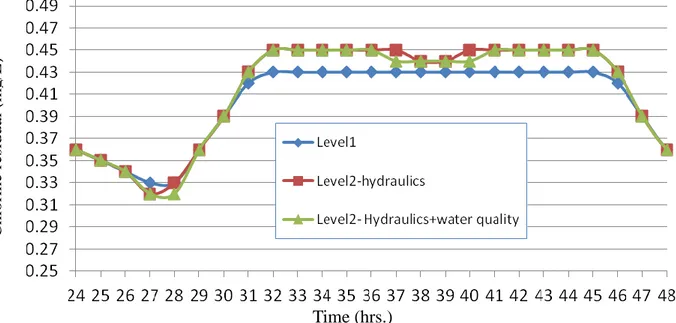
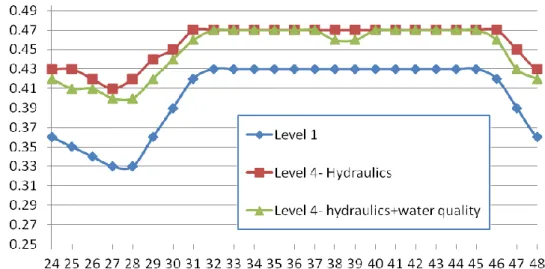
6. Effect of Simplifying the Water Supply Pipe Networks on Water Quality Simulation... 41
7. Vanadium Recovery from Synthetic Wastewater by Adsorption onto Chitosan ... 47
8. Fabrication of Polymeric Hollow Fiber Membrane for the Production of Safe Drinking Water ... 51
9. The Effect of Chemical Application and Excessive Extraction of Water Resources on Groundwater Quality and Environment in Saudi Arabia ... 57
10. Model-Free Control of pH in the Neutralization of Alkaline Waste Water using CO2 Gas ... 64
11. Long Term Water Demand Forecast for the City of Riyadh, Saudi Arabia ... 68
12. Changing Produced Water from Waste Stream to a Useful Asset in Sudan Oil Fields ... 73
13. Enzymatic Production of Biodiesel from Waste Cooking Oil ... 79
14. Prototype Decontamination of Water by Ozone ... 85
15. Bioelectrochemical Single Chamber Reactor: Enrichment of Autotrophic Perchlorate Reduction for Water Treatment ... 90
16. Removal of Heavy Metals from Aqueous Solution by Poly (Acrylamide-co-Acrylic acid) /Porous Materials . 95 17. Air Pollution by Fine Particles (PM-10, PM-2.5 and PM-1) Size Distribution and Associated Trace Metals Evaluation in the Great Area of Algiers ... 101
18. Study of Moisture and Leachate Solute Movement during Infiltration Tests ... 106
19. Influence of Hydraulic Gradient and Confining Stress on the Hydraulic Conductivity of Sealing Barriers Materials ... 112
20. Water Resources for Sustainable Development in the Developing Countries ... 117
21. Kinetic, Equilibrium and Thermodynamic Studies for Adsorption of Cadmium (II) Using Modified Agricultural Wastes ... 123
22. Investigation of Water Quality in Kocasu Creek, Turkey ... 130
23. Rheological Behavior of RBC Sludge at Different Steps of Treatment ... 137
24. A Wireless Sensor Network for Water Pipeline Leak Detection ... 143
25. Corrosion and Scale Formation Problems in Water Systems ... 148
26. Analytical and Numerical Modeling of 2-D Solute Transport in a Fracture/Matrix Aquifer System ... 154
27. Modeling Sensible Energy Storage in Aquifers ... 160
28. A Novel Analytical Model of Heat Extraction from Geothermal Reservoirs ... 165
7
29. A Novel Two Dimensional Analytical Model of Contaminant Transport in Groundwater Aquifers ... 171
30. Integration of Wastewater in the Water Resources of Egypt:... 179
31. Removal of Phosphorus and BOD from Secondary Effluent using Coagulation ... 185
32. Copper Removal via Adsorption ... 188
33. Simplification of a Nonlinear Fuel Cell Model and its System Analysis and Control ... 195
34. Study on Heavy Metal Resistant Bacteria Isolated From Wastewater ... 200
35. Adsorption of Two Dyes Water Textiles by Two Biosorbents ... 207
36. Modification of Magadiite by Organofunctionalization for Use in Removing Pb(II) From Aqueous Media... 211
37. Modelling Groundwater Flow in the Agricultural Area of Ghriss Plain ... 217
38. Investigating Geotourism Capabilities of the Gavkhoni Wetland According to the FAS model ... 221
39. Optimization of Influential Parameter to Biodegrade the Phenol in Batch by Microbial Consortium ... 228
40. The Impact of Wind Farms on the Stability of Electric Networks ... 233
41. New Public Management Reforms and Efficiency in Urban Water Service Delivery in Emerging Economies: Blessing or Curse? ... 237
42. Effects of Skewed Bridge Crossing on Afflux ... 243
43. Assessment of Runoff Potential for Water Harvesting in Central Butana Rangeland, Sudan ... 249
44. Effect of Alum Addition on the Treatment Efficiency of Cloth-Media Membrane Bioreactor... 256
45. The Use of Water Treatment Residuals in the Treatment of Textile Industry Wastewater ... 259
46. Nanofiltration Pretreatment of Desalination Seawater Feed for CO2 Release Reduction in MSF Distillers .... 263
47. Design Flow Factors for Sewerage Systems in Small Arid Communities ... 266
48. Hydro-meteorological Impacts of Climate Change in the Middle East: A Review ... 273
49. Decentralized Sewage Reuse for Irrigation Purposes ... 279
50. UV Disinfection of Only Partially Pre-clarified Wastewater for Irrigation Purposes ... 286
51. Copper Cementation on Iron Using Copper Sulphate Solution with Different Organic Solvents ... 291
52. Conversion and Liquification of Petrochemical Sludge (Biological and Chemical) using Subcritical Water Technology ... 296
53. Plasma Assisted Decomposition of Gaseous Hydrocarbons to Produce COx Free Hydrogen ... 301
54. Colloid Particles Deposition in Porous Media: Role of Hydrodynamic and Electrolyte Concentration ... 307
55. A comparative Life Cycle Assessment (LCA) of Using Virgin Crushed Aggregate (VCA) and Recycled Waste Concrete Aggregate (RCA) in Road Construction ... 312
56. Enhancing the Remediation Efficiency of Photo-Fenton Reaction by Oxygen and Humic Substances... 317
57. The Role of the Dynamic Process of Aeration on the Evolution of Dissolved Oxygen and Phosphorus in Water Supplies ... 323
58. Field Experiment and Numerical Simulation of Point Source Irrigation in Sandy Soil with Multiple Tracers 327 59. Threats to Groundwater Resources due to Uncontrolled Land filling in Jordan: A Review with Some Remedial Measures Recommendations ... 335
8
60. Water Scarcity and Solar Desalination Systems in the Eastern Mediterranean Region: A Case of Northern Cyprus ... 341 61. Study on Amorphous Ag-Doped Manganese Dioxide Electrodes for Electrochemical Supercapacitors
Applications ... 350 62. Effect of Deposition Current on the Capacitive Behavior of Manganese Dioxide/Stainless Steel electrodes .. 356 63. Synthesis of Polymethylmethacrylate ... 361 64. Induced Transboundary Waterborne Emission Savings as Result of National Environmental Policies: the Case
of the Danish Packaging Taxation Policy ... 365 65. The Impact of Wind Farms on the Stability of Electric Networks ... 369 66. A Comparative Study of Vapour Compression Refrigeration Systems under Air to Air and Air to Water Mode
... 373 67. Energetic and Exergetic Comparison of Water-Water and Water-Air Heat Pumps ... 379 68. A Simulation Study on Determining the Position and Orientation of a Classic Rectangle-Lengthwise Type
Greenhouse System to Have More Benefit from Solar Radiation ... 386 69. Evaluation of Different Substrate Material of Constructed Wetlands for Bioremediation of Household Sewage
... 392 70. Mitigating the Impacts of Animal Production on Surface Water Quality in Grassland Ecosystem: Techniques
and Measures ... 401 71. Energy Efficiency in Spanish Wastewater Treatment Plants: The Role of the Internal and External Factors .. 406 72. Vortex Ring Buoyant Plume on Porous Body in Thermal Non-Equilibrium ... 412 73. Study on Amorphous Ag-Doped Manganese Dioxide Electrodes for Electrochemical Supercapacitors
Applications ... 418 74. Adsorption of Dye Pollutants on Hydrothermally Synthesized Mesoporous Copper Phosphate Materials ... 424 75. Nonlinear Modeling of River Flow ... 428 76. The Impacts of Wastewaters Discharges on the Quality of Littoral Case of the Coastal Region Ain
Temouchent (West Algeria) ... 434
77. Treatment of Oilfield Produced Water through NF/RO Membranes: Generating a Sustainable Drinking Water Resource by Reusing a Pollution Source ... 442 78. An Integrated Neural Network-Fuzzy Mathematical Programming for Optimum Long-Term Electricity Price
Forecasting in Noisy and Complex Environments ... 447 79. An Intelligent Approach for Improvement of Short Term Water Consumption Forecasting in a Large and
Complex Metropolitan City ... 454 80. A Greedy Randomized Adaptive Search Procedure-Genetic Algorithm for Electricity Consumption Estimation
and Optimization in Agriculture Sector ... 460 81. Application of Principal Component Analysis to the Study of Trace Metals in Sediment from Sulaibikhat Bay,
Kuwait ... 466 82. Concentrations of natural and manmade radioactive nuclides for Wadi Numan area in Makkah
9
83. Effect of the Type of Water on Leaching of Aluminum Utensils During Food Preparation ... 482
84. Steady State System Analysis of a Bilinear Fuel Cell Model for Electricity, Heat, and Water Production ... 488
85. Reduced-Order Observer and Optimal Controller Designs for the Air Flow of a Linearized Model of a 75kW PEM Fuel Cell for Electric Cars ... 492
86. The Effects of Climate Change: How Can Algeria Deal With It ... 496
87. Simulation of Blue Nile River Using a Distributed Hydrological Model and Global Data Set ... 500
88. Experimental Testing of the Water Saving Potential of Different Faucet Aerators and their Performance over Time ... 508
89. The First Water Quality Model From the Arabian Gulf and a New Endogenous Development Capacity in the Region ... 515
90. Anoxic Water Simulations and Vertical Sub-Meshing to Depict Strong Gradients ... 91. Steady-State Quartz Formation in terms of Water Migration through Nanopores ... 541
92. On the Control Requirements of Heaving Wave Energy Converters ... 546
93. Adsorption of Cobalt Ions Onto Immobilized and Non-Immobilized Jordanian Low Grade Phosphate ... 552
94. Sorption Capacity of Poly-tetra-fluoro-ethylene Sorbent for the Remediation of Oil Polluted Water ... 559
95. Paper or Plastic? Clearing Misconceptions on Environmental Impacts of Coffee Cups Using Life Cycle Assessment (LCA) ... 563
96. Modeling Thermal Degradation in Geothermal Reservoirs Due to Reinjection ... 570
97. Africa Energization: Alternative Energy Capacity Building Strategies and Policies ... 579
98. Concentrations of Natural and Man-Made Radioactivity Soil and Ground Water in Al-Madinah Al-Monawarah ... 588
99. Analysis of the Water Evaporation and Drift Losses during Irrigation in Semiarid Areas ... 595
ICWEE2011
10
Stressed Marine Environment - Physico-chemical Evidences from Sulaibikhat
Bay, Kuwait
Hassan. Alshemmari
1,2, Alkhabbaz. Ahmad
1, Saif Uddin
1 1Environmental Science Department, Kuwait Institute for Scientific Research, P.O. Box 24885, Kuwait Safat
13109. Email: akhabbaz@safat.kisr.edu.kw, sdin@kisr.edu.kw
2
School of Civil Engineering and Geosciences, Drummond Building, The University of Newcastle upon
Tyne, Newcastle upon Tyne, NE1 7RU. Email: hshamari@safat.kisr.edu.kw
ABSTRACT
The Northern Arabian Gulf shows signs of physico-chemical streses in form of changing water, sediment and biological characteristics. The region in general and Kuwait in particular is affected by these changes, an example is presented from Sulaibikhat Bay. This study investigated the parameters including water depth, temperature, dissolved oxygen content, pH, oxidation–reduction potential (ORP), specific conductivity, salinity and turbidity in the study area. The area is impacted by thermal stress due to presence of desalination plant outfall. Local differences of temperature and
salinity (1.2°C and 5.92 mgl-1) were observed within the area. This study recorded the lowest level of DO (5.92 mg l-1)
during December, in the southeast of the study area, adjacent to the Ghazali sewage outfall, low ORP values (48.0–188 mV) were also recorded in the southeast of Sulaibikhat Bay, that might be associated with the presence of hydrogen sulphide and pyrite in the bottom sediments, suggesting reducing conditions because of sulphate reduction associated with the decomposition of organic matter. It is observed from this study that tidal flats play a very critical role in maintaining the water quality, acting as filter for effluents. The sediments in the area act as repository of pollutants. There are apparent temporal changes in the biological activity, with absence of fishes, bivalves, crabs in from the area. A low density mud skipper population is only surviving in the area.
Keywords: Sulaibikhat Bay, Kuwait, sewage, desalination plant, salinity 1. INTRODUCTION
The shoreline of Kuwait is having a characteristic embayment ‗Kuwait Bay‘. The southern shoreline of Kuwait Bay is heavily inhabited, mainly constituting the urban center. The Kuwait bay is characterized by shallow depths, soft sediments, slow tidal currents, and high turbidity (Dames & Moore 1983; Khalaf et al. 1981). The deeper portion in Kuwait bay is the trough, which characterizes the navigational channel leading to the Shuwaikh port. The average depth of Kuwait bay water is about 10 m (Dames & Moore 1983; Khalaf et
al. 1981; Khalaf et al. 1982). There are various inlets of
stormwater drains, emergency sewage outfalls and other discharges that open into Kuwait Bay, stressing the environmental.
The current study is carried out in southern portion of Kuwait Bay termed as Sulibikhat bay. The is the shallowest water body within the Kuwait Bay system, occupying vast tidal flats upto 4 km wide. The area is having several outfalls; power and desalination plant, hospital and waste water discharge point. Samples were collected from the area to identify changes in ambient concentration of key physico-chemical parameters, that can identify if the environmental stress.
2. STUDY AREA
Sulaibikhat Bay is a small and secured embayment located to the southern part of Kuwait Bay. It is situated
between latitude 29o 19.115 and 29 23.198 and
longitude 47o 49.023 and 47 55.015 respectively,
covering an area of 45 km2.Sulaibikhat Bay, (Figure 1)
has undergone considerable development over the years. There is a main cargo port is to the east of Sulaibikhat Bay. There are five major recreational and other
developments along Sulaibikhat Bay coastline:
Entertainment City, Sulaibikat Sport Club, the Hospital Complex, Kuwait University (KU) and Kuwait Institute for Scientific Research (KISR).
The major environments in Sulaibikhat Bay are tidal channels, rocky flats, mud flats and the shoreline and back-shore area (Khalaf et al. 1981; Dames & Moore 1983). The shoreline of Sulaibikhat Bay is generally flat beach formed by the action of back eddies entering the bay from the north (Dames & Moore 1983; Khalaf
et al. 1981). Landward of the shoreline and towards the
west (around Entertainment City) and southwest (near the Sulaibikhat Sports Club), the area is coastal sabkha which exists as a continuous inland extension of the intertidal zone. The sabkha deposits are generally composed of sand and mud sediments (Khalaf et al. 1981).
3. MATERIAL AND METHODS
Temperature, pH, salinity, turbidity, dissolved oxygen, and conductivity were measured in the water column ( measurements taken at 0.5 m depth below the surface or just below the surface for shallow depth less than 0.5 m) at each sediment sampling location using a Hydrolab
Quanta Water Quality Monitoring System
(www.hydrolab.com). This was calibrated, prior to use, using procedures described in the operation manual.
11
Figure 1: Location of sampling site in the Sulaibikhat Bay.
4. RESULTS
The storm water outfalls are known to add significant quantities of sewage derived from discharges into the storm water network from light industries, or domestic and emergency discharges into the network from overloaded or faulty sewage pumping stations serving the wastewater network in the country (Al-Ghadban et
al. 2002). The area in front of the Ghazali outfall to the
southwest of Shuwaikh Port is occupied by anoxic soft sediments, with anoxic conditions also frequently observed in the shallow overlying water column (Al-Sarawi et al. 2002b; KISR 2003). The intertidal environment could have also received significant trace element pollution resulting from abandoned ships and sunken boats in the Shuwaikh Port area.
There are many obvious sources of pollution in the study area (Figure 1), including the Doha West‘s power and desalination plant, storm water outfalls and the Ghazali sewage discharge. Each of these sources is known to contribute pollutants to the surrounding marine environment (KISR 1999). Petrochemical industries in the Shuwaikh industrial area are also a source of pollution (KISR 1984). These sources are heavily loaded with nutrients and sanitary wastes (Figure 1) (KISR 1999). The power and desalination plants at Doha West discharge large quantities of seawater which is warmer than the sea water. This can
be toxic to marine species. The power plants generate a
water discharge 5oC above the ambient water
temperature (Al-Ghadban et al. 2002; Saeed et al. 1999). In summer, when the ambient seawater
temperature is 30o to 35oC, the temperature of the
seawater discharged by the power and desalination
plants at Doha exceeds 40oC, which is stressful to most
marine species and has resulted in the loss of temperature-sensitive species (Dames and Moore, 1983).
Water Depth: The deepest water is 5.5 m in the centre
of the Bay (Table 1). Previous studies suggest that Sulaibikhat Bay has a central channel, which is ~3 km long, 0.5 km wide and 10.5 m deep (Khalaf et al., 1988, KISR, 2003).
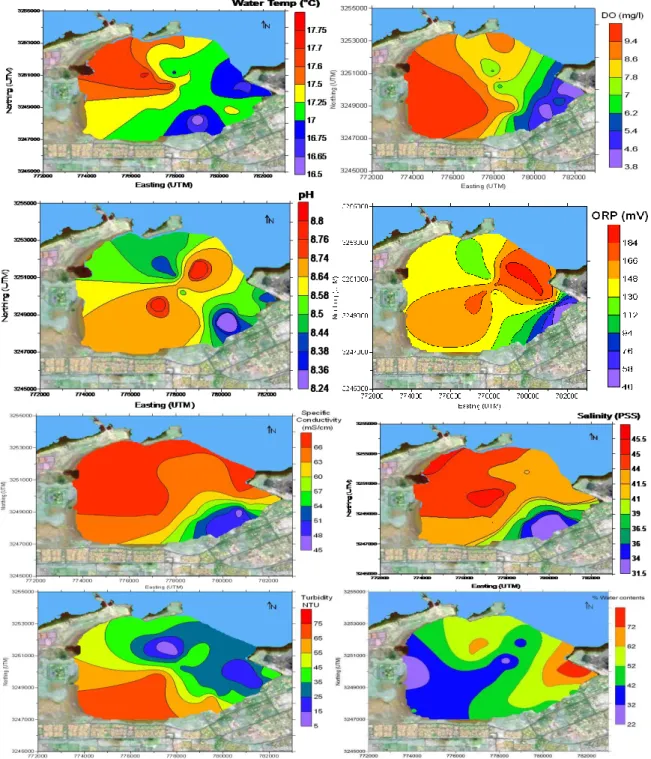
Water Temperature: Figure 2, illustrates measured
water temperatures. The temperature in Sulibikhat bay is affected by effluent discharge. The highest temperature (17.7°C) was observed near an effluent discharge from the Doha power plants at the northwest of the Bay, and temperatures gradually decrease towards the southeast coast. The temperature gradient observed reflects the thermal discharge from power plants in the northwest. Seawater used for cooling the power plants is discharged to the sea in the northwest of Sulaibikhat Bay and this is the likely cause of the increase in temperature of the coastal water in this area (Al-Bakri and Kittaneh, 1998).
12
Table 1: Water column characteristics of Sulaibikhat Bay Station Sampling Date Water Depth (m) Water Temp (°C) DO (mg l-1) pH ORP (mV) Specific Conductivity (mS cm-1) Salinity (PSS) Turbidity (NTU) SS01 04/12/03 1.22 16.8 5.90 8.57 184 65.6 43.8 16.9 SS02 04/12/03 0.61 16.8 4.01 8.51 160 63.5 42.2 20.1 SS03 04/12/03 0.30 16.9 4.00 8.42 78 62.8 41.6 40.0 SS04 04/12/03 0.30 17.2 5.50 8.55 48 59.3 39.9 14.9 SS05 04/12/03 0.61 17.2 5.83 8.55 82 58.8 38.8 20.1 SS06 04/12/03 0.61 17.2 4.50 8.51 91 45.1 38.6 30.1 SS07 04/12/03 0.61 17.4 4.14 8.25 101 50.4 32.6 35.5 SS08 04/12/03 0.61 16.9 5.51 8.34 109 48.8 31.6 31.8 SS09 04/12/03 0.61 16.8 5.80 8.47 115 50.0 33.0 65.2 SS10 04/12/03 0.61 16.5 6.13 8.66 118 53.2 34.7 45.8 SS11 04/12/03 1.22 17.0 9.34 8.67 127 59.4 39.2 37.2 SS12 04/12/03 1.83 17.2 6.61 8.54 126 64.7 42.8 30.7 SS13 04/12/03 5.49 17.0 6.81 8.42 120 64.8 44.1 9.80 SS14 04/12/03 4.57 17.2 7.76 8.40 124 65.8 43.7 9.20 SS15 04/12/03 2.74 17.7 9.10 8.50 134 66.5 44.5 22.4 SS16 04/12/03 2.26 17.5 7.92 8.48 129 66.5 44.4 42.5 SS17 04/12/03 2.44 17.5 9.14 8.47 135 66.5 44.6 32.5 SS23 11/12/03 0.37 17.1 8.36 8.79 188 64.1 41.2 34.8 SS24 11/12/03 0.37 17.3 8.31 8.79 175 63.3 43.5 40.4 SS25 11/12/03 0.27 17.4 8.77 8.73 170 65.1 44.3 44.2 SS26 11/12/03 0.21 17.7 8.47 8.72 171 65.7 45.3 42.5 SS27 11/12/03 0.12 17.5 9.53 8.80 175 67.2 45.1 75.3 SS28 11/12/03 0.09 17.4 9.90 8.75 165 67.0 44.9 68.1 SS29 11/12/03 0.24 17.2 9.92 8.72 161 65.6 43.6 73.5 SS30 11/12/03 0.12 17.3 9.82 8.72 166 65.8 44.0 67.2 Average 1.14 17.2 7.24 8.57 134 61.4 41.3 38.0 STDEV 1.40 0.30 2.00 0.15 36.9 6.60 4.21 19.4 Max 5.49 17.7 9.92 8.80 188 67.2 45.3 75.3 Min 0.09 16.5 4.00 8.25 48.0 45.1 31.6 9.20
SS01: Surface Sediment and sample number. There are no data for SS18–SS22 from the upper tidal flat.
Dissolved oxygen: (DO) concentrations, Figure 2, show
some similarity to temperature variations. The lowest concentrations (4.0 mg l-1) are found in the southeast adjacent to the sewage discharge from the Ghazali
outfall (Table 1). Reduced dissolved oxygen
concentrations in the southeast likely reflect the high oxygen demand of effluents discharged at the Ghazali outfall. Waste water discharges can have high contents of organic matter, which can lead to shortages of dissolved oxygen (DO) as a result of its consumption by the microorganisms decomposing organic matter (Burdige, 1993). In the case of reduced oxygen
concentrations, anaerobic conditions can occur,
particularly close to the sediment–water interface. If this happens, a series of secondary oxidants are utilized by microorganisms to degrade organic matter (Calvert and Pedersen, 1993; Alagarsamy, 1997). If sulphate reduction is established, then sulphides will be produced as organic matter is mineralised. The distinctive smell of hydrogen sulphide was noted during sample collection close to the Ghazali outfall; this supports an
inter-pretation of probable reducing conditions in the southeast of the Bay.
Hydrogen Ion Concentration (pH): is the most
commonly measured chemical parameter in seawater because it influences many biological and chemical processes. It is necessary to have pH data to understand the speciation of trace elements in seawater (Covington and Whitfield, 1988). The pH of the Sulaibikhat Bay seawater ranged between 8.3 and 8.8 with a mean of 8.6. Values of pH appeared to be more alkaline in the centre of the Bay, with lower values measured in the northwest and southeast.
Oxidation–reduction potential (ORP): is known as
redox potential, is measured in millivolts (mV). It is an indication of the equilibrium status of pairs of oxidized and reduced species. Oxygen, iron and sulphur are the most influential substances in determining ORP in many natural environments (UNESCO/WHO/UNEP, 1996). As seen in Figure 2, ORP is highest in the northeast of the Bay and lowest in the southeast, and nearest to the
13
Ghazali outfall where untreated sewage is discharged.ORP values decrease when dissolved oxygen
concentration decrease. Lower ORP values in the southeast are further evidence of reducing conditions in this area.
Specific conductivity: is a measure of the ability of
water to conduct electricity. The conductivity of water is highly dependent on its concentration of dissolved salts (i.e. the total dissolved solids or salinity). The conductivity data illustrated in Figure 2 show that the highest concentrations are observed in the west, near the discharge of effluent from the Doha power plant, and in the northwest. The high salt contents in the northwest bear witness to the discharges from the Doha power
plant, which contain concentrated brine. The lowest concentrations are in the southeast and in front of Kuwait University, where storm water and sewage are discharged.
Salinity: is the dissolved salt content of a body of water
(UNESCO, 1981). The stations with the highest and lowest recorded salinities (Figure 2) correspond approximately to those showing highest and lowest specific conductivities (Figure 2). The highest salinities observed are in the west and northwest, adjacent to the effluent discharge from the Doha power plant. Salinity then decreases to the southeast towards the storm water and sewage outfalls.
Figure 2: Map distribution of water column characteristics of the study area
14
Turbidity: reflects the amount of particulate matter that
is suspended in seawater. As seen in Figure 2, turbidity is highest in the southwest of the Bay between Entertainment City and the Sulaibikhat Sports Club. Turbidity decreases gradually towards Kuwait Bay, with the lowest turbidities recorded in the deepest parts of Sulaibikhat Bay. Al-Ghadban (2004) observed highly turbid water in the far western part of the Kuwait Bay, and clear water within the eastern part and at the entrance of Kuwait Bay (Ghadban, 2004; Al-Ghadban and El-Sammak, 2005).
Water content: water content of sediments depends on
factors such as particle size and packing, pore space, capillary action, time of sampling, and tidal level (flood or ebb) (Al-Bakri and Kittaneh, 1998). The measured water contents are highest in the eastern part of Sulaibikhat Bay near the Shuwaikh Port area, and lowest close to the Entertainment City area in the west. This can be explained by variations in sediment type. Adjacent to Shuwaikh Port, sediments are mainly silty, whereas in the upper tidal flats close to the Entertainment City area, silty sand dominates (as seen in Table 1).
5. DISCUSSION
This study investigated the physiochemical
characteristics of Sulaibikhat Bay. The main finding is that local differences in the characteristics of the water column in Sulaibikhat Bay are caused by thermal discharge from power plants and sewage outfall at Ghazali. Local differences of temperature, salinity and
DO (1.2°C, 13.7 PSS and 5.92 mg l-1, respectively) were
observed in these areas. Changes in water column characteristics because of effluent discharge can have numerous impacts on habitat. Del Pilar Ruso et al. (2008) observed salinity differences of 3.56 PSS in summer and 3.16 PSS in winter in waters adjacent to the Alicante desalination plant in southeastern Spain. They also found that this discharge caused a decrease in the abundance, richness and diversity of a polychaete assemblage along the Alicante coast. At the site of their study, water depth ranged from 4 to 15 m, and the discharged brine accumulated on the seafloor because of its high density. The higher differences of salinity recorded in Sulaibikhat Bay (13.7 PSS) were in water depths between 0.09 and 5.49 m and might be related to the shallower water depth. This study also recorded the lowest level of DO in the southeast of the Bay, adjacent to the Ghazali sewage outfall. The low level of DO is a result of consumption of oxygen by microorganisms decomposing organic matter (Calvert and Pedersen, 1993; Alagarsamy, 1997; Scholz and Neumann, 2007). Bejda et al. (1992) found that, under controlled laboratory conditions, the growth of juvenile fish was significantly reduced at low DO levels, which were
varied diurnally between 2.5 and 6.4 mg l-1 over a
period of 11 weeks. These findings support the view that the high salinity and low DO found in Sulaibikhat
Bay close to points of effluent discharge might have numerous impacts on local habitats and may not support productive marine communities in the Bay. This suggests that more research and further impact assessment studies are warranted.
In this study, low ORP values (48.0–188 mV) were recorded in the southeast of Sulaibikhat Bay. These may be associated with the presence of hydrogen sulphide and pyrite in the sediments and suggest the possibility that reducing conditions prevail because of sulphate reduction associated with the decomposition of organic matter. The high correlation of pyrite with TOC supports the view that the presence of pyrite is an indicator of the presence of sewage waste under anaerobic conditions (UNESCO/WHO/UNEP, 1996). Scholz and Neumann (2007) found that TOC contents decreased with depth in pyrite-rich sediments, indicating that organic matter had been progressively metabolized by microorganisms. In addition, they found that the
release of CO2 into pore water during metabolism was
accompanied by a pH decrease from 7.7 to 6.8. Their findings are consistent with those of this study of Sulaibikhat Bay where, in the core closest to the Ghazali sewage discharge, decreases of TOC with depth from 8.80% to 4.20% were accompanied by the lowest pH recorded in the Bay. This suggests that low pH might be useful as an indicator of active decomposition of organic matter.
6. CONCLUSION
The discharges from the Doha power and desalination plants and the Ghazali sewage outfall all affect the water column within Sulaibikhat Bay. The highest temperature and salinity readings obtained in this study (17.7°C and 45.3 PSS, respectively) were recorded close to effluent discharge points from power and desalination plants. In contrast, there were local reductions in temperature and salinity (16.5°C and 31.6 PSS, respectively) close to the Ghazali outfall. Reduced oxygen concentrations were recorded in the southeast near the Ghazali outfall as a result of the discharge of waste matter with high organic content. This discharge also caused lowering of ORP, so that reducing conditions prevail in this particular area. An abundance of pyrite close to the Ghazali outfall reflects the presence of sewage waste under anaerobic conditions.
ACKNOWLEDGEMENTS
The Authors would like to thank Dr. A. N. Al-Ghadban, Head of the Environmental Science Department at Kuwait Institute for Scientific Research, KISR, for his encouragement and support. The Kuwait Institute for Scientific Research (KISR) is greatly appreciated for its financial support.
15
REFERENCES
[1] Alagarsamy, R. (1997) Trace Metals and Organic Matter Diagenesis at the Oman Margin. PhD Thesis. University of Liverpool. 248pp. [2] Al-Bakri, D. & Kittaneh, W. (1998)
Physicochemical characteristics and pollution indicators in the intertidal zone of Kuwait: implications for benthic ecology. Environmental
Management 22, 415–424.
[3] Al-Ghadban, A. N. & El-Sammak, A. (2005) Sources, distribution and composition of the suspended sediments, Kuwait Bay, Northern Arabian Gulf. Journal of Arid Environments 60, 647-661.
[4] Al-Ghadban, A. N. (2004) Assessment of suspended sediment in Kuwait Bay using Landsat and SPOT images. Kuwait Journal of Science and Engineering 32, 155-172.
[5] Al-Ghadban, A., Al-Majed, N. & Al-Muzaini, S. (2002) The state of marine pollution in Kuwait: Northern Arabian Gulf. Technology 8, 7-26. [6] Al-Sarawi, M. A., Massoud, M. S., Khader, S. R. &
Bou-Olyan, A. H. (2002b) Recent trace metal levels in coastal water of Sulaibikhat Bay, Kuwait.
Technology 8, 27-38.
[7] Bejda, A. J., Phelan, B. A. & Studholme, A. L. (1992) The effect of dissolved oxygen on the growth of young-of-the-year winter flounder,
Pseudopleuronectes americanus. Environmental biology of fishes 34, 321-327.
[8] Burdige, J. (1993) The biogeochemistry of
manganese and iron reduction in marine sediments.
Earth Science Reviews 35(3), 249-284.
[9] Calvert, S. E. & Pedersen, T. F. (1993)
Geochemistry of recent oxic and anoxic marine sediments: Implications for the geological record.
Marine Geology 113, 67-88.
[10] Covington, A. K. & Whitfield, M. (1988) Recommendations for the determination of pH in sea water and estuarine waters. Pure & Applied Chemistry 60, 865-870.
[11] Dames & Moore (1983) Studies for Sabiya area, Kuwait Bay and development of electrical
networks. Aquatic Biology Investigations. Ministry of Electricity and Water, Government of Kuwait. [12] Del Pilar Ruso, Y., De la Ossa Carretero, J. A.,
Gimenez Casalduero, F., Sanchez Lizaso, J. L. (2008) Effects of a brine discharge over soft bottom Polychaeta assemblage. Environmental Pollution 156, (2) 240-250.
[13] Khalaf, F. I., Ghadban, A., Saleh, S. & Al-Omran, L. (1982) Sedimentology and mineralogy of Kuwait Bay bottom sediments, Kuwait – Arabian Gulf. Marine Geology 46(1-2), 71-99.
[14] Khalaf, F. I., Ghadban, A., Saleh, S., and Al-Omran, L. (1981) Sedimentology of Kuwait Bay bottom sediments, . KISR, EES-11E, Final report. Kuwait.
[15] Khalaf, F., Abou-Seida, M., Lo, J. M., Shublaq, W. & Khuraibet. A. (1988) Environmental impact assessment of Al-Akaz Development. KISR-2596, Kuwait Institute for Scientific Research.
[16] KISR (Kuwait Institute for Scientific Research) (1984) Assessment of trace metal and biological pollution in the marine environment of Kuwait.
EES-31A, Environmental and Earth Sciences
Division; KISR-605, Kuwait Institute for Scientific Research.
[17] KISR (Kuwait Institute for Scientific Research) (1999) Assessment of sediment quality in Kuwait Territorial Waters, Phase 1: Kuwait Bay. VS006C, Environmental and Earth Sciences Division,
KISR-5651, Kuwait Institute for Scientific Research.
[18] KISR (Kuwait Institute for Scientific Research) (2003) Tidal flow and sediment conditions at the southwest corner of the Shuwaikh Port. KISR-6659, Environment and Urban Development Division, Kuwait Institute for Scientific Research.
[19] Saeed, T., Khordagui, H. & Al-Hashash, H. (1999) Contribution of power and desalination plants to the levels of volatile liquid hydrocarbons in the nearby coastal areas of Kuwait. Environment International 25, 553-562.
[20] Samhan, O., Zarba, M. & Anderlini, V. (1986) Aeolian contributions of trace metals to marine sediments of Kuwait. Environment International 12, 001-007.
[21] Scholz, F. & Neumann, T. (2007) Trace element diagenesis in pyrite-rich sediments of the Achterwasser lagoon, SW Baltic Sea. Marine
Chemistry 107, (4) 516-532.
[22] UNESCO (1981) Introduction of the Practical Salinity Scale 1978 and the new International Equation of State of Seawater 1980 January 1982. Deep Sea Research Part A. Oceanographic Research Papers 28(12), 1621.
[23] UNESCO/WHO/UNEP (1996) Selection of Water Quality Variables. In: Chapman, D. (Ed.). Water Quality Assessments – A Guide to Use of Biota (2nd Edition); Chapter 3, Sediments and Water in Environmental Monitoring. ISBN 0 419 21590 5.
16
APPENDIX
17
Impact of Barrages on Water Quality of Rivers Upstream and on Air Entrained
in the Hydraulic Jump Downstream
Emad Hamdy Emam
1, Sherine Ahmed El Baradei
2 1Professor and Head at the Department of Construction Engineering,
The American University in Cairo, Egypt
(eimam@aucegypt.edu)
2
Assistant Professor at the Department of Construction Engineering,
The American University in Cairo, Egypt.
(sbaradei@aucegypt.edu)
ABSTRACT
This research studies the impact of barrages on water quality and self-assimilative capacity of rivers and on their temperature. Constructing barrages in river reaches will alter its hydraulics and thus its water quality and thermal regime. A mathematical model is developed to simulate river hydraulics, water quality and temperature. Diurnal dissolved oxygen concentrations are also investigated. A case of a Nile River reach was studied, to investigate the impact of the existence of the Esna barrage on the water quality and temperature in its upstream reach. The barrage has negative impacts on the upstream self-assimilative capacity of the rivers. The waste load that the river could take was only 54 % (at low flow) and 78% (at high flow) from that load when there was no barrage. When simulating the effects of photosynthesis and respiration the above mentioned percentage was raised to 54% and 91% respectively. Although barrages have negative impacts on the upstream self-assimilative capacity of the rivers, they have positive effect on DO concentrations (increase of 6%) in the downstream. The barrage causes a slight decrease in water temperature of 0.13 degree in the month of June. Any barrage will cause at its downstream formulation of hydraulic jumps under its gates when they are opened. The effect of hydraulic jump on air entrained in water was investigated and it was found that the quantity of air entrained was a function in the numbers of opened gates of the barrage and also a function of the depth of opening of those gates.
Keywords: self-assimilative capacity, water quality, hydraulic structure, barrages, mathematical modeling, dissolved
oxygen concentrations, photosynthesis and respiration, thermal regime and water temperature
1. INTRODUCTION
Barrages constructed on a river will change the hydraulic regime of that river by increasing water depths and reducing velocities in the zones of developed backwater curves. This modified hydraulic regime impacts water quality due to changes in the transport and decay processes of pollutants along the rivers. The modified hydraulic regime also impacts the thermal regime the river.
Numerous researchers investigated the effects of hydraulic structures, which create impoundments behind them like dams, on the water quality. Hildyard [9] as an example studied the environmental effects of large dams. There were rare studies investigating the effect of the water level control structures; such as, barrages and weirs on the water quality and its ecosystem. [5] is among the rare researchers who investigated the impact of barrages on water quality in rivers. However Eid used a simplified prismatic river section and considered only atmospheric reaeration and ignored photosynthesis. Many studies such as by Song [11] and Candara [2] were done to simulate water temperatures from air temperatures, but they didn‘t imply the effect of hydraulic structures on the water thermal regime. Eid
studied this impact, but the simulated water temperature was assumed to obey a linear relation and the lag time between water and air temperature wasn‘t considered. This paper studies the impact of barrages on self-assimilative capacity of rivers. In order to do so, water quality indicators were developed aiming to express the impact in a quantifiable manner.
2. RIVER SIMULATION MODEL
The impact of constructing a barrage across a river is numerically modeled. The model consists of two main sub-models; a hydraulic and a water quality sub-models. The water quality sub-model consists of a dissolved oxygen simulator along with its components such as biological oxygen demand, reaeration, photosynthesis,
and respiration. An additional sub-model was
developed; namely the temperature sub-model.
2.1. Hydraulic Sub-Model
The hydraulic sub-model simulates backwater curves, velocities and areas for a controlled river reach of any geometrical shape using the standard-step method.
18
2.2. Dissolved Oxygen (DO) Sub-Model
Using the hydraulic parameters calculated via the hydraulic sub-model, the DO sub-model simulates all available sources and sinks (except NBOD and SOD). A mass-balance equation is solved and yielded the following:
i Q R L K C C K P x A i C i C a a s d average 1 (1)Where;
C
i1= DO concentration at sectioni
1
inmg/L;
C
i = DO concentration at sectioni
in mg/L ;A
= average area of sectionsi
andi
1
inm
2;x
= length of the control volume in
m
;Q
i =discharge over the control volume in day
m3 .
The sources and sinks of eqn (1) are explained in the following paragraphs.
In eqn (1), all sources and sinks are taken to be the average of their concentrations between sections (i) and (i+1).
i i r Q x A K i iL
e
L
1 1 (2)Where;
L
i1= CBOD concentration at sectioni
1
inmg/L;
L
i= CBOD concentration at sectioni
in mg/L;A
= average area of sectionsi
andi
1
inm
2;
x
= length of the control volume in
m
;Q
i= dischargeover the control volume in day
m3 ;
r
K
= averagedecay or loss rate of CBOD in between sections i and i+1
day
1;r
K
=K
d
K
s (3)Where;
K
d = decomposition rate of CBOD in thestream in
day
1;s
K
= settling rate of CBOD inday
1434 . 0
8
3
.
0
h
K
d [12] ;K
s=y
v
s [4] (4&5)Where;
y
= average water depth inm
;v
s= settlingvelocity in m/day.
The exchange of air at the surface of the water makes use of the ―two film theory [10]:
Reaeration = (6)
where;
K
a= volumetric reaeration coefficient in1
day
aK
= 5 . 1 5 . 093
.
3
Y
V
(7)Where;
V
= average velocity;Y
= average depth inm
;s
C
= saturation concentration of DO at certain sectionin mg/L;
C
=DO concentration at certain section inmg/L. The average of the reaeration equation is taken
between two successive sections of the control volume. The essence of photosynthetic process centers about
chlorophylla containing plants which utilize radiant
energy from the sun, convert water and carbon dioxide into glucose, and release oxygen. Thus production of oxygen happens only during daylight hours. The variation of light and hence photosynthesis can be idealized by a half sinusoid function, from day to day. Thus swings in oxygen can be induced by diurnal light variations.
A method called ―Estimation from observed
chlorophyll levels” is used to estimate the value of the
photosynthesis over the control volume. This method assumes that the phytoplankton is the principal source of oxygen. This method requires a direct measurement of the concentration of phytoplankton as represented by
chlorophylla in the water. Since photosynthesis is light
dependent, the relationship between phytoplankton chlorophyll and photosynthetic production depends on solar radiation, depth, and the extinction coefficient. This is described through the following equations [12].
a T op a a G PGI P max1.066 20 (8)Where;
P
a= average daily growth production(photosynthesis) in mgDO/L.day; op a = mg of DO per µg of
chl
a means chlorophylla; P = phytoplankton chlorophyll in µg/L; max G =maximum growth rate of the phytoplankton at 20
C
in1
day
;T
= temperature in
C
;G
I
a =lightattenuation factor over depth and one day (Unitless) Respiration is the process by which organisms take up oxygen and discharge carbon dioxide in order to satisfy their energy requirements.
Pa
R op 0.11.08T20 (9) Where; R= phytoplankton respiration in mgDO/L.day.
In addition to the atmospheric reaeration that happens to the river, there is another reaeration process that takes place across control structures. This process has a positive effect on the DO concentration at the downstream side of the structure. DO is calculated by Gameson‘s equation [1]: )) ( 046 . 0 1 )( )( ( 11 . 0 1 a b T r h (10)
Where; r = ratio of upstream DO deficit to downstream deficit; a = water quality factor; b = structure aeration coefficient; T = water temperature, degree C; h = water level difference across the barrage, ft
C s C a K
19
2.3. Temperature Sub-Model
Water temperature is vital for fauna and flora of water; and for chemical and biological reactions in rivers. Water temperature depends on air temperature and on hydraulic parameters of rivers; such as, depth of water, and geometry of river sections. Constructing a barrage alters the hydraulic regime of water and thus may alter its thermal regime. Heat transferred at the air-water interface is the major factor that induces variation in water temperature. Many researches were done that proved that air and water temperatures are correlated. [11].The U.S Geological Survey department studied some rivers in Texas and concluded that large streams have a small diurnal temperature change [2]. Heinz [8] revealed that the time lag which exists between the air and water temperatures varies linearly with the depth of the river [8]. From his study it was concluded that, the
measured water temperatures follow the air
temperatures closely with some time lag.
Diurnal simulation of water temperature using air temperature was done by expanding the equation of Heinz to accommodate the diurnal water temperature changes. This is described via eqns (11) to (13).
Tat Ta Tw A t Tw * (11)Where; the time t and the time lag δ are in units of days and temperatures are in °C. This equation shows that the water temperature calculated at time t is a function in the air temperature at the time t less the lag time. To calculate the lag time δ the following equation is used:
* * 2 tan * 2 1 depth (12)Where;
= cyclic period over which the study is done(here 24 hours); α = thermal diffusivity coefficient:
* p C K
; K = Surface heat exchange conduction
coefficient between the air and the water in W /
m
2.°C;Cp = the specific heat of water in W.S/Kg. C ; ρ =
density of water in Kg/
m
3; 2 * * * 2 1 1 depth Tair Twater (13)3. ASSESSMENT OF THE SELF-PURIFICATION CAPACITY AND ECOSYSTEM
The self-purification capacity of a river is the capacity of its water to accept different waste load concentrations without changing its original quality. To assess the impact of barrages on the self-assimilative capacity of rivers in a quantifiable manner, many indicators were developed. For example introducing waste loads from point sources at different sections along that river be able to compare between the loading capacity of the
river at different hydraulic cases. The DO concentration in the river is kept at a constant level of 5mg/L.
The effects of temperature and photosynthesis on the diurnal DO variation were also tested, because as mentioned earlier the barrage existence has an impact on water temperature. To study this effect, the diurnal change in water temperature is simulated for the four main hydraulic cases.
4. CASE STUDY NILE RIVER (ASWAN-ESNA REACH)
The case study investigates the effect of Esna barrage on the water hydraulic regime; as well as, on water quality upstream the barrage from Esna to Aswan and on downstream air entrained and DO in the river.
4.1. Hydraulic Simulation of Aswan-Esna Reach (Upstream the Barrage)
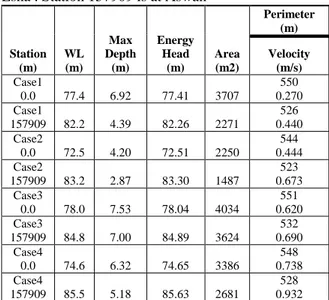
The Esna Barrage is located downstream the Esna-Aswan reach which is 157.9 Km long. The barrage has 11 gates each of which is 12m in width. In most of the cases the lock is the main structure discharging the river water but at some incidences one or two of the barrage gates are opened to allow relief of excess water. The peak discharge of the High dam is about 2500 m3/s and it occurs in July, whereas, the minimum discharge is about 1000 m3/s and occurs in January. Available river sections are every 5 Km and interpolation was used to generate sections every 100 m in order to do hydraulic calculations via the standard step method in an accurate way. Manning coefficient is assumed to be constant (n=0.0287) throughout the simulated reach. The studied reach was simulated under four main hydraulic cases: Cases 1 & 2 study the existence and the non-existence of Esna barrage respectively at low flow conditions; Cases 3 & 4 study the existence and non-existence of barrage respectively at high flow conditions. The results of the calculations and the water level profiles are summarized in the following table:
Table 1: Hydraulic Data of Cases 1 – 4. Station 0 is at Esna . Station 157909 is at Aswan
Station (m) WL (m) Max Depth (m) Energy Head (m) Area (m2) Perimeter (m) Velocity (m/s) Case1 0.0 77.4 6.92 77.41 3707 550 0.270 Case1 157909 82.2 4.39 82.26 2271 526 0.440 Case2 0.0 72.5 4.20 72.51 2250 544 0.444 Case2 157909 83.2 2.87 83.30 1487 523 0.673 Case3 0.0 78.0 7.53 78.04 4034 551 0.620 Case3 157909 84.8 7.00 84.89 3624 532 0.690 Case4 0.0 74.6 6.32 74.65 3386 548 0.738 Case4 157909 85.5 5.18 85.63 2681 528 0.932 ICWEE2011
20
4.2. Self-Purification Capacity and Waste Load at Aswan-Esna Reach
Two scenarios were simulated to compare between
different cases of waste loadings (W.L). Scenario 1 uses
the DO as a function of only CBOD and reaeration.
Scenario 2 adds photosynthesis and respiration to the
DO. Table 2 summarizes all the waste loading cases [10].
Table 2: Simulation of waste loads at different scenarios
Case 1 Case 2 Case 3 Case 4 W.L ( day Kg ) 1405 2612 2118 2705 Scenario 1 Scenario 1 Scenario 1 Scenario 1 W.L ( day Kg) 5684 6218 10971 11768 Scenario 2 Scenario 2 Scenario 2 Scenario 2
4.3. Diurnal Dissolved Oxygen
DO concentration changes during the 24 hours of the day because of change in water temperature and the change in photosynthetic action of plants throughout the day. Minimum DO concentrations usually occur in the early morning, and maximum concentrations occur in the early afternoon. In the simulation a section with average properties (hydraulically and water quality) was taken using simulated diurnal water temperature. The simulation compared the diurnal DO at cases of existence and non-existence of the barrage. To see the effect of the photosynthesis on the diurnal DO, a trial was done using only the CBOD and the reaeration in calculating the DO as opposed to another trial using the photosynthesis.
The curve representing the diurnal DO in case of having the barrage is slightly higher than that curve of the diurnal DO when not having the barrage. This is so because the diurnal water temperatures in case of having the barrage are less than those in case of not having the barrage because in the case of having the barrage the depths are larger so the DO fluctuations are less. So here, the water temperature is the parameter that has the greater effect on the diurnal DO concentrations; and it is known that the temperature is inversely proportionate with the DO concentration.
4.4. Reaeration across the Barrage (Downstream DO Concentrations)
Gameson equation simulated DO concentrations downstream of the barrage. The calculations which are done under low flow conditions revealed an upstream DO concentration of 8.02 mg/L, an upstream DO
deficit/ downstream DO deficit of 3.90, and a downstream DO conc. of 8.49 mg/L.
Figure 1: Comparison of diurnal DO variation due to photosynthesis at Q=1000m3/s and with/without the existence of the Esna barrage
4.5. Effect of the Barrage Gates on the Air Entrained In the Hydraulic Jump Formulated Downstream the Barrage
If the gates of the barrages are opened, then hydraulic jumps are generated below those gates. The generated hydraulic jumps are of different kinds [7].The type of jump is known depending on the calculated Froude number. Depending on the type of the jump, more or less air could be entrained in the water. The ratio between the quantities of air entrained by the hydraulic jump to the water discharge was calculated at different gate openings (namely 0.9 m, 2 m and 3 m) and at low (1000m3/s) and high (2500m3/s) discharges of the river. Also those conditions were investigated at different numbers of opened gates. The ratio was calculated via the two following equations [3]:
w HJ air
Q
Q
/
= 0.014*(Fr - 1)^1.4 (14) This equation works for Froude numbers in thefollowing range 5 < Fr < 25
w HJ air
Q
Q
/
= 0.018*(Fr - 1)^1.245 (15) This equation works for Froude numbers in thefollowing range 2.4 < Fr < 8.7
4.7. Simulation of Water Temperature
The effect of Esna barrage on the thermal regime of water was tested. The simulation of the diurnal variations in the water temperatures on a day of the month of June was done for one section that is representative for the whole reach. This section is taken as the section with the average depth throughout the whole reach. The simulation is done for the previously mentioned, four main hydraulic cases. It is observed that the sinusoidal diurnal water temperature curve follows the air temperature curve but with a lag time between water and air temperatures. This lag time increases with increased depth. Figure 2 shows the diurnal air temperature curve along with the diurnal water temperature curves at both cases 1&2. In case 1 the lag time between air and water temperatures is 5.842 hours,
Comparison of Diurnal DO variations at Q=1000m3/s and with/without the existance of the Esna barrage
5.0130 5.0135 5.0140 5.0145 5.0150 5.0155 5.0160 5.0165 5.0170 5.0175 5.0180 1 3 5 7 9 11 13 15 17 19 21 23
Hours of the day
D O c o n c e n tr a ti o n ( m g /L )
21
whereas in case 2 it was 5.791 hours. The curves show that in case 2 the diurnal water temperature is higher than in case 1. So in case 2 the maximum water temperature during the whole day is 28.4°C, whereas in case 1 it decreases to reach 27.8°C. This indicates that the existence of the barrage causes a decrease in water temperature. When operating under high flow conditions the diurnal water temperature further decreases. So in case 4 the maximum water temperature during the whole day is 27.5°C, whereas in case 3 it decreases to reach 27.3°C. [6]Figure 2: Diurnal air and water temperature at average section and cases of with/without barrage
5. SUMMARY AND CONCLUSIONS
The drawn conclusions are general for any water level control structure, but the calculated percentages are of the Esna barrage case study:
1. The barrage has negative impacts on the upstream self-assimilative capacity of the rivers. At barrage existence the waste load that the river could take (considering CBOD and reaeration only) was only 54 % from that load when there was no barrage and at low
flow conditions. At high flow conditions this load changed to 78%. When adding the effect of the average daily photosynthesis, and respiration the percentages were changed to be 91 % and 93 % respectively. Thus photosynthesis and high flow have positive effect on the self-assimilative capacity of water. As for the diurnal DO variations, it is found to be affected by diurnal water temperatures and photosynthesis values. 2. The barrage has raised the DO concentration downstream by a percentage of 6% from its upstream concentration value.
3. Entrained air in the hydraulic jump downstream the barrage increases with less numbers of gates opened and with decreased depth of gate opening. Also it increases with increased discharge. It is also noted that the entrained air value is calculated to be negative when there is no jump (see tables 4 & 5).
4. The diurnal DO variation is affected by diurnal water temperatures and photosynthesis. The peak DO value that is reached during the 24 hours of the day is increased when photosynthesis component is added to the DO equation.
5. The barrage causes a slight decrease in diurnal water temperature. The average change in diurnal temperature between the cases of with and without barrage is 0.13°C and at high flow and 0.44°C at low flow respectively.
26.7 28.7 30.7 32.7 34.7 36.7 38.7 40.7 1 2 3 4 5 6 7 8 9 10 11 12 13 14 15 16 17 18 19 20 21 22 23 24
Hours of the day
W ater temp er atu re degree s C Tw Q=1000 without barrage Tw Q=1000 with barrage Tair ICWEE2011
22
REFERENCE
Alabama Department of Environmental Management, Water Division-Water Quality Branch , "The ADEM Spreadsheet Water Quality Mode", Alabama
Department of Environmental Management, 2001. Candara and S.C et al., "Water resources data
Texas.,U.S Geological Survey-water data",reportTx-99-4 ,data",reportTx-99-4, 1999.
Chanson, H. " "Air-Water Gas Transfer at Hydraulic Jump with Partially Developed Inflow." Water Res., IAWPRC, Vol. 29, No. 10, pp. 2247-2254, 1995. Chapra, Steven. "Surface Water Quality Modeling", McGraw-Hill International, 1997
Eid, Dhalia M. "Impact Of Flow Control Structures on Rivers Self Purification Capacity", Dissertation, The American University In Cairo, 1992 El Baradei, Sherine A. ―Impact of Control Structure on Ecosystem and Assimilative Capacity of Rivers", Dissertation. Cairo University: faculty of engineering, 2005.
El Baradei. S.A., Emam, E. " Optimum Operating Rules For Barrages", Icastor Journal of Engineering, Vol. 4, No. 1, pp.17 – 27, 2011.
Heinz, S.G. et al. "Stream Temperature Estimation From Air Temperature", Water Resources Bulletin , Vol. 29, No. 1, pp.27-47, 1993.
Hildyard,N..Et al. "The Social and Environmental Effects of Large Dams", San Francisco: Sierra Club Books, 1986
Imam, E, El Baradei, S. "Ecosystem and assimilative capacity of rivers with control structure", 8th Water Pollution Conference. Italy 11-18 September, 2006. Song, Charles C. S. et al. ―Stochastic Properties of Daily Temperature in Rivers", Journal of The
Environmental Engineering Division (ASCE), Vol.103, No. 2 , pp. 217-31, 1977.
Thomann, Robert V. ―Principles Of Surface Water Quality Modeling and Control", Harper Collins, 1987.