HAL Id: hal-02430629
https://hal-mines-albi.archives-ouvertes.fr/hal-02430629
Submitted on 8 Jan 2020
HAL is a multi-disciplinary open access
archive for the deposit and dissemination of
sci-entific research documents, whether they are
pub-lished or not. The documents may come from
teaching and research institutions in France or
abroad, or from public or private research centers.
L’archive ouverte pluridisciplinaire HAL, est
destinée au dépôt et à la diffusion de documents
scientifiques de niveau recherche, publiés ou non,
émanant des établissements d’enseignement et de
recherche français ou étrangers, des laboratoires
publics ou privés.
Effect of porosities on brazed martensitic steel tensile
properties: 2D and 3D pre-mortem vs post-mortem
characterizations
N. Vanderesse, Damien Texier, P. Bocher
To cite this version:
N. Vanderesse, Damien Texier, P. Bocher. Effect of porosities on brazed martensitic steel tensile
properties: 2D and 3D pre-mortem vs post-mortem characterizations. Materials Characterization,
Elsevier, 2020, 160, pp.110084. �10.1016/j.matchar.2019.110084�. �hal-02430629�
E
ffect of porosities on brazed martensitic steel tensile properties: 2D and 3D
pre-mortem vs post-mortem characterizations
N. Vanderesse
a,⁎, D. Texier
a,b, P. Bocher
aaMechanical Engineering Department, École de Technologie Supérieure (ÉTS), 1100 Rue Notre-Dame Ouest, Montreal, H3C 1K3, Quebec, Canada
bInstitut Clément Ader (ICA)– UMR CNRS 5312, Université de Toulouse, CNRS, INSA, UPS, Mines Albi, ISAE-SUPAERO, Campus Jarlard, 81013 Albi Cedex 09, France
Keywords: Tomography Topography Confocal microscopy Porosity Brazed/brittle materials Fractography A B S T R A C T
A quantitative investigation of the porosity and its effects on mechanical properties was conducted on brazed materials presenting macroscopically brittle behavior with various defect levels. Three different techniques for evaluating the porosity and the fracture mechanisms were compared: (i) pre-mortem X-ray computed tomography (XCT), (ii) post-mortem laser scanning confocal microscopy (LSCM), and (iii) post-mortem scanning electron microscopy (SEM). The apparent surface area of the pores was evaluated by segmenting the height maps pro-duced by LSCM and the electron backscattered images propro-duced by SEM. The results show good agreement for different porosity levels. The LSCM height maps for opposite fracture faces were virtually stitched together in order to reconstruct three-dimensional (3D) images of the whole brazed joints. These proved to be similar to the XCT 3D segmented images, yet with some discrepancies due to local plastic deformation. Quantitative volume fraction and spatial distribution of pores were assessed as well as the identification of fracture mechanisms. Interestingly, it was noted that two specimens with different ultimate tensile strengths presented the same porosity amount, but different distributions. Two distinctive features were identified in the broken specimens: plastically teared pillars and walls that were separating the pores before fracture, and plateaus of approximately constant height with micro-sized dimples showing interfacial fracture. Although the specimens exhibited a macroscopic brittle behavior, these features are characteristic of ductile fracture. The most probable scenario for fracture was conjectured as follows: (i) Final fracture occurs in the near-surface region of the samples and conversely early damage develops in the volume, (ii) Interfacial fracture within plateaus is responsible of the rupture/strength of the brazed specimen but detrimental effect is induced by the tearing if highly voided regions are present in the joint.
1. Introduction
Defects in materials and material assemblies, such as incoherent or brittle particles and pores strongly trigger the mechanical performances of structural components. In the case of brazed materials, limiting the occurrence of defects such as cavities and precipitates in joints is a challenge for their in-service integrity. The presence of precipitates has received a lot of attention and brazing processes have been optimized to minimize their size or their presence [1–3] in order to maximize the static and fatigue mechanical properties of the joint [4–8]. However, the presence of porosities within the joint can also severely lower the mechanical strength of the welded assembly [9–13]. Schematically, pores in brazed joints can be caused by various factors among which the most significant are (i) an insufficient cleaning of the surface, (ii) a low wetting of the joint filler on the base metal, (iii) gas bubbles, (iv)
cracking due to uneven thermal expansion of the assembly, and (v) Kirkendall effect due to difference in diffusion rate of the elements constitutive of the brazing paste and the base material. During loading, pores act as stress concentrators that substantially lower the quasi-static tensile strength and creep resistance [11,14], as well as fatigue per-formance [12] of the parts. The characterization of such defects is therefore relevant to better understand damage mechanisms leading to in-service rupture, and to control the components prior to commis-sioning or during in-service inspections.
Several characterization techniques are available to assess two-di-mensional (2D) or three-ditwo-di-mensional (3D) descriptions of defects in materials in a destructive or non-destructive manner, before or after mechanical testing. For instance, optical and/or scanning electron ob-servations of samples cross-sections are relevant tools to quantify 2D porosity [15] and possibly extrapolate the results in 3 dimensions
⁎Corresponding author.
E-mail address:nicolas.vanderesse@ens.etsmtl.ca(N. Vanderesse).
thanks to stereological principles [16]. Among the non-destructive methods, ultrasonic testing is widely used to detectflaws in industrial components and label them as accepted or rejected based on standar-dized criteria [17]. However, care must be taken when attempting to derive localized and quantified porosity characterization, since features such a roughness, defects orientation and cross-section variations can cause artifacts in the formed image [18]. Lock-in thermography, based on the dampening of sinusoidal heat waves in a material [19] can also provide images of defects in joints, as illustrated in Ref. [20]. In their usual configurations, these two latter methods produce 2D images of the defects.
By contrast, X-ray computed tomography (XCT) provides the most comprehensive assessment of inclusions, second phase particles or pores. It is generally carried out on specimens before and during testing [21,22], but can also provide valuable results as a post-mortem analysis tool [23]. This characterization technique presents the advantage to analyze a consequent volume butfinds limitation for large components due to the absorption of X-rays by the material. Trade-off has thus to be found between the thickness of analyzed material and the resolution necessary for defects detection. To that respect, laminography, or XCT applied to thin sheet-like specimens, is a promising technique for in-situ assessing damage development of materials, such as pores nucleation and growth, with a micrometer resolution [24,25]. However, a syn-chrotron radiation is required to achieve such high resolution for large specimens.
To overcome such“resolution/sampled volume” ratios, destructive serial-sectioning/observation techniques are proposed in the literature. Successive polishing [26–28], laser beam [29] or focused/broad ion beam ablation [30–32] operations followed by surface observations enable reconstructing 3D volumes with fine details. However, these destructive techniques do not allow further investigations on the sam-ples and have to be considered as thefinal step in the characterization process.
Fractographic investigations are of common use to identify fracture
mechanisms, generally on one half of the fractured samples. Defects found on fracture surfaces are not necessarily representative of the whole samples but evidence critical configurations responsible for the failure of the samples. In the particular case of porous materials, some features can be particularly investigated, i.e. size, morphology, location, neighborhood interaction, etc. Post-mortem analysis is currently per-formed in scanning electronic microscopy (SEM), and more recently in white light and laser scanning confocal microscopy (LSCM) [33,34]. The latter technique provides topographic characterization with lateral and depth resolutions lower than 0.01μm with an appreciable repeat-ability. Afine analysis on fields of view of several square-millimeters can then be conducted with appropriate spatial resolution.
Fig. 1. Brazing process and position of the specimens (schematic).
Table 1
Chemical composition of the blocks and thefiller material (in weight%).
Fe Cr Cu Ni Mn Si Nb + Ta Pd B
17-4PH SS Bal. 15–17.5 3–5 3–5 < 1 < 1 0.15–0.45 – –
Palnicro™-36M – 9–11.5 – 50 – 0.25–1 – 35–37 2.5–3.25
Fig. 2. SEM micrograph of intermetallic precipitates (borides) at the interface between the substrate and thefiller material.
Fig. 3. Tensile stress-strain curves of the high, medium, and low strength spe-cimens, and corresponding SEM lateral micrographs before fracture ((a) to (c), respectively).
In the present investigation, attention will be paid on the quanti-tative characterization of micrometric pores responsible of premature rupture in macroscopically brittle materials. Brazed materials pre-senting various pore fractions were used to illustrate the feasibility of 3D reconstruction from fracture surface observations. More specifically, a procedure to reconstruct the 3D porosity from LSCM topographic maps of opposite fracture surfaces is presented and compared with pre-mortem XCT and SEM fractographic analyses. LSCM is central in this work since it makes the link between 2D SEM and 3D XCT character-izations. The combination of the three characterization techniques al-lows elucidating the sequence of events leading to the fracture of the specimens. The scope of the LSCM reconstruction technique is not limited to joint materials but englobes various materials subjected to local deformation such as brittle granular materials, fatigued speci-mens, and so forth.
2. Materials and experimental procedures
2.1. Materials
Cylindrical 38-mm-diameter and 38-mm-long blocks made of 17-4 PH® martensitic precipitation-hardening stainless steel (17-4PH SS) were brazed together with a Palnicro™-36M filler metal in the form of paste (Fig. 1). This Ni-base brazing alloy contains a substantial amount of Pd that reduces its melting temperature and enhances its wettability [35]. The nominal composition (weight percent) of the two materials is
reported inTable 1.
Afterfine surface rectification, the two blocks were degreased and chemically cleaned with an HCl acidic solution. They were then spot welded with solder bridges in order to ensure a 60 ± 5μm gap ne-cessary for the dimensional regularity of the joint. The brazing opera-tion was carried out in a furnace under a vacuum pressure of 1.10−5Torr. Due to the thermal inertia of the blocks, the assembly was progressively heated to avoid temperature gradient that could lead to distortions and to excessive liquidation of the brazing alloy. The tem-perature wasfirst held 15 min at 650 °C, then 15 min at 920 °C. At 1038 °C, the paste was injected at four locations in order tofill the gap between the blocks by capillarity. The temperature was held during 3 h, after which the assembly was furnace-cooled.
This brazing condition ensured the absence of eutectic phase in the joint thanks to the diffusion of boron in the base metal. Intermetallic precipitates were observed at the interface between the brazed joint and the base material (Fig. 2). Due to the large dimension of the surface to be brazed, the process generated a gradient of porosity from the edge to the center, allowing samples with various porosity levels to be ex-tracted.
57 mm long dogbone-shape specimens were then wire-electrical-discharge machined with a 1.5 × 3 mm2gage section suitable for
la-boratory XCT and LSCM characterizations. The brazing was centered in the gage length perpendicularly to the loading direction. The specimens were polished down to 0.05μm colloidal silica finish. Three specimens were selected for extended investigations, based on their different Fig. 4. Flowchart analysis detailing the characterization of a specimen.
Table 2
Mechanical properties of the specimens.
Specimen High strength Medium strength Low strength
Ultimate tensile strength (MPa) 1020 757 618
apparent porosity observed at the surface, with tens-of-micrometer large pores mostly located in the mid-section of the joint (Fig. 3(a), (b) and (c)). Tensile tests were performed using a 5 kN microtensile ma-chine (Kammrath & Weiss, Germany) at strain rate 4.10−5s−1. They were strained up to about 85–90% of the expected ultimate tensile strength before being pre-mortem analyzed in XCT.
Fig. 4presents the processing pipeline for each specimen and the associated results. The XCT 3D images were processed to provide 3D porosity measurement and 2D apparent porosity projected along the specimen axis (Section 2.2). After XCT, the specimens were strained again and fractured. All of them demonstrated macroscopic brittle tensile behavior but significantly different tensile strengths (Fig. 3and
Table 2). In the following, the specimens are labelled as high, medium and low strength. They were then investigated post-mortem in SEM and LSCM. The SEM images of the opposite fracture surfaces were quanti-tatively analyzed, providing measurement of 2D porosity (Section 2.3). The LSCM height maps were also analyzed for 2D porosity, and com-bined together to produce 3D thickness maps. The latter was then analyzed for 2D projected porosity and 3D porosity in the same manner as the XCT 3D image (Section 2.4).
2.2. XCT characterization
2.2.1. Acquisition parameters
A restrained region containing the brazed joint for each specimen was characterized with a XT H 225 scanner (Nikon Metrology Inc.,
USA), using the following parameters:
- Tube potential: 120 kV; - Tube current: 100μA;
- Exposure time for each projection: 2000μs; - Number of projections for 360° rotation: 2634.
The numerical resolution was 2.5μm/voxel. Several reconstruction parameters were tested in order to improve the signal-to-noise ratio and correct both beam-hardening effects and ring artifacts. The defects were segmented and analyzed with the open source image analysis programs Fiji [4] and Icy [5].
2.2.2. Segmentation
Strong intensity gradients were observed across the volumetric images, starting from the base material towards the brazing material. For that reason, the defects could not be straightforwardly thresholded using a single gray level. This difficulty arises from the fact the brazing material has a higher density, hence, higher X-ray absorption power, than the base material: 0.86 cm2/g mass-attenuation coefficient for Palnicro™-36M at 100 keV, and 0.37 cm2/g for 17-4 PH® stainless steel
(estimations based on [36] and nominal densities of the main alloying elements presented inTable 1).
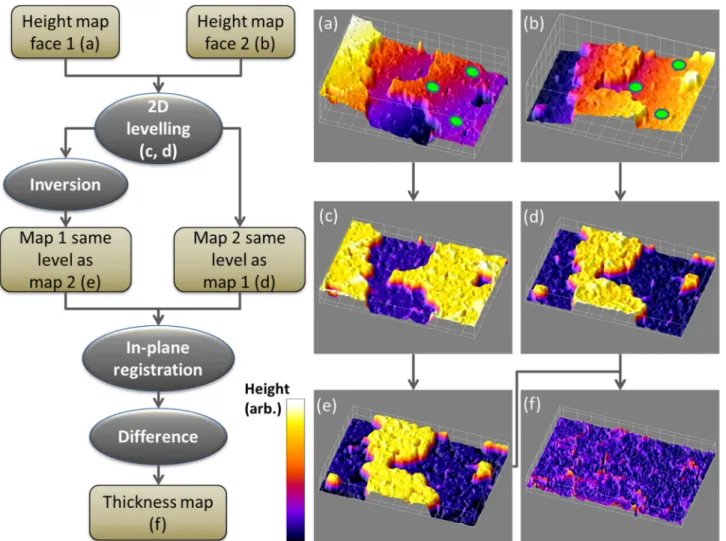
The 3D gray level image hadfirst to be denoised. Since the pores had an elongated section in the vertical direction at this stage of de-formation (85–90% of the ultimate tensile strength), it was possible to Fig. 5. Flowchart and key images for LSCM volume reconstruction of opposite fracture surfaces (tilting angle amplified for visualization purpose). (a), (b): height maps with green disks indicating the points for levelling; (c), (d): levelled height maps; (e): invert of height map (c); (f): thickness map obtained by combining (d) and (e). (For interpretation of the references to colour in thisfigure legend, the reader is referred to the web version of this article.)
filter the volumetric data only in this direction. This operation was performed by an iterative sequence of grayscale morphological open-ings/closings with vertical structural elements of increasing sizes (al-ternating sequential filtering [37]). This operation helped smoothing the data without altering the morphology of the pores. The image could then be automatically thresholded by an Otsu algorithm. After seg-mentation, the 3D porosity fraction was easily measured, as well as the 2D projected porosity fraction.
2.3. SEM fractography
After XCT inspection, the three specimens were strained up to fracture. Fractographic analyses were then conducted with a Hitachi SU-70 field emission gun scanning electron microscope (FEG-SEM)
operating at 15 kV. As discussed in greater details inSection 3.2, the opposite fracture surfaces presented two kinds of visual textures: either smooth or rough. These two features correspond to plastically deformed pores, and plateaus of brazed material covered with dimples, respec-tively. Both regions were discriminated and measured by image ana-lysis. The BSE images werefirst processed in order to enhance their contrast. Two morphological top-hat operations, black and white [38], were then carried out in parallel in order to extract bright and dark details constituting the dimples. The two output images were averaged, resulting in an image showing the plateaus as bright, uniform regions, and the pores in dark. It was then binarized and cleaned in order to remove non-significant details and fill holes in the segmented plateaus. Fig. 6. 3D views of the pores at the mid-section of the specimens characterized by XCT. The blurry region corresponds to the joint. (a), (b), (c): high, medium and low strength samples, respectively.
2.4. LSCM fractography and volume reconstruction
2.4.1. Height maps acquisition
Topographic measurements of the fracture surfaces were performed with a LEXT OLS4100 laser scanning confocal microscope (Olympus, Japan) with a × 20 plan apochromatic lens. Due to the restrictedfield of view (640 × 640μm2), 3 × 6 micrographs were stitched together to
map the entire fracture area. Each individual micrograph had a spatial resolution of 0.63μm/pixel with a height resolution 0.15 μm/intensity level. Both the low wavelength (λ = 405 nm) and the dual confocal system of the confocal microscope ensured high resolution despite the high differences in reflectance of the uneven fracture surface. 2.4.2. Volume reconstruction
The fracture surface height maps were processed with the open source scanning probe microscopy analysis program Gwyddion [6]. The operations are schematically summed up inFig. 5. For each specimen, the height maps were levelled to ensure their horizontality. Three non-aligned points were selected on an iso-height plateau on the surfaces. The whole map was then reoriented so that the points lie at the same height. The height position of each point was averaged over a disk with a radius of 4μm. The same points were selected in the second fracture surface to reorient it. The process is illustrated inFig. 5, with the re-ference points marked as green disks in Fig. 5(a) and (b), and the
levelled maps shown inFig. 5(c) and (d). Once levelled, one map was inverted to reorient it downward (Fig. 5(e)). Finally, both maps were combined in order to produce a so-called“thickness map” (Fig. 5(f)). In this map, null values denote for contact between the opposite faces, positive values correspond to voids or depressions, and negative values denote material interpenetration. The uncertainty of this reconstruction method is evaluated to 5μm, i.e. material interpenetration or voids less than this thickness value must be regarded as artifacts. Aside from re-construction, the individual height maps were segmented for measuring 2D porosity. The thickness map was also characterized in terms of 3D porosity and projected 2D porosity (Fig. 4).
3. Results
3.1. XCT analysis
Pre-mortem XCT 3D images are pictured inFig. 6. For the three specimens, the pores are concentrated within the joint, with varying quantities and planar spatial distributions. The high strength specimen presents a few sparse pores, while the medium and low strength spe-cimens present higher porosity contents. The porosity network in the medium strength specimen appears approximately homogeneous, which contrasts with the low strength specimen that exhibits a large interconnected pore on its left side. Further quantitative Table 3
2D and 3D porosity fractions measured by SEM and LSCM.
Technique & measurement Zone of the specimen High strength Medium strength Low strength
SEM fractography 2D porosity Face 1 0.037 0.450 0.622 Face 2 0.044 0.456 0.588 LSCM fractography 2D porosity Face 1 0.038 0.489 0.532 Face 2 0.051 0.483 0.512 LSCM volume reconstruction Projected 2D porosity Faces 1 & 2 0.036 0.295 0.355 XCT Projected 2D porosity Volume 0.020 0.175 0.320 LSCM volume reconstruction 3D porosity Faces 1 & 2 0.018 0.096 0.118 XCT 3D porosity Volume 0.0057 0.057 0.059
Fig. 7. SEM-BSE micrographs of opposite fracture surfaces (low strength specimen). (a), (c): Global micrographs highlighting interfacial fracture and smooth porous regions (medium and light gray regions, respectively). (b), (d): High magnification micrographs showing interfacial fractured regions covered by dimples (plateaus), pores and necked pillars/walls caused by plastic tearing.
characterization presented below (Table 3,Section 3.5) show that both the medium and low strength specimens have close porosity fractions, the main difference being their distribution.
3.2. SEM fractographic analysis
SEM backscattered electrons (BSE) fractographies of both fracture surfaces of the medium strength specimen are shown inFig. 7. Both images are very similar, with uniform and textured areas (Fig. 7(a) and (c)). Observations at higher magnification (Fig. 7(b) and (d)) allow identifying two kinds of features:
-“plateaus”, or islets of material apparently at the same height, tex-tured at low magnification, and showing dimples at high magnifi-cation;
- walls/pillars, i.e. vertically elongated zones of material, character-ized by thin bright edges, separated by interconnected porosity.
Two different fracture mechanisms were conjectured from this characterization: (i) interfacial fracture leading to the formation of large islets of brazed material with micro-sized dimples, (ii) complete necking/tearing of the brazed material due to the presence of sur-rounding pores, leading to the formation of pillars/walls. It is worth noting that the presence of dimples and complete necking are typical signatures of highly ductile materials, whereas the specimens in-vestigated in this work exhibit macroscopic brittle behavior.
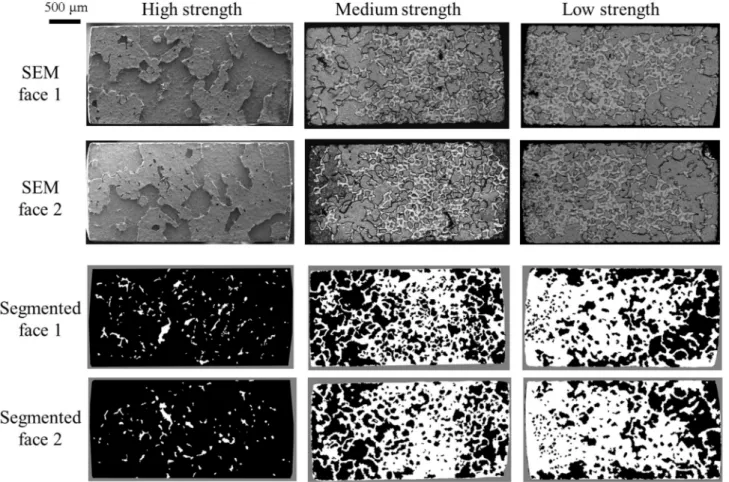
Fig. 8presents the original BSE micrographs of the fracture surfaces and the result of the segmentation operation discriminating the pla-teaus from the pillars/walls (Section 2.3). The specimens exhibit very different porosity spatial distribution, as was already observed by XCT. The high strength specimen has a few sparsely distributed pores, the medium strength specimen presents a connected porosity network, and
the low strength specimen shows a wide porous area extending from the left border to the center. The surface fraction occupied by the apparent porosity is reported inTable 3(Section 3.5).
3.3. LSCM volume reconstruction
Height measurements were performed on both opposite fracture surfaces for each specimen (Fig. 9). As previously shown by SEM fractographic analyses, large“plateau” regions corresponding to inter-facial fractures were found. The height difference between minimal (dark blue regions) and maximal (yellow-orange regions) height pla-teau is about 60μm. This corresponds to the initial thickness of the brazed joint, and evidences the interfacial nature of the fracture me-chanism. The fracture surfaces of the high strength specimen were es-sentially constituted by largeflat regions (“plateaus”) and some small pores sparsely distributed, illustrated by purple areas on the height maps. For the medium and low strength specimens, rough regions lo-cated in the mid-plane of the joint (at ca. 30μm height) were noticed. These regions result from highly torn “pillars/walls” regions sur-rounded by interconnected porosity reported earlier from SEM imaging (Section 3.1). The height maps were segmented in order to discriminate the plateaus from the pores in the mid-plane (Fig. 9, lower). The bi-narized images were then analyzed in terms of apparent 2D porosity (Section 3.5).
Two opposite fracture surfaces of a local area presenting both in-terfacial and“pillars/walls” features are displayed at high magnifica-tion by SEM and LSCM inFig. 10(a) to (d) to illustrate the cavities reconstruction and material interpenetration. Two height profiles A and B over the same region in both faces are plotted inFig. 10(e). The profile of the second fracture surface (B, gray plot) was inverted in height and direction to be directly compared with thefirst one (A, black plot). The region corresponding to profile A inFig. 10(a) is reported Fig. 8. BSE and segmented SEM images for the three specimens.
below the graph to allow direct comparison between height variations and the local fractured features. Both profiles show similar variations, which demonstrates that the height measurement and the maps regis-tration are sufficiently resolved so that quantitative analyses can be conducted.
The height difference between the two profiles, corresponding to the thickness, is plotted in red inFig. 10(e). Areas of the graphfilled in green correspond to thickness values comprised between −5 and +5μm, i.e. artifacts, as mentioned inSection 2.4.2, while areas in red correspond to pores, some of which are as thick as 25 ± 5μm, i.e. values sufficiently high to be distinguished from the regions in contacts. 3.4. Comparison between LSCM volume reconstruction and XCT
The consistency and accuracy of the LSCM thickness measurements demonstrated via line profile in Fig. 10 enable to extend the char-acterization of the porosity to 3D reconstructions using height maps.
Fig. 11 presents the height and thickness maps of the same region, along with 3D views from LSCM reconstruction and XCT. As expected, the thickness map in Fig. 11(b) shows interconnected porosity with positive values (purple to orange regions) and plateaus characterized by low values (dark regions). Interestingly, the border of the plateaus presents negative values, denoting material interpenetration, while the interior is slightly positive, denoting the presence of extended voids that were not observable before fracture. The latter are not represented in the 3D reconstruction and were not considered for the 3D porosity fraction measurements. The LSCM and XCT 3D images,Fig. 11(c) and (d), are similar, yet with larger pores for the former.
Thickness maps were calculated from the whole fracture surfaces of
the three specimens and compared to XCT projected porosity (Fig. 12). A dark layer at the border of the specimen can be observed on each of the LSCM reconstructed images, especially the high strength specimen. This corresponds to a zone of material interpenetration characterized by negative thickness values lower than−5 μm. The rest of the spe-cimen shows mostly positive values, indicating that the fracture sur-faces are concave and present shear lips at the border. Similarly, as already noted inFig. 11, most of the plateaus comprise a central region characterized by positive thickness values in the range of 5 to 10μm (blue areas in the thickness maps inFigs. 11(b) and12) with negative or near zero values at their border. This is especially visible for the low strength specimen. These interfacial voids are not yet present on the pre-mortem XCT results. This confirms that the plateaus are not strictly planar, but rather slightly concave from their border towards their center. From these fractographic topographic results, it is not possible to discriminate the location of the onset of plasticity. However, damage seems to develop on various locations at the interface, forming plateaus after void coalescence. These two distinct observations at the scale of the fracture surface and at the scale of the plateaus, point towards a fracture scenario involving interfacial debonding between the joint and the base material, occurring within the core of the specimen and ex-tending towards its surface. A more detailed discussion of the fracture mechanism is detailed inSection 4.2.
3.5. 2D and 3D porosity fractions
The porosity fraction was measured with different approaches, i.e. the fractography 2D porosity fraction from the SEM and LSCM images, the projected 2D porosity from LSCM volume reconstruction and XCT, Fig. 9. LSCM height maps of opposite fracture surfaces and corresponding segmented images highlighting the pores (white regions on the segmented faces). (For interpretation of the references to color in thisfigure, the reader is referred to the web version of this article.)
and the 3D porosity from LSCM volume reconstruction and XCT (Fig. 4). These different approaches are required since images obtained
with XCT cannot be directly compared with images obtained with SEM. LSCM is central in the present study as it bridges the gap between 2D SEM and 3D XCT observations. For SEM and LSCM, opposite fracture surfaces were analyzed independently to document the fractography 2D
porosity fraction (Figs. 8 and 9). The fraction volume of the pores but also the projected 2D porosity from volume reconstruction were mea-sured for LSCM reconstructed volume and XCT (Fig. 12), considering a joint thickness of 60μm. For the LSCM 3D images, the voids at the center of the plateaus were not taken into account as pores. The results are reported inTable 3and plotted against the ultimate tensile strength Fig. 10. Height distribution and interlock possibility of two opposite fracture surfaces presenting both plateau and“pillars/walls” features. (a), (b): SEM micrographs (image (b) has been mirrored horizontally); (c), (d): corresponding LSCM height maps; (e) height and thickness profiles demonstrating the possibility of 3D re-construction.
Fig. 11. Close-up 2D and 3D views of a fracture surface presenting both interfacial and“pillars/walls” features. (a) LSCM height map; (b) LSCM thickness map; (c) 3D view of the LSCM thickness map; (d) 3D XCT view of the same zone. (For interpretation of the references to color in thisfigure, the reader is referred to the web version of this article.)
(UTS,Table 2) inFig. 13.
Good agreement is observed between the measurements of 2D fractions on opposite faces characterized in SEM and LSCM for the three specimens. This confirms the visual appreciation that the fracture sur-faces are similar (Figs. 8 and 9) and that the data processing is re-producible for both techniques. For this reason, the data for opposite faces are not distinguished on the graph (blue dotted lines inFig. 13). The results follow the same trend, but are contrasted. The ultimate tensile strength decreases with the porosity, yet with different values depending on the measurement technique.
The measurements of 2D porosity fraction by SEM and LSCM are close, except for the low strength specimen. The difference can origi-nate in the different information used for segmentation: texture for SEM, and height values for LSCM. The former is more accurate than the latter, since it is explicitly measured by the technique, while optical texture is qualitatively derived from BSE images.
The 2D and 3D porosity values measured on the reconstructed LSCM images and XCT images (pink solid line inFig. 13) are close, as could be expected from visual appreciation ofFig. 11(c) and (d). The values are much lower than the 2D fractions. The 2D and 3D porosities assessed by XCT were found smaller compared to LSCM and could be explained by the deformation state prior and after fracture. This means that the segmented pores are larger when measured by fractography on opposite surfaces in SEM or LSCM than by 3D LSCM and XCT. The reason is that the pores extend due to plastic shearing at fracture, as evidenced by the presence of pillars/walls already noted in SEM micrographs (Fig. 7). Fractographic observations do not allow the direct segmentation offine pillars/walls and result in higher porosity content in comparison with the projected 2D porosity from reconstructed volume.
As aforementioned, the 3D reconstruction from the LSCM images involves some material interpenetration (Fig. 10). So, despite the fact that the individual LSCM fractographies overestimate the area covered by the pores because of plastic necking, the 3D reconstruction produces realistic results, i.e. close to those obtained by pre-mortem XCT.
The 3D porosity values for the low and medium strength specimens are very close, despite different UTS. However, as already noted, the pores are differently distributed (Fig. 6): the medium strength specimen presents an interconnected porosity network, while the low strength specimen has an extended porous region extending from one of its sides. Therefore, at equal porosity level in the joint, an interconnected net-work is more favorable for mechanical strength.
3.6. Plastic deformation and damage of pre-mortem specimens
The gage sections of the specimens were observed with SEM prior to fracture (Fig. 14). At 85–90% of the ultimate tensile strength, several
slip bands were noticed in the vicinity of pores, parallel to each other and inclined 45°. Slip bands were not transmitted into the substrate material and were confined in the filler material (Fig. 14(a) and (b)). Such observations were typical for low strength and medium strength specimens. Voids/cracks were found to develop at the substrate/filler material interface, most likely due to slip accumulation, leading to the fracture and debonding of the intermetallic borides present at the in-terface between the joint and the base metal (Fig. 14(b)). For high strength specimens, the limited density of pores leads to another de-formation processes: slip bands nearly parallel to the substrate/filler material interface were found and related to the fracture and debonding of intermetallic borides (Fig. 14(c)).
Fig. 12. Thickness maps obtained by LSCM volume reconstruction and XCT. (For interpretation of the references to color in thisfigure, the reader is referred to the web version of this article.)
Fig. 13. Surface and volume porosity fractions (Table 3) measured by SEM (squares), LSCM (disks) and XCT (crosses) vs ultimate tensile strength (Table 2). Dotted lines refer to 2D measurements on fracture surfaces, and solid lines refer to 3D porosities.
4. Discussion
The SEM, LSCM and XCT techniques provide complementary in-formation on the internal porosity and the fracture mechanisms for the three brazed specimens with different mechanical strengths. Both the capability to quantitatively document the presence of pores before and after fracture, and the fracture scenario, i.e. interfacial and “pillars/ walls” fracture mechanisms, will be discussed in the following para-graphs.
4.1. Characterization capabilities
SEM BSE images could put into evidence necking at the interface between the porosity and the brazing material in the form of pillars/ walls. Provided careful image acquisition, the apparent surface fraction of pores could be analyzed with good repeatability on opposite faces. Plateaus of interfacial fracture with micro-sized dimples were also clearly visible, outlining the ductile fracture at the brazed joint/base material interface.
Post-mortem LSCM was able to measure the height of the plateaus. They correspond to the thickness of the joint, i.e. approximately 60μm. As with the SEM images, the measured surface porosity fractions for opposite surfaces were close (Table 3). However, both 2D SEM and LSCM methods overestimated the actual pre-mortem porosity fraction measured by XCT for the low and medium strength specimens. This was caused by the necking of the walls between the pores, which is difficult to discriminate in LSCM, and even more in the SEM images.
Furthermore, the fracture surfaces could be assembled thanks to a specially designed process, producing a 3D reconstructed thickness map. This 3D reconstruction comes with some approximations since material interpenetration cannot be avoided as soon as local plasticity occurs in the fracture process. Nevertheless, the 3D images compare well with the pre-mortem XCT images, as do the measured porosity le-vels. Indeed the local material interpenetration corrects the plastic tearing effect responsible for the formation of pillars/walls and reduces the apparent width of the pores after fracture.
More importantly, the thickness maps inFig. 12puts into evidence the presence of voids at the center of the plateaus that are not present before fracture, showing that interfacial rupture develops more and earlier in the center region of the brazed interface. This point is further addressed in the fracture scenario proposed below.
It should be noted that the various segmentation processes and characterization methods put into practice in this work were designed with ad hoc, optimized parameters. Their application to other materials
would of course require preliminary calibrations. Provided these pcautions are taken, the LSCM technique and its associated 3D re-constructed method can be applied to fractured parts undergoing strain localization. In particular, it canfind applications in cases where por-osity isfine and scattered in large, X-ray absorbing specimens and in which conventional SEM can only provide qualitative characterization.
4.2. Fracture scenario
On the overall, the three techniques help establishing the most probable scenario for the global ad local fracture event. While the macroscopic curves are typically brittle (Fig. 3), the local mechanisms are not, i.e. ductile features on the fracture surfaces (Fig. 7) and intense slip bands on the specimen gage (Fig. 14). In order to illustrate the deformation and fracture scenario occurring in brazed joints, schematic illustrations at different deformation stages are presented inFig. 15. As pores concentrate the macroscopic strain and early plasticity is ex-pected in their proximity, the intense slip activity is activated. How-ever, slip activity is present only in thefiller material and not trans-mitted in the substrate (Fig. 15(b)). Therefore, the surfaces of pores freely accommodate the plastic deformation while the substrate/filler material interfaces are subjected to plastic accumulation. Pores gradu-ally deform as the macroscopic strain increases while the stress in-creases in the regions supporting the load. The islets of material be-tween the pores lead to two different cases of damage depending on the interconnexion between the pores (Fig. 15(c)). In the case of distant pores (high strength specimen), slip bands interact with the substrate/ filler material interface and voids develop subsequently at this interface due to local plasticity accumulation, resulting in interfacial debonding when increasing the macroscopic deformation (Fig. 15(d)). In regions where pores are close to each other (medium and low strength speci-mens), slip activity in thefiller material between pores leads to severe deformation and to a complete necking due to deformation accom-modation. This is enhanced by the free-surface of pores that increase the local triaxiality. Necking generates elongated walls and pillars on the fracture surface (Fig. 15(e). This sequence of events is similar to the classical nucleation-growth-coalescence mechanisms undergoing in other materials [22,39]. The cracks nucleate at a brazed interface due to the presence of the precipitates (Figs. 1 and 14), but they coalesce thanks to the contribution of pre-existing pores.
Based on these considerations, the most probable hypothesis for the relationship between the strength of specimens and their porosity is that the nucleating and propagating of interfacial cracks represent the energy required to fracture specimen. Thus, the porosity fraction and Fig. 14. SEM-BSE micrographs of pre-mortem specimen gage zone showing different deformation and damage processes. (a) Medium strength specimen: low magnification of the showing intense slip activity in the vicinity of pores and non-slip transfer into the substrate, (b) magnified region of the white dashed box depicted in panel (a) showing slip bands parallel to each other and inclined at 45° (vertical lines are traces of polishing lines), (c) high strength: specimen interfacial deformation and related debonding damage at an interface boride.
their spatial distribution control the localization of the deformation energy on the joint's ligaments and the stress level required to fracture the joint.
More specifically, the stress state in the material separating the pores depends on the distance between the pores and their inter-connectivity. In the case of low porosity fraction (high strength spe-cimen), these regions are wide and undergo moderate stress triaxiality, which results in high critical strains for interface crack nucleation. By contrast, joints with higher porosity fraction and connectivity induce higher stress triaxiality between the pores, resulting in lower local critical strains for interface crack nucleation, and consequently lower macroscopic strains for fracturing the sample. To this regard, the main difference between the medium and low stress specimen resides in the porosity spatial distribution and their interconnection (the volume fractions measured by XCT and LSCM reconstruction being very close in both samples). In the low strength specimen, the cracks must nucleate first in the narrow plateaus on the left (Fig. 12), and then extend to the right resulting in a fast failure as these represent less than half of the section of the joint. In the medium strength specimen, an intermediate strain level is required as a combination of large and narrow plateaus is found.
Further work should concentrate on the strain concentration due to the pores in quasi-static and cyclic conditions. Digital image correlation would prove a valuable method for measuring the local strain at the surface and relate it to the actual 3D porosity geometry assessed either by XCT or LSCM.
5. Conclusions
In order to understand the discrepancy in term of mechanical strength of 17-4 PH stainless steel brazed specimens, three character-ization techniques with custom designed data processing algorithms were put into practice. They aimed at documenting the levels of por-osity: post-mortem SEM imaging, post-mortem LSCM topographic ima-ging with volume reconstruction, and pre-mortem XCT-scanning. The distinctive features caused by the fracture mechanisms, i.e. the presence of plateaus with micro-sized dimples and interconnected pores with walls and pillars, were quantified in terms of surface fraction and vo-lume.
The three methods proved to be complementary. SEM imaging is an efficient and fast way to quantify pores and analyze a fracture surface and mechanisms. An adapted image analysis pipeline was developed and put into practice to quantify the features related to fracture me-chanisms. LSCM height acquisition is slower than SEM, but it yields height data that could not be measured otherwise. Moreover, opposite fracture surfaces can be virtually stitched, which gives the possibility to evaluate the porosity volume and spatial distribution, yet with some uncertainty due to severe deformation as compared to pre-mortem XCT characterization.
In the present case study, these techniques helped establishing the most probable scenario for failure of brazed specimens exhibiting fra-gile macroscopic behavior, yet typically ductile microscopic fracture features. In particular, the 3D LSCM images, or thickness maps, re-vealed that the plateaus were slightly plastically deformed at their border, as well as the specimens near their surface. It was conjectured that the cracks develop at the center of the specimens, and more pre-cisely at the center of the plateaus. The amount of pre-existing pores Fig. 15. Schematic sequence of events leading to fracture. (a): Initial state with pores, (b): slip activity in the vicinity of pores and at the brazing interface; (c) nucleation of voids at the interface due to strain accumulation and necking between close pores; (d) growth of a crack at the joint/substrate interface leading to voids coalescence (interfacial debonding/plateaus formation); (e): sudden fracture, local necking between the pores after interfacial decohesion has completed.
and their spatial distribution account for the ranking between the high, medium and low strength specimens. The interconnection of the pores, which can be readily put into evidence by XCT or LSCM volume re-construction, is a good indicator for the magnitude of stress triaxiality required to nucleate cracks at the interface between the joint and the base material.
Declaration of competing interest
The authors declare that they have no known competingfinancial interests or personal relationships that could have appeared to influ-ence the work reported in this paper.
Acknowledgements
The authors would like to thank Bruno Jetté (École de technologie supérieure) for operating the XCT and for his advices on data proces-sing, Daniel Turner (Pratt and Whitney Canada) for his contribution in the manufacture of the samples, and Nora Aminer for her contribution in the design of samples to be extracted from the brazed blocks. The authors gratefully acknowledge the Ministère de l'Économie, de la Science et de l'Innovation - Québec for the grant attributed via the Research Support Program (PSR), Component 4: Support for International Research and Innovation Initiatives (SIIRI) on the “Optimization of functional graded properties for aeronautic applica-tions”.
Data availability
The raw and processed data required to reproduce this work cannot be shared at this time due to technical reasons.
References
[1] A. Sakamoto, C. Fujiwara, T. Hattori, S. Sakai, Optimizing processing variables in high-temperature brazing with nickel-basedfiller metals, Weld. J. 68 (3) (1989) 63–71.
[2] J. Ruiz-Vargas, N. Siredey-Schwaller, N. Gey, P. Bocher, A. Hazotte, Microstructure development during isothermal brazing of Ni/BNi-2 couples, J. Mater. Process. Technol. 213 (1) (2013) 20–29.
[3] M.A. Arafin, M. Medraj, D.P. Turner, P. Bocher, Transient liquid phase bonding of Inconel 718 and Inconel 625 with BNi-2: modeling and experimental investigations, Mat Sci Eng a-Struct 447 (1–2) (2007) 125–133.
[4] Y. Luo, Q. Zhang, W.C. Jiang, Y.C. Zhang, M.M. Hao, S.T. Tu, The microstructure, mechanical properties and fracture behavior of hastelloy C276-BNi2 brazed joint, Mater. Des. 115 (2017) 458–466.
[5] J.Q. Chen, V. Demers, E.L. Cadotte, D. Turner, P. Bocher, Structural performance of Inconel 625 superalloy brazed joints, J. of Materi Eng and Perform 26 (2) (2017) 547–553.
[6] M. Koster, A. Lis, W.J. Lee, C. Kenel, C. Leinenbach, Influence of elastic-plastic base
material properties on the fatigue and cyclic deformation behavior of brazed steel joints, Int. J. Fatigue 82 (2016) 49–59.
[7] L.O. Osoba, O.A. Ojo, Influence of solid-state diffusion during equilibration on microstructure and fatigue life of superalloy wide-gap brazements, Metall Mater Trans A 44A (9) (2013) 4020–4024.
[8] X.G. Yang, C.L. Dong, D.Q. Shi, L. Zhang, Experimental investigation on both low cycle fatigue and fracture behavior of DZ125 base metal and the brazed joint at elevated temperature, Mat Sci Eng a-Struct 528 (22−23) (2011) 7005–7011. [9] S. Beretta, M. Boniardi, Microstructure and fatigue properties of a welded duplex
stainless steel, Fatigue Fract Eng M 19 (6) (1996) 647–654.
[10] R. Didziokas, J. Januteniene, J. Jonaityte, The impact of the internal welding de-fects on the joint strength, Transport 23 (3) (2008) 240–244.
[11] C. Leinenbach, H.J. Schindler, T.A. Baser, N. Ruttimann, K. Wegener, Quasistatic fracture behaviour and defect assessment of brazed soft martensitic stainless steel joints, Eng. Fail. Anal. 17 (3) (2010) 672–682.
[12] C. Leinenbach, M. Koster, H.J. Schindler, Fatigue assessment of defect-free and defect-containing brazed steel joints, J. of Materi Eng and Perform 21 (5) (2012)
739–747.
[13] A. Hasap, N. Noraphaiphipaksa, C. Kanchanomai, Torsional strength and failure of copper alloy brazing joint, Eng. Fail. Anal. 48 (2015) 174–184.
[14] Y. Luo, C.L. Wang, W.C. Jiang, Y. Wan, W.Y. Zhang, Y. Wang, Effects of inner de-fects on creep damage and crack initiation for a brazed joint, High Temp Mat Pr-Isr 37 (9–10) (2018) 863–872.
[15] S. Meimandi, N. Vanderesse, D. Thibault, P. Bocher, M. Viens, Macro-defects characterization in cast CA-6NM martensitic stainless steel, Mater. Charact. 124 (2017) 31–39.
[16] H.J.G. Gundersen, Stereology of arbitrary particles, J. Microsc. 143 (1) (1986) 3–45.
[17] V.A. Barkhatov, Development of methods of ultrasonic nondestructive testing of welded joints, Russ J Nondestruct+ 39 (1) (2003) 23–47.
[18] H.H. Boukani, M. Viens, S.A. Tahan, M. Gagnon, Case study on the integrity and nondestructive inspection offlux-cored arc welded joints of Francis turbine runners, Int J Adv Manuf Tech 98 (5–8) (2018) 2201–2211.
[19] C. Meola, G.M. Carlomagno, A. Squillace, G. Giorleo, Non-destructive control of industrial materials by means of lock-in thermography, Meas. Sci. Technol. 13 (10) (2002) 1583–1590.
[20] C. Meola, A. Squillace, F.M.C. Minutolo, R.E. Morace, Analysis of stainless steel welded joints: a comparison between destructive and non-destructive techniques, J. Mater. Process. Technol. 155 (2004) 1893–1899.
[21] J.Y. Buffiere, H. Proudhon, E. Ferrie, W. Ludwig, E. Maire, P. Cloetens, Three di-mensional imaging of damage in structural materials using high resolution micro-tomography, Nucl Instrum Meth B 238 (1–4) (2005) 75–82.
[22] E. Maire, T. Morgeneyer, C. Landron, J. Adrien, L. Helfen, Bulk evaluation of ductile damage development using high resolution tomography and laminography, Cr Phys 13 (3) (2012) 328–336.
[23] N. Vanderesse, E. Maire, A. Chabod, J.Y. Buffiere, Microtomographic study and finite element analysis of the porosity harmfulness in a cast aluminium alloy, Int. J. Fatigue 33 (12) (2011) 1514–1525.
[24] Y. Shen, T.F. Morgeneyer, J. Garnier, L. Allais, L. Helfen, J. Crépin, Three-dimen-sional quantitative in situ study of crack initiation and propagation in AA6061 aluminum alloy sheets via synchrotron laminography andfinite-element simula-tions, Acta Mater. 61 (7) (2013) 2571–2582.
[25] E. Maire, P.J. Withers, Quantitative X-ray tomography, Int. Mater. Rev. 59 (1) (2014) 1–43.
[26] L. Signor, P. Villechaise, T. Ghidossi, E. Lacoste, M. Gueguen, S. Courtin, Influence of local crystallographic configuration on microcrack initiation in fatigued 316LN stainless steel: experiments and crystal plasticityfinite elements simulations, Mat Sci Eng a-Struct 649 (2016) 239–249.
[27] D.J. Rowenhorst, A.C. Lewis, G. Spanos, Three-dimensional analysis of grain to-pology and interface curvature in aβ-titanium alloy, Acta Mater. 58 (16) (2010) 5511–5519.
[28] J. Madison, J. Spowart, D. Rowenhorst, J. Fiedler, T. Pollock, Characterization of three-dimensional dendritic structures in nickel-base single crystals for investiga-tion of defect formainvestiga-tion, Proceedings of the Superalloys Conference, Champion, PA, USA (2008) 14–18.
[29] M.P. Echlin, M. Straw, S. Randolph, J. Filevich, T.M. Pollock, The TriBeam system: femtosecond laser ablation in situ SEM, Mater. Charact. 100 (1–12) (2015). [30] M.D. Uchic, M.A. Groeber, D.M. Dimiduk, J.P. Simmons, 3D microstructural
char-acterization of nickel superalloys via serial-sectioning using a dual beam FIB-SEM, Scr. Mater. 55 (1) (2006) 23–28.
[31] L.A. Giannuzzi, Introduction to Focused Ion Beams: Instrumentation, Theory, Techniques and Practice, Springer Science & Business Media, 2004.
[32] T.L. Burnett, R. Kelley, B. Winiarski, L. Contreras, M. Daly, A. Gholinia, M.G. Burke, P.J. Withers, Large volume serial section tomography by Xe plasma FIB dual beam microscopy, Ultramicroscopy 161 (2016) 119–129.
[33] J. Lopez-Cepero, A. de Arellano-Lopez, J. Quispe-Cancapa, J. Martínez-Fernández, Confocal microscopy for fractographical surface characterization of ceramics, Microsc. Anal. 109 (2005) 13.
[34] E. Merson, V. Danilov, D. Merson, A. Vinogradov, Confocal laser scanning micro-scopy: the technique for quantitative fractographic analysis, Eng. Fract. Mech. 183 (2017) 147–158.
[35] E. Lugscheider, H. Pelster, Nickel basefiller metals of low precious metal content; Métaux d’apport à base de nickel à faible teneur en éléments précieux, Weld. J. 62 (10) (1983) 261s–266s.
[36] J.H. Hubbell, S.M. Seltzer, Tables of X-Ray Mass Attenuation Coefficients and Mass Energy-Absorption Coefficients (Version 1.4), (National Institute of Standards and Technology, Gaithersburg, MD.)
[37] J. Serra, L. Vincent, An overview of morphologicalfiltering, Circ Syst Signal Pr 11 (1) (1992) 47–108.
[38] L. Vincent, Morphological grayscale reconstruction in image analysis: applications and efficient algorithms, Ieee T Image Process 2 (2) (1993) 176–201.
[39] A. Pineau, A.A. Benzerga, T. Pardoen, Failure of metals I: brittle and ductile frac-ture, Acta Mater. 107 (2016) 424–483.