DOCTORAT DE L'UNIVERSITÉ DE TOULOUSE
Délivré par :Institut National Polytechnique de Toulouse (Toulouse INP)
Discipline ou spécialité :
Génie Electrique
Présentée et soutenue par :
Mme NAJOUA ERROUI le vendredi 15 novembre 2019
Titre :
Unité de recherche : Ecole doctorale :
High power conversion chain for hybrid aircraft propulsion
Génie Electrique, Electronique, Télécommunications (GEET)
Laboratoire Plasma et Conversion d'Energie ( LAPLACE)
Directeur(s) de Thèse :
M. GUILLAUME GATEAU M. NICOLAS ROUX
Rapporteurs :
M. ERIC LABOURE, SUPELEC
M. YVES LEMBEYE, UNIVERSITE GRENOBLE 1
Membre(s) du jury :
Mme XUEFANG LIN-SHI, INSA LYON, Président M. GUILLAUME FONTES, TOULOUSE INP, Invité M. GUILLAUME GATEAU, TOULOUSE INP, Membre M. JEAN-FRANCOIS ALLIAS, AIRBUS FRANCE, Invité
M. NICOLAS ROUX, TOULOUSE INP, Membre
1
Remerciements
Ces travaux ont été réalisés au sein du laboratoire LAPLACE (Laboratoire Plasma et Conversion d’Energie) à Toulouse et s’intègrent aux travaux de recherche du groupe CS (Convertisseurs Statiques) et GENESYS (Groupe Energie Electrique et Systémique).
Je tiens à remercier en premier lieu mes directeurs de thèse Nicolas Roux et Guillaume Gateau d’avoir dirigé cette thèse. Nos interactions ont été très riches et j’ai beaucoup appris grâce à vous.
Je souhaite remercier aussi les différents membres du jury : Mme Xuefang LIN-SHI pour sa participation en tant que présidente du jury ainsi que pour l’intérêt qu’elle a montré pour mon travail, MM. Eric LABOURE et Yves LEMBEYE pour avoir rapporté cette thèse ainsi que pour leurs commentaires lors de la soutenance ainsi que MM. Jean-François ALLIAS et Guillaume FONTES.
Je voudrais également remercier tous mes collègues du projet HASTECS pour toutes les discussions constructives notamment Falvio, Matthieu, Sarah, Philippe, Amal, Maillys et Malik.
Je voudrais aussi remercier les permanents du laboratoire pour leur aide et leur bienveillance et que j’ai côtoyé avec plaisir durant ces trois années de thèse. En particulier Didier Flumian, Jacques Benaioun, Xavier Roboam, Fréderic Richardeau, Marc Cousineau, Eric Bru, Henri Schneider, Amine Jaafar, Nicolas Rouger, Philippe Ladoux, Hubert Piquet, Christophe Turpin, Sebastien Vinnac. Merci également à Jessica Toscano pour son aide sur les démarches administratives. Je tiens aussi à remercier Jean-Marc Blaquière pour son aide pour la conception des bus bar et pour ses conseils techniques.
Merci à tous mes amis et collègues doctorants pour vos discussions et votre soutien : Kepa, Vanesa, Vinicius, Yazan, Youness, François, Timothé, Clément, Olivier, Andallah, Davin, Andrea V., Andrea E., Jaime, Frederico, Plinio, Hugo, Tiago, Guilhermé, Rémi, Jordan, Quentin, Jessica, Lucille, Morgane, Joseph, Alvaro, Kamil, Sami, Abdelkader, Khaled, Alexandre, Andy et Yann. J’en oublie tant d’autres, je vous prie de m’excuser.
Un grand merci à Miguel et Bernard d’avoir partagé avec moi les moments de joies et surtout ceux de déprime pendant ces trois années. Merci à Victor et Bouazza pour vos conseils précieux et votre soutien.
Merci à Anne et Arnaud C. qui étaient à mon écoute dans mes périodes de doute et m’ont toujours soutenu dans les moments les plus difficiles.
Un énorme merci à Soukaina, Youness et Reda d’avoir été à mes côtés dans les bons moments et ceux un peu plus stressants.
Je remercie infiniment ma deuxième famille : Maxime, Guillaume, Isabelle, Clément, Léa, Chloé, Adrien, Ichrak, Mathieu, Arnaud J. et Estelle qui ont toujours été à mes côtés et m’ont encouragé pour aller au bout de cette aventure.
Pour finir, je remercie mes parents et ma famille qui m’ont toujours soutenu et sans qui je n’aurai jamais pu prendre ce chemin. Ils ont su faire preuve de patience et sans lesquels je n'en serais pas là aujourd'hui. J’espère que vous êtes fiers de moi.
3
Résumé
Ces dernières années, l’utilisation des systèmes de transport aérien s'est considérablement amplifiée. Par conséquent, les considérations environnementales actuelles poussent à réduire leur utilisation. Des projets tels que Clean Sky 2 tentent d’apporter une réponse à ce problème, en proposant une réduction des émissions de CO2 et des nuisances
sonores. Le recours à l’hybridation de la propulsion des avions réduirait ces émissions en réduisant la taille et la masse des systèmes et en utilisant des systèmes électriques plus efficaces ce qui permettrai d’augmenter le nombre de passager. Cela permettrait de réduire la consommation de carburant et donc les émissions polluantes.
Ces travaux s'inscrivent dans le cadre du projet européen HASTECS Clean Sky 2 qui vise à optimiser l'ensemble de la chaîne électrique de l'avion à propulsion hybride en intégrant toutes les contraintes aéronautiques telles que les décharges partielles pour les équipements électriques placés en zone non pressurisée. Le projet HASTECS s'est fixé le défi de doubler la densité de puissance des machines électriques pour passer de 5 kW/kg à 10 kW/kg, y compris leur refroidissement, tandis que pour l'électronique de puissance, avec son système de refroidissement, le but sera de passer à 15 kW/kg en 2025 et à 25 kW/kg en 2035.
Pour augmenter la densité de puissance, la masse du système de refroidissement doit être diminuée dans un premier temps soit en optimisant ses composants, ce qui est fait par le 4ème lot de travail (WP4), soit en réduisant les pertes. La réduction des pertes de l'onduleur pourrait être obtenue en utilisant de semi-conducteurs de faible calibre en tension, en jouant sur les stratégies de modulation ou en utilisant des semi-conducteurs plus performants. La première option peut être faite en utilisant des architectures multi-niveaux pour éviter l'association en série direct. Contrairement à l'association directe en série, l'association parallèle est plus facile à gérer en termes de commande d’interrupteurs, ce qui a été autorisé dans nos études. Plusieurs topologies d'onduleurs (topologies à 2, 3 et 5 niveaux) et stratégies de modulation (PWM, injection de troisième harmonique, PWM discontinu et pleine onde) ont été comparées en utilisant plusieurs technologies de semi-conducteurs pour choisir la solution la plus performante en termes de rendement et de densité de puissance. Pour le profil de mission considéré, l'onduleur pourrait être dimensionné pour le point de puissance maximum (décollage) ou la phase de vol la plus longue (croisière). Une étude comparative des stratégies de modulation a été réalisée pour mettre en évidence la structure et la modulation présentant les meilleures performances afin de minimiser les pertes pour les points de dimensionnement choisis en utilisant les topologies les plus intéressantes pour le profil de mission étudié en utilisant deux configurations différentes de bobinage du moteur électrique proposées par le WP1.
Mots clés
Propulsion aéronautique hybride, Onduleur multiniveaux, Stratégies de modulation, Semi-conducteurs, Electronique de puissance.
5
Abstract
Recently, the use of air transport systems has increased considerably. Therefore, the current environmental considerations are pushing to reduce their ecological impact. Projects such as Clean Sky 2 provide an answer to this problem, by proposing a reduction in CO2
emissions and noise pollution. The development of a hybrid-electric aircraft would reduce these emissions by reducing the size and weight of the systems and using more efficient electrical systems. This would reduce fuel consumption and therefore pollutant emissions.
This work takes part into HASTECS Clean Sky 2 European project which aims to optimize the complete electrical chain of the hybrid aircraft integrating all aeronautical constraints such as partial discharges for electrical equipment placed in the non-pressurized zone. HASTECS project has set itself the challenge of doubling the specific power of electric machines including their cooling from 5 kW/kg to 10 kW/kg, while the power electronics, with their cooling system, would evolve from 15 kW/kg in 2025 to 25 kW/kg in 2035.
To increase the specific power, the cooling system mass should be decreased either by optimizing its components which is done by the 4th work package (WP4) or by reducing power losses. Inverter losses reduction could be achieved by using small voltage rating components, by playing on modulation strategies or by using more performant semiconductors. The first option could be done by using multilevel architectures to avoid the direct series association. Unlike direct series association, the parallel one is easier to manage in terms of switches command so it was allowed in our studies. Several inverter topologies (2-, 3- and 5-level topologies) and modulation strategies (PWM, third harmonic injection, discontinuous PWM and full-wave) were compared using several semiconductors generations to choose the most performant solution in terms of efficiency and specific power. For the considered mission profile, the inverter could be sized for the maximum power point (takeoff) or the most extended flight phase (cruise). A comparative study of modulation strategies was carried out to highlight the structure and modulation presenting the best performance to minimize the losses for the chosen sizing points using most interesting topologies for the studied mission profile using two electrical motor windings configurations proposed by WP1.
Key words
Hybrid aircraft propulsion, Multi-level inverter, Modulation strategies, Semiconductors, Power electronics.
Contents
Remerciements ... 1 Résumé ... 3 Abstract ... 5 Contents ... 7 List of figures ... 9 List of tables ... 14 List of acronyms ... 17 General introduction ... 19I. State of the art and context ... 21
1. Hybrid-electric propulsion aircraft 21 i. Hybrid and electric propulsion aircraft evolution 23 ii. Hybrid-electric architectures 25 iii. Energy management for the studied solution 27 2. Problematic and objectives 27 i. HASTECS project 27 ii. Hybrid-electric components specific power targets 28 iii. Flight mission profile 29 iv. HASTECS work packages 30 v. Work Package 2 (WP2) 33 3. Reference case: 2-level PWM inverter solution 34 4. Conclusion 36 II. Simulation tool ... 39
1. Software organization 40 2. Power losses and thermal modeling 42 i. Modeling principle 42 ii. Needed parameters 45 iii. Example of the method for determining the formulas of switching and conduction currents 46 3. Semiconductors Database 48 i. Components’ families 50 ii. Generated components 50 iii. Comparison of real and generated components 53 4. Capacitor sizing 57 i. DC bus capacitor 57 ii. Flying capacitor 60 iii. Selecting the capacitor from the database 61 5. Model validation using Plecs 62 i. Multilevel Flying Capacitor topology (FC): 63 ii. 3-level Neutral clamped point topology (NPC): 64 iii. 5-level Active neutral clamped point topology (ANPC): 65 iv. Multilevel Stacked Multicell Converter topology (SMC): 65 6. Introduction of Multilevel Necessity 66 7. Conclusion 69 III. Comparison of possible solutions sized for the maximal power point ... 71 1. Comparison of topologies with PWM modulation strategy 72
ii. Studied topologies 74 iii. Comparison of studied topologies and DC bus voltage definition 80
2. Modulation strategies 87
i. Multilevel SPWM 89
ii. Discontinuous PWM (DPWM) 90
iii. Third Harmonic injection PWM (THIPWM ¼) 91
iv. Full-wave modulation 91
v. Comparison of modulation strategies 97 3. Comparison of component generations and technology with a chosen strategy
and topology 98
i. 7th generation IGBTs 98
ii. 6th generation IGBT vs 7th Generation IGBT (Mitsubishi) 99 iii. Silicon Carbide (SiC) vs Silicon (Si) components 101
4. Total weight repartition 102
i. 3D inverter design 103
ii. Specific power comparison 106
iii. Module packaging for bus bar reduction and capacitor weight reduction 107
5. Conclusion 109
IV. Performance of the chosen solutions during the mission profile ... 111
1. DC bus voltage sizing and components choice depending on the voltage mission profile and control strategy 112 2. Inverter performances during the mission profile 113 i. Strategy 1: Sine PWM and THIPWM 114 ii. Strategy 2: THIPWM versus DPWM 115 iii. Strategy 3: Full-wave modulation 117 iv. Strategy 4: hybrid modulation using Sine PWM and FW 119 v. Strategy 5: DPWMMAX and FW modulation 121 vi. Overview of control strategies 123 3. Conclusion 126 Conclusion & perspectives ... 127
Appendix ... 131
Résumé en français ... 139
List of figures
Fig. I-1. Global air travel 1936-2016 [2] ... 21
Fig. I-2. CO2 Emissions Trends from International Aviation, 2005 to 2050 ... 22
Fig. I-3. Airbus electro-mobility roadmap [24] [25] ... 24
Fig. I-4. Series hybrid propulsion system [27] ... 25
Fig. I-5. Parallel hybrid propulsion system [27] ... 26
Fig. I-6. General propulsion schematic system during a mission of an aircraft [28] ... 27
Fig. I-7. Baseline architecture for assessments ... 28
Fig. I-8. Voltage and current RMS mission profile ... 30
Fig. I-9. HASTECS consortium structure ... 31
Fig. I-10. Electrical PMSM model (single phase), Vector diagram of the PMSM for a maximum torque ... 32
Fig. I-11. Hybrid Electric propulsion system configuration ... 33
Fig. I-12. Inverter weight distribution for different used voltage rating components ... 36
Fig. II-1. Studied electric system ... 39
Fig. II-2. Software organization ... 40
Fig. II-3. Available component selection algorithm ... 41
Fig .II-4. IGBT current and voltage waveforms during switching and conduction and switching losses ... 43
Fig. II-5. IGBT and Diode equivalent electric circuit ... 43
Fig. II-6. 𝐸𝑜𝑛 datasheet parameters’ extraction (ABB’s 5SNA 1200E330100 IGBT) ... 44
Fig. II-7. Equivalent thermal model of an IGBT component with antiparallel diode [30] [32] ... 45
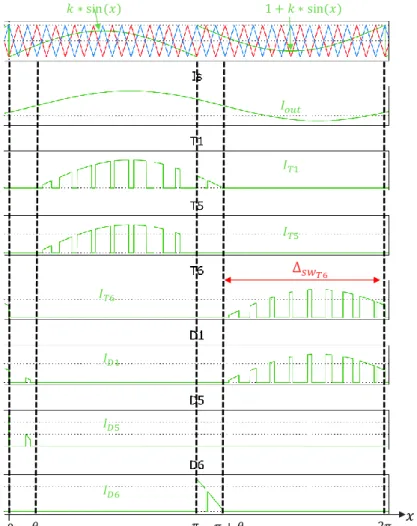
Fig. II-8. Output voltage & current waveforms of a single phase 5-level ANPC obtained by Plecs simulation ... 47
Fig. II-9. Waveforms of ANPC semiconductors commands and currents obtained by simulation in Plecs ... 47
Fig. II-11. Efficiency for several topologies using available database components ... 49
Fig. II-12. Voltage and current ratings of semiconductor devices in the database ... 50
Fig. II-13. Variation of Aon, Bon et Con versus voltage rating and Eon versus the current .... 52
Fig. II-14. Real versus generated components efficiencies, maximal junction temperatures and parallel and series associated switches number for fixed calibers ... 54
Fig. II-15. Real versus generated components efficiencies and maximal junction temperatures for fixed voltage calibers and adapted current calibers ... 55
Fig. II-16. Thermal resistance for real and generated used components ... 55
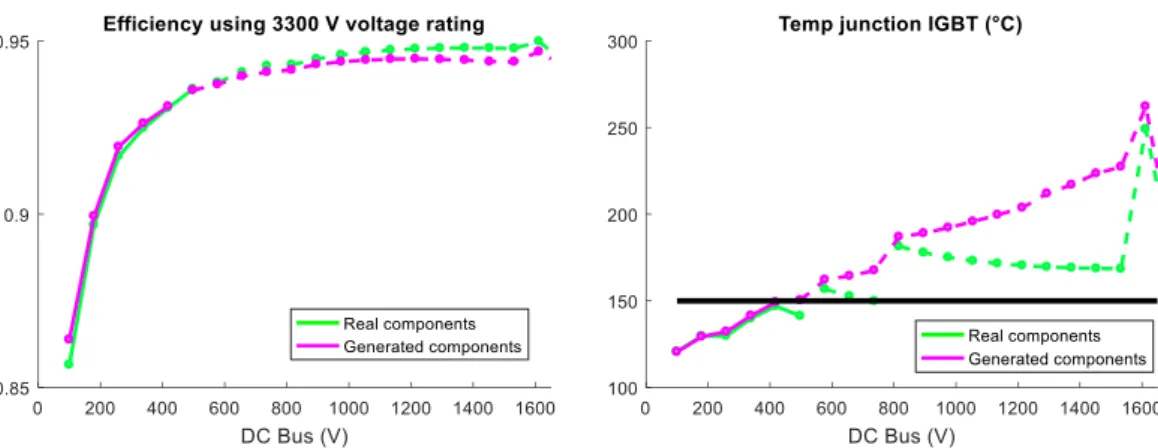
Fig. II-17. Efficiency and maximal junction temperature for real and generated 3300 V components for a power sweep ... 56
Fig. II-18. Real versus generated components efficiencies and used Silicon ratio for adapted voltage and current calibers ... 56
Fig. II-19. DC bus link types ... 58
Fig. II-20. Inverter input and output currents ... 59
Fig. II-21. Series and parallel capacitor association ... 62
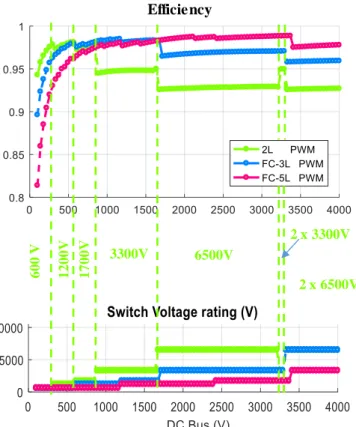
Fig. II-22. Efficiency for 2-level inverters with different voltage rating components for DC bus voltage sweep ... 67
Fig. II-23. Efficiency for 2-level inverters with different voltage rating components for DC bus voltage sweep with adapted switching frequency ... 67
Fig. II-24. DC bus optimal voltage value depending on components voltage rating and topologies level number ... 68
Fig. II-25. Number of topology level to use for 1.7 kV DC bus voltage ... 68
Fig. III-1. Specific power increasing study line ... 71
Fig. III-2 : Direct series component association ... 72
Fig. III-3 : Parallel component association ... 73
Fig. III-4 : Multilevel converter classification [41] ... 74
Fig. III-5. 2-level 3-phase inverter ... 75
Fig. III-6. 3-level FC inverter’s leg ... 76
Fig. III-8. 3-level single phase ANPC ... 78
Fig. III-9. 5-level ANPC single phase inverter ... 78
Fig. III-10. 5-level SMC 2x2 single phase inverter... 79
Fig. III-11. Generated components response for DC bus sweep for 2-, 3- an 5-level topologies ... 81
Fig. III-12. 2-,3- and 5-level topologies performances for a DC bus voltage sweep with adapted switching frequency ... 82
Fig. III-13. Specific power for studied topologies using generated components and adapted switching frequency ... 83
Fig. III-14. Weight distribution for studied topologies with generated components ... 84
Fig. III-15. Specific power for studied topologies using a switching frequency of 5.8 kHz using real components ... 85
Fig. III-16. Efficiencies of studied topologies for DC voltage and power parametric sweeps 86 Fig. III-17. Multilevel inverter modulation classification ... 87
Fig. III-18. Studied modulation strategies ... 88
Fig. III-19. Output desired voltage and current 3-level PWM waveforms ... 88
Fig. III-20. PWM triangular carrier and sine reference ... 90
Fig. III-21. DPWMMIN with phase opposition and DPWMMAX with phase disposition triangular carrier and sine reference ... 90
Fig. III-22. 3-level THIPWM1/4 modulation... 91
Fig. III-23. Switching cell combinations for 3-level NPC and output desired voltage waveform ... 92
Fig. III-24. T1 and T2 3-level NPC control signals ... 92
Fig. III-25. Switching cell command schematic ... 93
Fig. III-26. Full wave 1 used switches combination ... 93
Fig. III-27. 0 voltage level switches combination for full wave 2 ... 94
Fig. III-28. FW2 State machine ... 94
Fig. III-30. Switching at high frequency between the two possible configurations ... 95
Fig. III-31. Voltage and current waveforms for 3-level FC using full wave 3 for an apparent switching frequency of 60 kHz ... 96
Fig. III-32. Staircase or selective harmonic elimination modulation strategy ... 97
Fig. III-33. Losses repartition for 3-level FC ... 98
Fig. III-34. NX and std Mitsubishi modules Type packaging ... 99
Fig. III-35. Packaging structure (std Type) ... 99
Fig. III-36. 3D single phase 3-level FC inverter ... 103
Fig. III-37. CPLIP concept scheme [32] ... 104
Fig. III-38. Module/evaporator assembly ... 104
Fig. III-39. Bus bar configuration for a 3-level FC single phase ... 105
Fig. III-40. Bus bar leakage inductance ... 105
Fig. III-41. 3-level DPWMMAX FC (left) and 3-level DPWMMAX NPC (right) weight distribution ... 106
Fig. III-42. 3-level NPC weight distributions ... 107
Fig. III-43. 3-level NPC weight distributions with the new sized capacitor ... 107
Fig. III-44. Design of a 3-level ANPC inverter power module ... 108
Fig. III-45. Lower (left) and upper (right) power modules placed on the evaporator ... 108
Fig. III-46. 3-level 3-phase NPC inverter with new power modules ... 108
Fig. III-47. 3-level NPC weight distributions with the new sized capacitor and power modules ... 109
Fig. IV-1. Electrical power mission profile ... 111
Fig. IV-2. Needed machine voltage during the flight mission with the first e-motor winding configuration ... 112
Fig. IV-3. Needed machine voltage during the flight mission with the second e-motor winding configuration ... 112
Fig. IV-4. 3-level FC and NPC efficiencies using PWM strategies with both e-motor winding configurations ... 114
Fig. IV-5. 3-level NPC current repartition during Taxi out phase ... 115 Fig. IV-6. 3-level FC and NPC efficiencies using THIPWM and DPWMMAX strategies with both e-motor winding configurations ... 116 Fig. IV-7. 3-level FC and NPC efficiencies using DPWMMAX and DPWMMIN strategies for the 1st e-motor winding configuration ... 116 Fig. IV-8. 3-level FC and NPC efficiencies using FW strategy with the 1st motor winding configuration ... 117 Fig. IV-9. Current waveforms for Taxi out, take off, cruise and descent using the 1st motor winding configuration ... 118 Fig. IV-10. 3-level FC and NPC efficiencies using FW strategy with the 2nd motor configuration ... 119 Fig. IV-11. 3-level FC and NPC efficiencies using FW and PWM strategies with 1700 V IGBTs ... 120 Fig. IV-12. 3-level FC and NPC efficiencies using FW and PWM strategies with 1200 V IGBTs ... 120 Fig. IV-13. 3-level FC and NPC efficiencies using FW and PWM strategies with 1700 V IGBTs for the 2nd e-motor ... 121 Fig. IV-14. 3-level FC and NPC efficiencies using FW and DPWMMAX strategies with 1700 V IGBTs ... 122 Fig. IV-15. 3-level FC and NPC efficiencies using FW and DPWMMAX strategies with 1200 V IGBTs ... 122 Fig. IV-16. 3-level FC and NPC efficiencies using FW and DPWMMAX strategies with 1700 V IGBTs for the 2nd e-motor ... 123 Fig. IV-17. Output voltage for 3-level FC during the cruise using DPWMMAX and PWM 125 Fig. V-1. Power rating and converter architecture ... 129
List of tables
TABLE I-1. Hybrid-electric aircraft characteristics [8], [9],[10] ... 23
TABLE I-2. Full electric aircraft characteristics [8], [9],[10] ... 24
TABLE I-3. Advantages and disadvantages of series and parallel hybrid propulsion architectures ... 26
TABLE I-4. Electric components specific power state of the art and research targets [29] .... 29
TABLE I-5. Electric components HASTECS specific power targets ... 29
TABLE I-6. HASTECS inverter efficiency targets ... 30
TABLE I-7. Used specification ... 35
TABLE I-8. 2-level inverter performances ... 35
TABLE II-1. Current distribution during an operating period ... 48
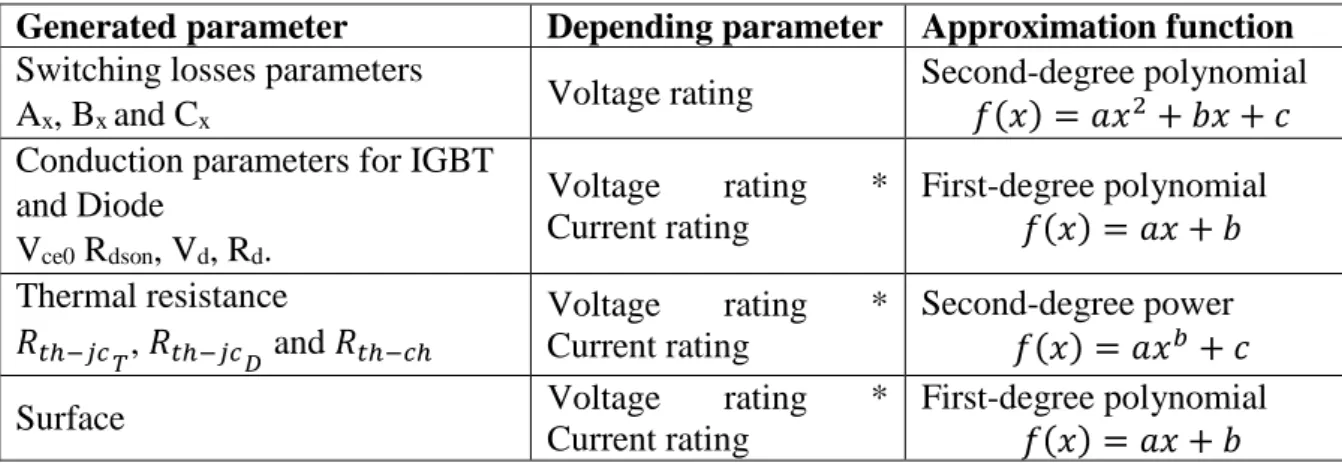
TABLE II-2. Needed parameters dependency ... 51
TABLE II-3. Summary of generated parameters ... 52
TABLE II-4. Inverter and capacitor currents calculation comparison ... 60
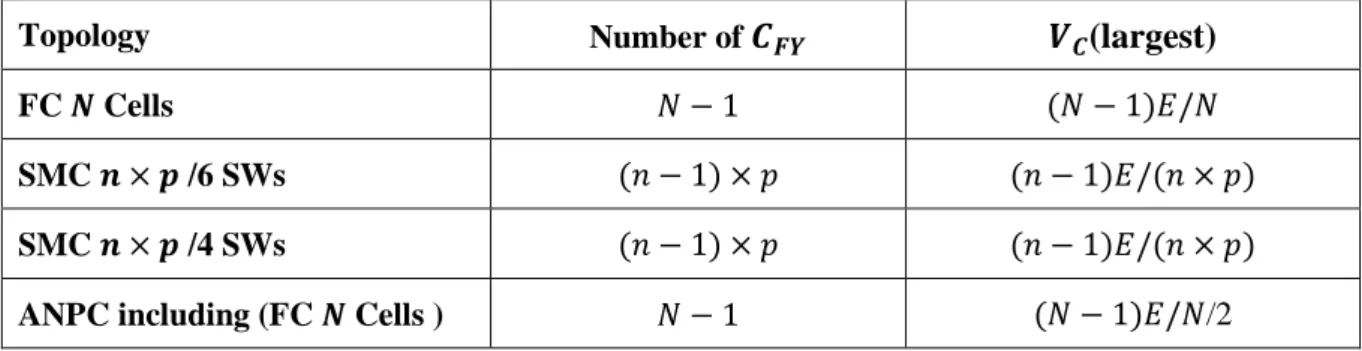
TABLE II-5. Summary of flying capacitor number and voltage value ... 61
TABLE II-6. 2-level power losses comparison using analytic analysis (Matlab) and Plecs simulation ... 63
TABLE II-7. 3-level FC power losses comparison using analytic analysis (Matlab) and Plecs simulation ... 63
TABLE II-8. 5-level FC power losses comparison using analytic analysis (Matlab) and Plecs simulation ... 64
TABLE II-9. 7-level FC power losses comparison using analytic analysis (Matlab) and Plecs simulation ... 64
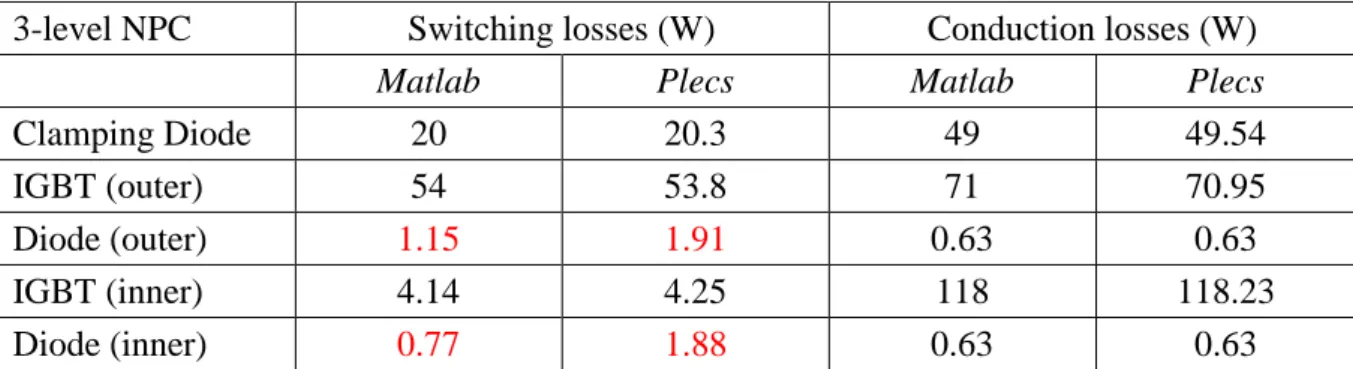
TABLE II-10. 3-level NPC power losses comparison using analytic analysis (Matlab) and Plecs simulation ... 64
TABLE II-11. 3-level NPC outer diode switching losses ... 65
TABLE II-12. 5-level ANPC power losses comparison using analytic analysis (Matlab) and Plecs simulation ... 65
TABLE II-13. 3-level SMC power losses comparison using analytic analysis (Matlab) and
Plecs simulation ... 66
TABLE II-14. 5-level SMC power losses comparison using analytic analysis (Matlab) and Plecs simulation ... 66
Table III-1. Summary of topology properties ... 79
TABLE III-2. Maximal power density for 2-level, 3-level FC, 5-level FC and 5-level ANPC with generated components ... 83
TABLE III-3. Maximal power density for 2-level, 3-level FC, 5-level FC and 5-level ANPC with real components with adapted switching frequency ... 85
TABLE III-4. Maximal output voltage magnitude as function of DC bus voltage and modulation strategy ... 89
TABLE III-5. 3-level FC performances for different modulation strategies ... 97
TABLE III-6. 6th vs 7th generation std type module characteristics ... 100
TABLE III-7. 6th vs 7th generation 1700 V/ 600 A IGBTs ... 100
TABLE III-8. 6th vs 7th generation 1200V IGBTs ... 101
TABLE III-9. 7th generation 1200V vs 1700V IGBTs ... 101
TABLE III-10. 6th and 7th generation 1200V/600A IGBTs vs 1200V/600A SiC module ... 102
TABLE III-11. Efficiencies for the two studied topologies and modulation strategies ... 102
TABLE III-12 Specific power the two studied topologies using DPWMMAX modulation strategy ... 106
TABLE IV-1. Maximal output voltage as function of DC bus voltage and control strategy 113 TABLE IV-2. DC bus voltage value for the different studied modulation strategies and electric motor winding configurations ... 113
TABLE IV-3. THD for some mission profile points for the 3-level FC using DPWMMAX modulation for the 1st e-motor winding configuration ... 117
TABLE IV-4. THD and harmonics amplitudes for some mission profile points for the 3-level FC using full wave modulation ... 118
TABLE IV-5. THD and harmonics amplitudes for some mission profile points for the 3-level FC using full wave modulation with the 2nd motor configuration ... 119
TABLE IV-6. THD and harmonics amplitudes for some mission profile points for the 3-level FC using full wave and PWM modulation for the 2nd e-motor configuration ... 121
TABLE IV-7. Efficiencies for different mission profile points for the NPC topology 1st e-motor
... 123
TABLE IV-8. Efficiencies for different mission profile points for the NPC topology 2nd e-motor ... 124
TABLE IV-9. Efficiencies for different mission profile points for the FC topology 1st e-motor ... 124
TABLE IV-10. Efficiencies for different mission profile points for the FC topology 2nd e-motor ... 124
TABLE IV-11. Target and achieved efficiencies during takeoff and cruise... 125
TABLE. VI-1. Conduction Mode average and RMS current ... 131
TABLE. VI-2. Switching Mode average current formulas ... 132
TABLE. VI-3. Conduction Mode average and RMS current ... 132
TABLE. VI-4. Switching Mode average current formulas ... 133
TABLE. VI-5. Conduction Mode average and RMS current ... 134
TABLE. VI-6. Switching Mode average current formulas ... 134
TABLE. VI-7. Conduction Mode average current formulas ... 135
TABLE. VI-8. Conduction Mode RMS current formulas ... 136
TABLE. VI-9. Switching Mode average current formulas ... 136
List of acronyms
ANPC: Active Neutral Clamped Point topology Avg: average
Cond: conduction
DPWM: Discontinuous Pulse Width Modulation EMF: electromotive force
FC: Flying capacitor topology FW: Full Wave modulation GT: Gas turbines
HASTECS: Hybrid Aircraft reSearch on Thermal and Electric Components & Systems MTOW: Maximum Take-Off Weight
NPC: Neutral Clamped Point topology
PMSM: Permanent Magnet Synchronous Motor PWM: Pulse Width Modulation
RMS: Root Mean Square
SMC: Stacked Multicell Converter topology SW: switching
THD: Total Harmonic Distortion
THIPWM: Third Harmonic Injection Pulse Width Modulation WP: work package
19
General introduction
The environmental and ecological footprint of transport systems, particularly aircraft, has been increasing steadily in recent years. Current environmental considerations are, therefore, pushing to reduce their ecological impact. Projects such as the Clean Sky 2 project offer an answer to this problem, by proposing a reduction in CO2 emissions and noise pollution. The development
of a hybrid-electric propulsion aircraft would reduce these emissions by reducing the size and mass of systems and using more efficient electrical systems. This would reduce fuel consumption and thus pollutant emissions. It would also improve system reliability and reduce design and operating costs.
This work takes part in HASTECS Clean Sky 2 European project, which studies the possibility of series electric propulsion hybridization in an aircraft, and aimed to develop a simulation tool to pre-size inverters meant to drive hybrid-electric propulsion aircraft’s motor. To do so, power electronics topologies, smart control and modulation strategies and also semiconductor technologies were taken into account.
To increase the specific power, the cooling system mass should be decreased either by optimizing its components which is done by the 4th work package or by reducing power losses. Inverter losses reduction could be achieved by using small voltage rating components, by playing on modulation strategies or by using more performant semiconductors.
The first chapter presents the main problem related to current aviation and the opportunities that hybrid-electric propulsion aircraft offers. Hybrid-electric propulsion aircraft principle and necessity will be shown due to the evolution of the commercial aircraft industry and environmental needs in addition to the Clean Sky 2 European project HASTECS goals. The problematic and objectives of this work will be presented in this chapter as well as the used load model.
In chapter II, the software organization and used power losses and thermal models will be presented. The used semiconductor database will also be discussed. This work aims to develop a simulation tool which allows to pre-size converters. It computes different results for different conversion architectures. Its entries are the design constraints, the foreseen converter topologies, and the semiconductor family or manufacturer choice from the available components database. The results such as the efficiency, number of semiconductor devices, maximal junction temperature, switching and apparent frequencies, total losses, and semiconductors, heat exchanger, DC bus capacitor and flying capacitor weights, and also the power density are shown as figures for different parameters of different architectures behaviors.
The studied inverter topologies and modulation strategies will be presented in chapter III. Then the performances will be compared using several semiconductors to choose the most performant solution in terms of efficiency and specific power. The main factor to increase the specific power that was identified in the first chapter is decreasing the cooling system mass,
20
optimizing its components which is a part of WP4 work or by reducing power losses. Inverter power losses reduction could be achieved either by using small components or by playing on modulation strategies or by using more performant semiconductors.
The main objective of chapter IV is to evaluate several power converter architectures and associated modulation strategies to power the electric machine used for the aircraft propulsion. A comparative study of modulation strategies was carried out to highlight the structure and modulation presenting the best performance to minimize the losses for the sizing point using 3-level topologies using two electrical motor windings configurations; 2 and 3 conductors per slot.
21
I. State of the art and context
Aviation undoubtedly brings economic and social benefits to society. However, related activities also contribute to climate change, environmental degradation, noise, and local air pollution. The aviation industry contributes about 2 % of the world's global carbon dioxide (CO2) emissions [1], and this is set to rise so it is under pressure to reduce these emissions, even
if air travel continues to gain popularity around the world as shown in Fig. I-1. To reduce the impact of air transport, new technologies are being studied. One solution could be to transpose the hybrid propulsion developed for land vehicles using batteries or fuel cells as an additional energy source to reduce fuel.
Fig. I-1. Global air travel 1936-2016 [2]
This chapter will present the main problem related to current aviation and the opportunities that hybrid-electric propulsion aircraft offers. To do so, the hybrid-electric propulsion aircraft principle and necessity will be shown due to the evolution of the commercial aircraft industry and environmental needs. These needs were set as the Clean Sky 2 European project HASTECS goals. This work takes part into this project [3] which aims to optimize the complete electrical chain of the hybrid aircraft integrating all aeronautical constraints such as partial discharges for electrical equipment placed in the non-pressurized zone or, in case of high operating voltage, even in the pressurized area. The problematic and objectives of this work will be presented in this chapter as well as the used motor model. To choose an adapted inverter topology, a regular 2-level inverter with a regular PWM was sized for the maximal power point to get a reference in terms of efficiency and specific power using a simple solution which will help to identify the areas to be worked on to reach the targets.
1. Hybrid-electric propulsion aircraft
Each year, about 37 million commercial aircraft carry 4 billion passengers[4], connecting 20,000 city pairs. Commercial aircraft now consume more than 270 million tons of jet fuel per year and thus produce more and more CO2 emissions [5] as shown in Fig. I-2. Therefore, any
22
and effective at this scale. A clean sky is the objective of recent developments and research carried out by all aircraft manufacturers.
Fig. I-2. CO2 Emissions Trends from International Aviation, 2005 to 2050
CO2 emissions from a commercial aircraft can be reduced by reducing the energy required to
fly the aircraft by reducing its weight or by improving the propulsion system efficiency or by reducing the amount of drag. This must include total life-cycle carbon emissions during fuel production. For electrical aircraft, this also would include carbon emissions generated by the power source, either on the ground for battery-powered aircraft or onboard electric aircraft equipped with a generator.
The desired overall objective of hybrid and fully electric transport vehicles/aircraft is to limit/cancel the CO2 emissions caused by internal combustion engines to drive the propeller of
the system. Weight may not be a desired optimized parameter in the terrestrial vehicle system, but on the other hand, for space vehicles, it is a highly recommended optimized parameter, because less mass means fewer energy requirements.
Electric propulsion has the potential to revolutionize flight: from cleaner and quieter travel to completely new vehicles, the benefits could be enormous. Faced with estimations that air traffic will double every 15 to 20 years, Airbus believes that electric and hybrid propulsion can offer a viable solution that allows their industry to grow sustainably while reducing its impact on the environment [6]. The international organization ATAG (Air Transport Action Group) in the aviation sector set objectives to have a cleaner sky. It wants to reduce fuel consumption by an average of 1.5 % per year from 2009 to 2020, and to cap CO2 emissions with carbon-neutral
growth from 2020 onwards, as well as to reduce net CO2 emissions from aviation activities by
half by 2050.
23 These objectives cannot be achieved with current technologies. That is why several projects on research and development of electric and hybrid-electric propulsion technologies are held. In addition to the obvious benefits of reducing CO2 emissions and noise levels, electrification also
makes it possible to completely re-evaluate the design of an aviation vehicle. Different range of vehicles will take advantage of the electrification. One of them concerns the low-capacity and limited-range urban air mobility demonstrators which are developed by Airbus: Vahana and CityAirbus, for intra-urban flights. These are all-electric air vehicles with a capacity of one to four passengers. In the longer term, Airbus believes that hybrid-electric propulsion will probably be installed on larger civil aircraft before becoming fully electric, as the power-to-weight ratios of battery technology are still far from being sufficient [7].
i. Hybrid and electric propulsion aircraft evolution
TABLE I-1 and TABLE I-2 summarize characteristics of some hybrid and electric propulsion aircraft that could be found in the literature.
This table shows a wide range of electric and hybrid propulsion aircrafts. There are mostly small power range aircraft. The small general aviation aircraft using the electric and hybrid propulsion systems are already flying. Indeed, small aircraft can be useful for testing in-flight new technologies. However, not all technologies suitable for general aviation aircraft are scalable to the large dimensions, long flight distances and high operational rates that are key characteristics of large commercial aircrafts.
The Boeing Sugar Volt has the closest power range to our studied case. However, the battery specific energy target reported by Boeing seems high compared to the other ones.
TABLE I-1. Hybrid-electric aircraft characteristics [8], [9],[10]
Name Architecture Max
power (kW) Maximum Take-Off Weight (kg) Battery energy (Wh/kg) Year
Boeing Sugar Volt [11],
[12] Parallel hybrid 1300-5300 70k-85k 750 2008
ENFICA – FC [13] Series hybrid 40 550 100 2010
Siemens/Diamond
E-Star [14] Series hybrid 70 800 - 2011
Embry-Riddle
Eco-Eagle Parallel hybrid 105 1075 125 2011
Siemens/Diamond
E-Star 2 Series hybrid 80 800 - 2013
Hypstair [15] Series hybrid 200 - - 2014
Cambridge SOUL[16],
[17] Parallel hybrid 20 235 144 2014
24 TABLE I-2. Full electric aircraft characteristics [8], [9],[10]
Name Maximum power (kW) MTOW (kg) Battery energy (Wh/kg) Year Lange Antares [18] 42 660 136 2003 Fishman Electraflyer C [19] 13.5 283 - 2008 Yuneec E430 [20] 40 470 154 2009
Pipistrel Taurus Electro G2 [20] 40 450 - 2011
Pipistrel Taurus Electro G4 [21] 150 1500 180 2011
FB Stuttgart eGenius [21] 60 950 204 2011
Chip Yates Long ESA 192 680 - 2012
Airbus E-Fan 60 600 207 2014
Nasa X-57 Maxwell [12], [22] 132 1360 - 2014
Pipistrel Alpha Electro 60 550 171 2015
Siemens Extra 300 (330LE) [23] 260 1000 - 2016
Unlike Boeing who developed its hybrid-electric propulsion aircraft in 2008, Airbus began its journey to electric flight later. Fig. I-3 presents Airbus electro-mobility roadmap starting from 2010. As noticed in Fig. I-3, in only 10 years, the needed power is 100 times higher than for the single-seat Cri-Cri that was designed to fly 30 minutes. There is a multitude of challenges that must be researched and mastered to design the new single-aisle aircraft requiring 20 MW.
Fig. I-3. Airbus electro-mobility roadmap [24] [25]
The E-Fan family of aircraft allowed Airbus to learn many lessons from the hundreds of flights performed. In November 2017, Airbus launched the E-Fan X with its partners Siemens and Rolls-Royce which aims to replace only one propeller of the four by a hybrid-electric one. In June 2019, Rolls-Royce took over Siemens' e-Aircraft division, so Siemens is no longer involved in this project. This partnership aims to accelerate and take the technological maturity and performance of hybrid-electric propulsion to a new level. The E-Fan X is an ambitious technology demonstrator project that will be a decisive step towards the manufacture of a hybrid
25 electric civil aircraft on the scale of today's single-aisle aircraft. The consortium will use a BAe146 as a flight test platform for a hybrid serial architecture by 2020, consisting of a 2 MW electric motor, a gas turbine with integrated 2 MW generator and a 2 MW battery controlled by a control unit called "e-supervisor". E-fan X has the same power range as the one studied in our project presented later in this chapter.
ii. Hybrid-electric architectures
Recently, the idea to use hybrid architecture in aircraft propulsion has expanded. This idea is similar to what can be found in Hybrid Electrical Vehicles (HEV). Three different hybrid architectures exist: Series, Parallel and Series/Parallel systems, presented below. Each type of them has its benefits and criteria that differ from the others [26]. However, all three types share the idea of using a storage system that separates the thermal engine operating point (Gas Turbine, Electrical Generator or Auxiliary Power Unit (APU)) from the propulsion, thereby optimizing the efficiency of the thermal engine.
Series Hybrid Propulsion:
In the series hybrid-electric architecture, the Gas turbines (GT) or the engine as in Fig. I-4 runs at constant RPM and drives a mechanically-coupled electrical generator that produces electric power. This power is then delivered to the system where it is combined with the electric power coming from the auxiliary power sources. To supply the AC electric motor, the DC power supply from the batteries and/or generator must be converted to AC power, which is done by power converters so that it can finally operate the electric motor that drives the propeller.
Fig. I-4. Series hybrid propulsion system [27]
Parallel Hybrid Propulsion:
The parallel hybrid-electrical architecture (Fig. I-5) is more complex than that of the series. Indeed, to be able to have the propeller-driven simultaneously by the GT and the electric motor, a complex gearbox is required. Besides, the GT does not always operate at its maximum efficiency point but rather is required to operate at a wide range of speeds, which generally makes it less efficient. Conversely, the parallel architecture has the advantage that the electric motor can be less powerful and therefore smaller and lighter than in series architecture since it does not have to provide the maximum power required for the propeller alone. Since it is not necessary to convert the GT mechanical power into electrical power, the electrical generator is not present, but the advantages of getting rid of it are reduced by the need for the complex
26
mechanical transmission and gearbox part used to distribute the mechanical power between the electric motor, the GT and the propeller.
Fig. I-5. Parallel hybrid propulsion system [27]
Combined Hybrid, mixed or association of Parallel/Series Hybrid Propulsion:
This architecture merges the two series and parallel types. The main advantages of this architecture are that it allows a smaller gas turbine to operate optimally and directly during the cruise mission phase, and also to charge the batteries, a possibility that traditional parallel architectures do not allow. This powertrain architecture is widely used in the automotive industry.
TABLE I-3 sums up the advantages and disadvantages of both series and parallel hybrid architectures. The series-parallel configuration benefits from most of the advantages of both configurations. The engine propulsion power is divided into two power-flows, which are transmitted to the propeller over a mechanical and an electrical branch. However, this configuration is more complex to design and control.
TABLE I-3. Advantages and disadvantages of series and parallel hybrid propulsion architectures
Architecture Series Parallel
Pros E-motor configuration is
relatively simple to control Engine able to operate at its
maximum efficiency point Gas turbine is more efficient
at low speed and high load
A small engine and motor help reduce vehicle mass Performs well in high average
power and high load conditions
higher transmission efficiency due to the mechanical connection
Cons Low transmission efficiency complex mechanical transmission
The design and control is relatively more complex than the series configuration
27
iii. Energy management for the studied solution
Only the series propulsive system is taken into account in the scope of this study.
The general schematic of the system during different phases of a mission is shown in Fig. I-6. In the meantime, our study considers only the power conversion for motor driving. There are two main phases in this mission profile; the takeoff which represents the maximal power point and the cruise which is the longest phase of the flight mission. Taxi out and in and descent could be powered using full electric energy given by auxiliary electric source either the batteries or the fuel cell. During these sequences, the power demand is low and the turboshafts could be relieved by electric power sources which are more efficient. This scenario corresponds to a light hybridization. The gas turbine could be sized for the cruise power point and auxiliary electric source could be used to help the gas turbine to supply the needed electric power for the takeoff.
This study does not cover hybridization and energy generation but focuses mainly on the inverter that feeds the electric motor connected to the propeller.
Fig. I-6. General propulsion schematic system during a mission of an aircraft [28]
2. Problematic and objectives
i. HASTECS project
The overall objective of the HASTECS (Hybrid Aircraft: Academic research on thermal & Electric Components & Systems) project is to support a hybrid-electric demonstration by developing models and tools that can help designers evaluate the main benefits of architectures and energy management. The assessments will be integrated at system level and will include the design and analysis of the main components of the hybrid energy chain: electrical machines and their cooling, cables, power electronics and associated thermal management taking into
Architecture during taxi, descent (GT off)
Architecture during takeoff, climb (GT and auxiliary power on)
Architecture during cruise (auxiliary power off)
28
account the main environmental constraints, including partial discharges due to the new high power and ultra-high voltage standards.
To this end, the various working groups will try to optimize the performance of electrical and thermal components in terms of specific power (kW/kg) or specific energy for batteries or fuel cells. The energy efficiency of the components and the entire system with its energy management is a second major objective. The performance evaluation will be based on the "basic architecture" presented in Fig. I-7 and extrapolations will, of course, be made to generalize our results to other architectures and other power levels.
Fig. I-7. Baseline architecture for assessments
The " brakes on innovation " and the subsequent physical limitations that would make it difficult to achieve performance objectives will be identified, and a sensitivity analysis will be carried out to select the most significant impact on technologies and components taking into account the environmental constraints. These constraints are mainly partial discharges and thermal cooling systems and they depend on environmental conditions (external temperature, pressure, humidity, air velocity) in the nacelle as well as in the fuselage.
ii. Hybrid-electric components specific power targets
The power chain needs careful design to minimize the weight of the whole system. This last element is directly linked to the weight of the converter but also the losses through the weight
29 of the heat exchanger. To obtain an aircraft with a propulsive system weight similar to the current one, some research projects have set targets in terms of specific power for the different components of the power chain as reported in TABLE I-4. Based on this specific power values, our project sets its targets that will be detailed in the project presentation.
TABLE I-4. Electric components specific power state of the art and research targets [29]
Motor & Generator Power Electronics Battery Power (MW) Specific Power (kW/kg) Power (MW) Specific Power (kW/kg) Specific Energy (Wh/kg) Current state of the art (2016)
Non cryogenic Cryogenic 0.25 1.5 2.2 0.2 0.25 2.2 200-250 Research goals (2016) NASA 10-year goals NASA 15-year goals
US Air Force 20-year goals Ohio State University 5-year goals 1-3 5-10 1 2 13 16 5 15 1-3 5-10 1 2 15 19 5 23 400-600
However, this project sets two main objectives in terms of specific power. The first is the "medium-term objective of 2025" which corresponds to 15 kW/kg for power electronics including their cooling system and 5 kW/kg for electrical machines including cooling. The second is the "2035 long-term objective" which corresponds to 25 kW/kg for the power electronics and 10 kW/kg for electrical machines including their cooling systems (TABLE I-5).
TABLE I-5. Electric components HASTECS specific power targets Electric motor Specific Power (kW/kg) Inverter Specific Power (kW/kg) HASTECS targets (2016) 2025 2035 5 10 15 25
Achieving these objectives would have major positive consequences for the environment, with a constant reduction in fuel consumption in flight and a reduction in ground noise thanks to entirely electric taxiing.
iii. Flight mission profile
The flight mission profile, in terms of electric motor voltage and current, considered in the project is shown in Fig. I-8. The maximum power is in the range of MW and due to confidentiality issues, the value of the maximum power cannot be given: all power values will be given in per unit.
30 Fig. I-8. Voltage and current RMS mission profile
Two targets in term of efficiency for the power electronics were set by HASTECS project. For the 2025 target, the efficiency should be higher than 98 % for the cruise point and higher than 96.5 % for the maximal power point. On the other hand, for the 2035 target, the efficiency should be higher than 99.5 % for the cruise point and higher than 99 % for the maximal power point (TABLE I-6).
TABLE I-6. HASTECS inverter efficiency targets Take-off Efficiency (%) Cruise Efficiency (%) HASTECS targets (2016) 2025 2035 96.5 99 98 99.5
iv. HASTECS work packages
To achieve these objectives, the INPT has assembled a consortium of 3 research laboratories with experience in the preliminary design of electrical and thermal components and architectures for aerospace applications:
• Laboratory on Plasma and Energy Conversion (LAPLACE), Toulouse (FR)
• Research and Engineering Institute for Transport and Environment (P’), Poitiers (FR)
• Inter-university Material Research and Engineering Centre (CIRIMAT), Toulouse (FR)
To achieve these general objectives, the HASTECS project has identified six technical work packages derived from the baseline architecture (Fig. I-9). It started in September 2016 and will last for 5 years and it includes 6 Ph.D. thesis and 2 post-doctoral positions. Each work package objectives are detailed below.
Take-off Cruise T ax i in T ax i o u t
Approach & Landing
D es c en t C lim b
31
Fig. I-9. HASTECS consortium structure
WP 1: develop a target-setting tool to help evaluate the design of electric machines for hybrid-electric propulsion. The main objective is to analyze the phenomena that limit the specific power of electrical machines and to propose technological and structural innovations (geometry);
WP 2: develop sizing trends of static converters for a hybrid-electric propulsion system. Define two or three levels of DC bus standards for which every component will be designed; the first at a “moderated voltage” (~700 V); the second (and potentially third) at few kV (<7 kV); and develop a design tool for the estimation of power electronics performances;
WP 3: propose and analyze original machine cooling solutions;
WP 4: provide cooling and heat exchanger system solutions for power electronic converters;
WP 5: take into account the partial discharges phenomenon and assess impacts in the design of the power electronics and electric machines of the Hybrid Electric Propulsion System;
WP 6: develop simplified models for the most promising technologies of auxiliary sources (Lithium-Ion batteries, fuel cells) for 2035; and integrate technological bricks (machines, power electronics, cables, storage components, cooling system) and new concepts proposed in other WPs, then optimize the overall hybrid chain integrating its power management strategy.
For example, for our work package (WP2) strong links with the other WPs (Fig. I-9) exist, detailed below for each one.
WP6 System Integration LAPLACE / GENESYS - PhD WP1 Machine design LAPLACE / GREM3 - PhD WP3 Machine cooling P’ Poitiers - PhD WP5 Machine Partial discharges LAPLACE / MDCE-GREM3 - PhD WP5 Bus bars & cables Partial discharges LAPLACE / MDCE post-doc WP6 Auxiliary sources LAPLACE / GENESYS CIRIMAT Post-doc Power WP4 Electronics cooling P’ Poitiers - PhD WP2 Power Electronics LAPLACE / CS-GENESYS - PhD Main Interactions
32
- WP4: converter losses and components heat fluxes in W/cm2 will impact heat exchanger system sizing and the transient capacity of this latter will influence converter sizing point.
- WP5: the voltage variation generated by the change of switch state, both in static and dynamic, will represent the stress of bus bars, cables and motor windings leading to possible partial discharges.
- WP6: to optimize the whole architecture, the WP2 needs to develop equations and models representing the trends studied in the “system integration” task.
WP1: To design the power electronics converter, a machine model is needed. Moreover, the switching frequency has a great impact on motor losses and current waveform.
Many possible electrical motors can be used in the scope of aircraft propulsion system design. Recent applications in the transportation domains are mostly using Permanent Magnet Synchronous Motor (PMSM) due to many specifications mainly high power density. This work does not highlight the mechanical solution of the system design since this part is a main study of WP1.
The simplified electrical model of a PMSM consists of the synchronous inductor with a resistor and the electromotive force (EMF) in series which is presented in Fig. I-10. The iron losses are not represented but have been taken into account in the sizing by WP1. The choice here is to maximize the torque, so the current is in phase with the EMF (non-salient pole rotor). This results in the vector diagram of Fig. I-10. The current is not in phase with the output voltage, leading to a power factor not equal to one and an oversizing of the inverter. Equations (I-1) and (I-2) can be determined.
Fig. I-10. Electrical PMSM model (single phase), Vector diagram of the PMSM for a maximum torque
𝑉𝑠 = 𝑅 ∗ 𝐼𝑠+ 𝑗𝐿 𝜔 𝐼𝑠+ 𝑒𝑚𝑓 (I-1)
𝑒𝑚𝑓(𝑡) = Φ𝑛𝑜_𝑙𝑜𝑎𝑑∗ 𝜔 ∗ sin (𝜔𝑡) (I-2)
So the given parameters from WP1 are 𝑅 and 𝐿 the stator resistance and inductance and Φ𝑛𝑜_𝑙𝑜𝑎𝑑 the no-load flux and the electric pulsation or the frequency.
𝑉𝑠
𝑗 𝜔 ∗ 𝐿 ∗ 𝐼𝑠
𝑒𝑚𝑓
33
v. Work Package 2 (WP2)
The work package focuses only on the inverter used to power the electric motor that drives the propeller.
WP2's goal is to develop a software tool that determines the best static converter architectures for hybrid-electric propulsion shown in Fig. I-11, taking into account both environmental and cooling constraints. The tool must evaluate the efficiency of the chosen solution, its weight and other factors for the medium term (2025) or the future (2035). In order to facilitate the integration tasks of the WP6 system, an output model representing the design trends will be provided to process them in an optimization cycle. The proposed study will be based in particular on the post-doctoral study "High power conversion chain for aircraft hybrid propulsion" carried out by Mohammad IBRAHIM [28] in cooperation with Airbus FPO.
Fig. I-11. Hybrid Electric propulsion system configuration
Even if the system is inside the fuselage (i.e. in a pressurized area), the cruise cabin altitude is higher than the limit given by manufacturers of the high-power modules for ground equipment. Besides, the ability to extract heat losses from the converter is a huge problem: for example, a 1 MW converter with 95 % efficiency will have 50 kW of losses!
Compared to the static converters used today in aeronautical electrical networks, the nominal power of the converters will increase significantly (more than 1 MW). Therefore, the bus voltage value must also increase above 700 V, which will be critical in the event of partial discharge.
The variation of the operating point during flight sequences as shown in Fig. I-8 represents a serious issue that should be investigated. Maximum power is only required during the "take-off" and "climb". The cruise power requirement is lower (half the maximum power) and represents more than half the duration of the mission. Thus, if the converter is sized for maximum power, it will be mainly used at operating points where its efficiency is not optimized. This is a major difference compared to the electric propulsion of land vehicles. The
Focus of WP2 study
34
study will, therefore, attempt to optimize the choice of converter sizing points to be able to accept peak consumption while having the highest efficiency throughout the mission (especially during the cruise).
If the sizing power of the converter is close to the take-off power, solutions to increase the efficiency of the converter when it is used at low power can be studied: for example, the number of converter legs or switches in parallel can be changed according to the desired power (because the power is directly linked to the current, the speed of the machine being close to constant). Of course, such a solution will lead to a heavier sizing, only used at its nominal capacity during a short period (take-off). Another possibility is to use two or more converters. In the case of two converters, both are operated during take-off. Then, only one is connected to the motor, the other one being used for other non-propulsive functions.
Several converter architectures will be evaluated according to the value of the DC bus and the sizing power, through different criteria (weight, losses, output frequency, passive components weight, etc.), using today silicon components as IGBTs, which are the most suitable for the needed power, voltage and frequency ranges, with the first target around 2025. But since the project is designing the aircraft of the future (long term target for 2035), a sizing with silicon carbide components (SiC) or other new technologies will also be made.
To study all aspects and to achieve these objectives, WP2 was composed of two successive tasks. The first one deals with the study and design of a unique power converter for the whole power needed by the application. It will take into account the possible value for the DC Bus and different architectures of the power converter based on silicon power devices. The second one was devoted to the study of power converter architectures using components based on new generations and technologies and several control strategies. Moreover, in this study, the filters are not considered since network quality constraints are not taken into account as well as their potential impact on the mass of the system.
3. Reference case: 2-level PWM inverter solution
To choose an adapted inverter topology, a regular 2-level inverter with a sine PWM was sized for the maximal power point to get an idea about what could be achieved in terms of specific power using a simple solution.
For this study case, the DC voltage (𝑉𝐷𝐶𝐵𝑢𝑠) is chosen to deliver the needed maximal voltage
of the electric machine (𝑉𝑜𝑢𝑡𝑚𝑎𝑥) as in TABLE I-7. The inverter is sized for the maximal power point with a 2 kV DC bus and a switching frequency of 5.8 kHz which represents approximately 11 times the PMSM nominal frequency parameter given by WP1. To estimate the inverter specific power including the heat exchanger, a 0.34 kW/kg coefficient is taken into account which translates the power losses directly into cooling system weight. This value is used as a base value issued from the specification dossier. The passive components weight, capacitors, in this case, are also taken into account.
35
TABLE I-7. Used specification Fundamental frequency (Hz) 532.3
𝑽𝒐𝒖𝒕𝒎𝒂𝒙 (V) 857.3
𝑰𝒐𝒖𝒕𝑹𝑴𝑺 (A) 1054
Modulation index 0.86
Power factor 0.78
To withstand the current imposed by the machine, semiconductors are put in parallel if the needed current rating exceeds the maximally available one. On the other hand, to withstand the voltage depending on the voltage using rate (𝐾𝑣), components may be associated in series (𝑛𝑠𝑒𝑟𝑖𝑒𝑠). The components are used up to 100 % of their current rating.
𝑛𝑠𝑒𝑟𝑖𝑒𝑠= 2∗𝐾𝑣
𝑉𝑟𝑎𝑡𝑖𝑛𝑔∗ 𝑉𝐷𝐶𝐵𝑢𝑠 (I-3)
If the direct series association is not allowed and the components should be used up to 50 % of their nominal voltage, only one component rating could be used which is 6500 V. However, these components are not adapted to the used high switching frequency. If the second largest voltage rating components (3300 V) are to be used, they should be used up to 61 % of their rating in order to use only one component in series.
The first study case uses two 3300 V / 800 A Infineon components associated in parallel to withstand the current and are used at 61 % of their voltage caliber. The second one uses two 1700 V / 600 A Infineon components associated in parallel and two components in series used at 59% of their voltage caliber even if the direct series association is hard to realize. For the third case, two 1200 V / 600 A Infineon components are associated in parallel and three components in series used at 56 % of their voltage caliber. TABLE I-8 sums the main inverter performances for these three study cases.
TABLE I-8. 2-level inverter performances Components voltage ratings 3300 V 1700 V 1200 V 𝜼(%) 92.55 98 98.54 Junction temperature (°C) 244 307 98 Specific Power (kW/kg) 3.39 8.86 9.23
Series and parallel associations (per switch) Total number of semiconductors (per phase) 4 8 12
36
For the 3.3 kV components, the obtained efficiency is very low so as the specific power compared to smaller components. The maximal junction temperature exceeds the limit of 150 °C for the 3.3 kV and 1.7 kV components. If the efficiency is higher so the cooling system mass is lower, which leads to a higher specific power. But these results are still far from the targets. To have an acceptable solution using the 3.3 kV components, the switching frequency should be reduced to 2 kHz (3.8 × 532 𝐻𝑧) whereas for the 1.7 kV ones it is not possible even if the switching frequency is equal to the machine fundamental frequency (532 Hz).
Fig. I-12 shows the inverter weight distribution for the different used voltage rating components. The cooling system mass, which is a direct image of the power losses through the coefficient given by Airbus, is the predominant weight of the inverter. The bus bar comes in second place and will be dominant if the heat exchanger weight is reduced.
Fig. I-12. Inverter weight distribution for different used voltage rating components
Small rating components have of course better performances, but the direct series association is hard to realize so using multilevel topologies could be a solution. From these examples, the main factors to increase power density are identified. The first one is decreasing the cooling system mass, optimizing its components or by reducing power losses. The second one will be to optimize the bus bar weight.
4. Conclusion
HASTECS project studies the possibility of electric propulsion hybridization in an aircraft. Besides the global architecture, the different work packages aim to increase the specific power of the different components of a high-power electric chain incorporating a high-voltage DC
6% 3% 80% 11% DC bus capacitors Semiconductor device Exchanger Busbar 15% 2% 53% 30% 16% 7% 40% 37% 𝑽 𝒂𝒕 = 𝑽 𝑽 𝒂𝒕 = 𝑽 𝑽 𝒂𝒕 = 𝑽 5 5 5
37 bus, its wiring and power electronics interfacing the bus and the electric motor to have a solution that can be fitted in an aircraft.
This study will lead to an optimization of the complete chain that will propose the interesting structures integrating all aeronautical constraints such as partial discharges for electrical equipment placed in a non-pressurized zone or case of high operating voltage even in a pressurized zone. In this Ph.D., power electronics topologies, smart control, and modulation strategies and also semiconductor technologies will be taken into account. This work objective is to design a highly integrated power electronics inverter with a specific power of 15 kW/kg for 2025 target and 25 kW/kg for 2035 target including its cooling system.
Our work package focuses on the power electronics converter. To guide the work of the various work packages of the project, a first step is to define an optimal DC bus voltage range. This has a direct impact on the study of partial discharges but also in the design of motor windings. This will be done using a developed simulation tool, detailed in Chapter II, which uses the conventional inverter topologies model and components from the available database, to compute the inverter performances as efficiency, maximal junction temperature, and total weight.
Then, it is necessary to compare the efficiency and power density of several multilevel topologies, modulation strategies and components technologies which will be evaluated in Chapter III, to find the optimal solution. A 3D inverter model will be designed to estimate more accurately the total inverter weight including the bus bar. This study will lead to the inverter topologies choice for the given specification.
In chapter IV the chosen inverter topologies will be evaluated for two electric motor configuration for the entire flight mission. A comparative study of modulation control strategies will be carried out to highlight the structure and modulation presenting the best performance to minimize the losses.
39
II. Simulation tool
This work aims to develop a pre-design tool which allows to pre-size the converters and their components for a DC to AC 3 phases inverter as in Fig. II-1. It computes different performance results for different conversion architectures. Its main entries and results are as follows:
Entries:
Specification (DC bus voltage, output power, load power factor…), Inverter topologies,
Modulation strategy, Switching frequency,
Semiconductor manufacturer,
Heat exchanger coefficient is given by WP4 that translates power losses to cooling system weight.
Results:
Efficiency
Semiconductor power losses (conduction and switching), Number of semiconductors associated in series and in parallel, Maximal junction temperature,
Semiconductors, capacitors and cooling system weights, Specific power.
The results are shown as figures for different parameters of different architectures behaviors.
Fig. II-1. Studied electric system
In this chapter, the organization of the software will be presented. In this software, the inverter topologies and modulation strategies are fixed so that the user can choose his inputs from those available. It calculates the power losses and junction temperature for each selected case according to the model that will be detailed later in this chapter using the parameters of the selected semiconductor. This semiconductor device is selected from the available database or can be generated in such a way as to adapt to the necessary current and voltage calibers if the user so decides, according to the generation principle which will be described and validated below. The sizing of the capacitor will then be explained. The loss models will then be validated using a time simulation on Plecs for several inverter topologies. These models and the generated components will then help to define the voltage range of the DC bus, which corresponds to the first step of the WP2's work.

![Fig. I-6. General propulsion schematic system during a mission of an aircraft [28]](https://thumb-eu.123doks.com/thumbv2/123doknet/2960537.81388/29.892.115.789.510.829/fig-i-general-propulsion-schematic-mission-aircraft.webp)
![TABLE I-4. Electric components specific power state of the art and research targets [29]](https://thumb-eu.123doks.com/thumbv2/123doknet/2960537.81388/31.892.105.810.262.582/table-electric-components-specific-power-state-research-targets.webp)
![Fig. II-7. Equivalent thermal model of an IGBT component with antiparallel diode [30] [32] ii](https://thumb-eu.123doks.com/thumbv2/123doknet/2960537.81388/47.892.148.726.589.937/fig-equivalent-thermal-model-igbt-component-antiparallel-diode.webp)