HAL Id: hal-02466583
https://hal.archives-ouvertes.fr/hal-02466583
Submitted on 4 Feb 2020
HAL is a multi-disciplinary open access
archive for the deposit and dissemination of
sci-entific research documents, whether they are
pub-lished or not. The documents may come from
teaching and research institutions in France or
L’archive ouverte pluridisciplinaire HAL, est
destinée au dépôt et à la diffusion de documents
scientifiques de niveau recherche, publiés ou non,
émanant des établissements d’enseignement et de
recherche français ou étrangers, des laboratoires
Study of the effect of acoustic sound bridges on wind
instruments: Perceptual study with a panel of trumpet
players
Jean-François Petiot
To cite this version:
Jean-François Petiot. Study of the effect of acoustic sound bridges on wind instruments: Perceptual
study with a panel of trumpet players. ISMA2019, Sep 2019, Detmold, Germany. �hal-02466583�
Study of the effect of acoustic sound bridges on wind instruments: Perceptual
study with a panel of trumpet players
Jean-François PETIOT
LS2N, UMR CNRS 6004, Ecole Centrale de Nantes, France, Jean-Francois.Petiot@ec-nantes.fr
Abstract
The study of the quality of a musical instrument, as perceived by the musician, is a complex problem. Many subtle phenomena are involved and several devices, or materials, are proposed to musicians, with a noticeable commercial success for some of them. We are interested in a particular device: sound bridges for wind instruments (made of two plates, clipped at a joint of a wind instrument with a rubber band). The objective of the work is to study if audible differences, due to the presence of the sound bridges, can be highlighted during trumpet playing. An ABX test was carried out with a panel of 5 skilled trumpet players with various status (from amateur to professional) and various use degrees of the bridges in their practice (from always to not-user). After a training phase, musicians were blinded and asked to answer to several repetitions of an ABX test in free playing conditions. Results were analyzed with the binomial distribution and the Signal Detection Theory (SDT). In addition, several repetitions of different notes were blind recorded with and without the bridges. A spectral analysis was carried out to test whether or not a significant effect of the acoustic bridges can be highlighted.
Keywords: sound quality, blind test, ABX test
INTRODUCTION
1
The high degree of performance required to professional musicians leads them to continuously try to improve the quality of their instrument, together with a relative ease of playing. Different materials [1], mouthpieces [1w], additional devices [2w] are proposed to help them to improve the tonal quality of their instrument. Several years ago, acoustic bridges [2w] were developed for wind instruments. They are made of two plates, clipped with a rubber band. According to the maker, these bridges must be placed at a joint of a wind instrument. “They acoustically connect the sections of your wind instrument, combining the benefits of both. The result is an unequaled improvement of your sound quality: purer overtones, accurate tuning, clear response, smooth intervals, extended dynamics, surround projection” [2w]. From a scientific point of view, the functioning of such bridges is very intriguing but few documented. It seems that they modify the wall vibrations at the connection between different parts of the instrument, but explanations are rather laconic and unclear. Despite their uncontestable commercial success, there are very few scientific studies on the effect of these sound bridges on the acoustical qualities of musical instruments. The only work that deserves to be cited concerns a spectral analysis of the effect of bridges on the sound of a piccolo flute, played by a musician [3w]. The authors present a spectral analysis of steady state piccolo sounds, and compare the spectra. They claim that difference observed between the spectra are due to the presence of the bridges, and that the spectral centroid of the instrument increases with the presence of the bridges. But the conclusions presented in [3w] are worthless for at least two reasons:
- The player is aware of the condition played (with or without the bridges) for the recording of the sounds.
On the contrary, the player should be blindfolded, ignoring which condition he/she plays (with or without the bridges). This is imperative to prevent the player adjusting his/her playing with respect to the experimental condition,
- No statistical analysis is provided on the magnitude of the differences observed between the spectra w.r.t.
the experimental error (repeatability error). This analysis is also imperative, a perfect repeatability of a real musician in the playing of a note being totally impossible.
In view of the multiple discussions present on the Internet about these bridges, and their adoption by many skilled musicians (and also their students), we decided to start an impartial study on the effect of these bridges. We are of course aware that things may become quickly very complex when one tackles the problem of the
subtle interactions between a musician and his/her instrument. Before any study, we suspect that a main effect, the placebo effect, is certainly very important in the perception of musicians. We are not studying this effect in this paper: we concentrate on stable effects that can be measured, justified with physical measurements, and highlighted with a scientific experimental protocol. For this reason, this study uses a statistical approach with blindfolded musicians.
The objective of this paper is to determine whether a significant effect of the presence of the bridges can be highlighted during Bb trumpet playing. Section 2 presents the material and methods used for the test. Section 3 presents the results of the tests and conclusions are drawn in section 4. In the reminder of the paper, the acoustic sound bridges are simply called “the bridges”.
MATERIAL AND METHODS
2
2.1 Acoustic sound bridges for the trumpet
A picture of the sound bridges for a trumpet is presented figure 1 (left). The bridges consist of two curved metallic plates, clipped between the mouthpiece and the receiver with a rubber band [2w]. The bridges were set on the trumpet as recommended on the website. Two acoustic sound bridges were used: a 33mm red brass, and a 33mm gold (provided by one of the musicians of our panel).
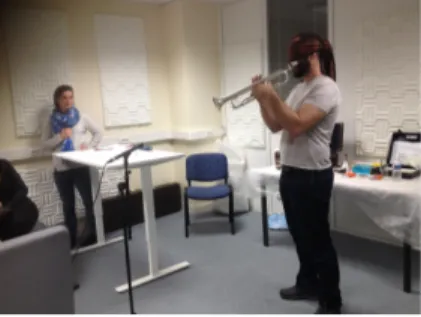
Figure 1. (left): Assembly of the bridges on the mouthpiece of the trumpet. (right): Trumpet player performing an ABX blind test of the bridges in free playing conditions
2.2 Recordings with a musician
Using the same mouthpiece (Yamaha 15C4), and the same trumpet (Yamaha, model 6335), P = 9 repetitions of the same note (Bb4) were recorded with the same musician. The musician was blindfolded for all the recordings. All the recordings (sampling frequency 192 000Hz, 16 bits) were made in the same room (recording studio) with an APEX 191 microphone. The microphone was placed in the axis of the bell (distance = 10 cm) and connected to the preamplifier and a Digigram Vx pocket V2 soundcard. The position of the tuning slide was the same for all the recordings. In order to limit as much as possible the variability inherent to the musician, he was asked to play the note in a given dynamic (mezzo forte), without vibrato and with an as stable as possible way. The duration of each note was about 3 seconds, two series of 9 notes being recorded, one with the bridges, and one without the bridges.
The sounds were next windowed to suppress the transient part of the signal, and standardized with their RMS pressure. With the remaining part of the signal (considered as the permanent regime), a spectral analysis was made (FFT) to extract the amplitude of the different harmonics. For each experimental condition (with or without the bridges), an average spectrum was computed by averaging the magnitude of the spectra for the 9 repetitions, as well as the average amplitudes of the 10 first harmonics and their standard deviation. To compare the differences between the amplitude peaks, a permutation test was used to test the difference between the average values for the 10 first harmonics [2].
2.3 Participants to the perceptual test
Five musicians participated to the perceptual test. They were all regular trumpet players, since more than 10 years. All of them knew the existence of these bridges, some of them having their own. The main characteristics of the participants of the test concerning their trumpet playing are given in table 2. Musician M3 used the gold bridges for the test, whereas the other musicians used the red brass.
2.4 ABX test 2.4.1 Procedure
The ABX test is a common test in the audio engineering community. It is used in studies of auditory perception and discrimination [3] mainly to determine if an audible difference exists between two stimuli A and B. After a listening of the two stimuli A and B, a stimulus “X” (randomly chosen between A or B) is presented to the participant. The task of the listener is to identify whether stimulus X is A (X = A), or B (X = B). To increase the confidence in the decision, several repetitions of the ABX presentations to the same participant are required. In each round of tests, a minimum of 10 listening trials is generally required, whereas the maximum number of repetitions does not generally exceed 30, to not fatigue the listener. The ABX test relies on the short-term memory of the participant, and to conscious differences.
In our test, the objective is to determine if the differences in the playing of the trumpet with or without the bridges are perceptible by the player. The two stimuli A and B correspond respectively to the presence of the bridges on the trumpet mouthpiece (A) and the absence of the bridges (B). The experiment made was simple-blinded (the experimenter, who set the bridges on the trumpet, was aware of the condition X presented to the participant (we assume a double-blinded test was not necessary, given that the experimenter stayed salient during the experiment – the time for preparing the condition A or B was the same whatever the condition). The following stages were defined for the progress of the test:
• Welcome: the participant is informed about the objective of the test and basic explanations on an ABX task are provided,
• Training phase (30mn): the participant is invited to play freely his/her own trumpet and mouthpiece with
or without the bridges. Feedbacks of the participant about the possible effect of the bridges are recorded by the experimenter,
• ABX test (40mn) (Cf. figure 1 right): the participant is blindfolded during all the stage. N = 20 successive repetitions of the ABX presentations are proposed to the participant. The bridges are set to the instrument by the experimenter. Each presentation includes the following stages:
o Presentation of the condition A = with the bridges. The participant is informed, and asked to play freely the trumpet,
o Presentation of the condition B = without the bridges. The participant is informed, and asked to play freely the trumpet,
o Presentation of the condition X (with a random assignment of A or B to X). The participant is asked to play freely the trumpet, and to make a decision, A, or B. No time limit is imposed for the decision. The experimenters paid particular attention to the fact that the participant did not touch the mouthpiece (and of course the bridges) during the free playing phase.
• Debriefing (10mn): Blindfold is removed. Discussion with the participant about the test, and feedbacks
are recorded by the experimenter.
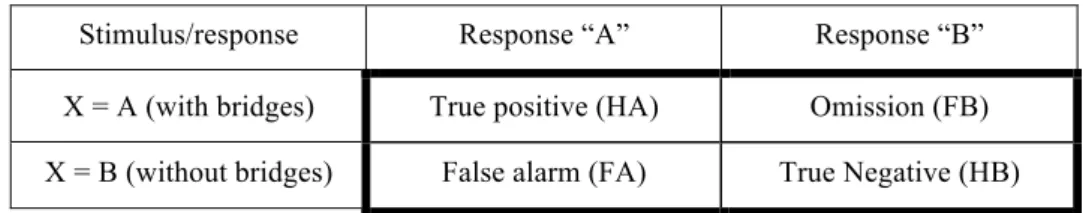
At the end of the test, the confusion matrix of each participant is built (table 1). It summarizes the results of the N = 20 ABX presentations.
Table 1. Confusion matrix of an ABX test
Stimulus/response Response “A” Response “B”
X = A (with bridges) True positive (HA) Omission (FB)
X = B (without bridges) False alarm (FA) True Negative (HB)
Several performance indexes can be computed from the confusion matrix. The percentage of correct responses, p(C), is given by:
p(C) =
HA + HB
HA + HB + FA + FB
(1)The sensitivity Se represents the subjects’ ability to detect the presence of the bridges, while the specificity Sp represents the subjects’ ability to detect its absence.
Se =
HA
HA + FB
(2)Sp =
HB
HB + FA
(3) 2.4.2 Statistical analysis 2.4.1.1 Binomial distributionThe first way to analyze the results of an ABX test is to use a simple application of the binomial distribution to determine a probability to obtain such results by chance. The principle is to consider that the response of the participant is random (A or B, with probability = 0.5) when no difference is detected. It corresponds to a Bernoulli trial (random experiment with exactly to possible outcomes; success and failure). The discrete probability distribution of the number of successes in a sequence of N trials corresponds to the binomial distribution. Under the assumptions of random guesses of the participant along the test, a p-value can be calculated with the number of successes, the number of trials, and the binomial distribution. This p-value corresponds to the probability of randomly getting a number of successes at least higher than the one obtained, in the same conditions. A 5% threshold is generally considered for the p-value. In summary, the outcomes of the test are as follows:
• If p-value ≥ 5%: the test is not significant (the probability to obtain such results by chance is too important). Conclusion: there is no significant perceptual difference between A and B. It is important to mention here that this does not signify that there is no difference between A and B. It only signify that the differences can be so weak that they cannot be highlighted with the ABX test carried out, • If p-value < 5%: the test is significant. There is a significant perceptual difference between A and B Some assumptions are needed to employ the binomial distribution
- the distribution of the correct answer X = A and X = B is random throughout the test
- the N trials must be N independent experiments. This assumptions is debatable, the same participant is
doing the experiment, subjected to learning effect or fatigue
is also highly debatable: possible response biases of participants can occur (the participant can e.g. always respond A when he/she is unsure).
For these reasons, a more robust analysis of ABX tests can be done with signal detection theory [3]. It allows the distinction between sensitivity (the ability of an observer to reflect a stimulus–response correspondence defined by the experimenter) from response bias (the tendency to favor one response (A or B) over the other).
2.4.1.2 Signal detection theory
The results of confusion matrices can be represented with a common plot in signal detection theory, the ROC plot (Receiver Operating Characteristic) [4]. This graphical plot represents the sensitivity Se (true positive rate) according to (1-specificity) (1-Sp), i.e. the false positive rate. Each confusion matrix is represented by a point in the ROC space. A perfect detection is represented by the (0, 1) point, and a random detection is located along the diagonal line (p(C) = 0.5 – line of no discrimination). The relevance of the discrimination can be assessed on this plot by the distance of the point above the diagonal: the greater this distance, the more relevant the discrimination. To qualify the performance in the detection relatively to random choices, an independence test using the Binomial Distribution is proposed [5]. From the Binomial Distribution, with a specific number of trials, and an observed number of correct identifications, a 95% confidence threshold can be calculated for the sensitivity (lower bound) and for (1- specificity) (upper bound). These limits are indicators helping to estimate the musicians’ reliability.
In addition to ROC curves, it is possible to calculate an index, d’, that allows the separation of sensitivity (ability to discriminate between A and B) from bias (conservative or liberal response, favoring A or B when the participant is unsure) [3]. The principle is to consider that the detection between two stimuli A and B is presented along some sensory continuum. The decision between A and B is represented by two distributions, supposed normal. From the confusion matrix of an ABX experiment, the hit rate and false detection are used to estimate the relative location of these two distributions. Two classical measurements are computed to characterize the detection: the sensitivity index, d’, that measures the distance between the means of the two distributions A and B in standard deviation units, and the bias, c, that represents the tendency to favor one response (A or B) over the other.
In our experiment, we assume that the decision strategy of the participant is similar to a yes/no experiment (yes: bridges are present; no: bridges are absent – we do not consider the independent-observations or the difference decision strategies that are relevant for true ABX tests [6]). The sensitivity index d’ and bias c are given by:
d ' = z(HA)− z(FA) = z(HB)− z(FB)
(4) c =z(HA) + z(FA) −2 = z(HB) + z(FB) 2 (5)Where z represents the z-score (
z(x) =
φ
−1(x)
: inverse normal cumulative distribution function).A value of 0 for d’ indicates an inability to distinguish signals from noise (A from B), whereas larger (positive) values indicate a correspondingly greater ability to distinguish between A and B.
SDT states that dʹ is unaffected by response bias (i.e., is a pure measure of sensitivity) if two assumptions are met regarding the decision variable: (1) The signal and noise distributions are both normal, and (2) the signal and noise distributions have the same standard deviation. We consider that these assumptions are valid.
σ2 (d ') = HA(1− HA) (N 2).(ϕ(HA)) 2 ⎛ ⎝ ⎜ ⎜ ⎜ ⎞ ⎠ ⎟ ⎟ ⎟+ FA(1− FA) (N 2).(ϕ(FA)) 2 ⎛ ⎝ ⎜ ⎜ ⎜ ⎞ ⎠ ⎟ ⎟ ⎟ (6)
Where
ϕ
is the probability density function of the standard normal distributionFrom the standard deviation σ, a 95% confidence interval CI can be computed for d’ with .
RESULTS
3
3.1 Binomial distribution
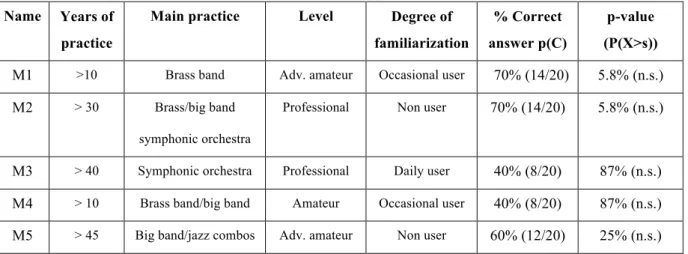
The analysis of the results of the ABX test with the binomial distribution is given in table 2. For all the musicians, the percentage of correct responses is always lower than 70% (14/20). The results are not significant at the 5% level (p-values greater than 5%). The p-value being greater than 5%, we cannot reject the assumption that the participants were merely guessing. Therefore, we can conclude that the effect of the presence of the bridges on the perception of trumpet player is not significant at the 5% level. Nevertheless, two musicians, M1 and M2, obtained high ratio of correct answer (70%), even if not significant. Investigations should be carried out to confirm whether these relatively high ratios of correct answer are stable or not, with slightly different conditions of the test.
Table 2. Results of the ABX test (Ratio of correct answer and p-value w.r.t. the binomial distribution) for the five musicians M1 to M5.
Name Years of practice
Main practice Level Degree of
familiarization
% Correct answer p(C)
p-value (P(X>s))
M1 >10 Brass band Adv. amateur Occasional user 70% (14/20) 5.8% (n.s.) M2 > 30 Brass/big band
symphonic orchestra
Professional Non user 70% (14/20) 5.8% (n.s.)
M3 > 40 Symphonic orchestra Professional Daily user 40% (8/20) 87% (n.s.) M4 > 10 Brass band/big band Amateur Occasional user 40% (8/20) 87% (n.s.) M5 > 45 Big band/jazz combos Adv. amateur Non user 60% (12/20) 25% (n.s.)
It is important to mention that there is no correlation between the performance of the participants to the test and their habit of use of the bridges, or their overall level: the daily user of bridges (M3) got the lowest ratio, whereas one non-user (M2) obtained the highest score.
3.2 ROC (receiver-operating characteristics) analysis
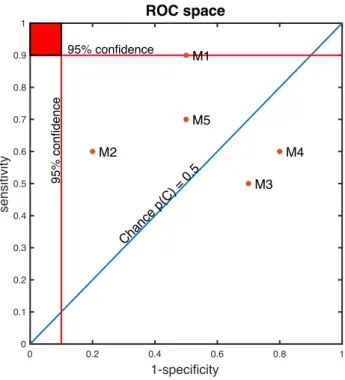
The locations of the five musicians in the ROC space are given in figure 2.
Figure 2. Locations of the five musicians in the ROC space
Musician M1, M2 and M5 are slightly above chance for the detection of the bridges. Musician M1 obtained the best sensitivity (Se = 0.9) but the false alarm rate (1-specificity) is important (0.5). This is because he favored the response “A” in the ABX test. Musician M2 obtained a low false alarm rate (0.2) but he is not very sensitive in the detection (Se = 0.6). Musician M3 and M4 are slightly under the chance line, due to too many reverse decisions in the ABX test. A musician with a perfect detection of the bridges should locate in the upper left corner of the ROC space (coordinates (0,1)). To be significant at the 95% level, the musician should locate in the red square in the upper left corner. As a conclusion, the detection of the bridges is not significant for none of the musicians.
3.3 Signal detection theory
The analysis of the test with the SDT gives the results presented in table 3. They confirm the previous results: even if the values of d’ are greater than 1 for some musicians (M1, M2), the confidence intervals include the value “0” and do not allow one’s to conclude to a significant detection of the bridges.
0 0.2 0.4 0.6 0.8 1 1-specificity 0 0.1 0.2 0.3 0.4 0.5 0.6 0.7 0.8 0.9 1 sensitivity ROC space M1 M2 M3 M4 M5 95% confidence Chance p(C) = 0.5 95% confidence
Table 3. Results of the ABX test according to sensitivity index d’ and bias c
Name Sensitivity index d’ and 95% Confidence interval
Bias c Conclusion
M1
1.28 ±1.31
0.64 Average sensitivity. Important bias (in favor of the “A” response).Confidence interval include “0”: detection not significant
M2
1.09 ±1.18
-0.29 Average sensitivity. Bias in favor of the “B” responseConfidence interval include “0”: detection not significant
M3
−0.52 ±1.12
0.26 Low sensitivity (d’ negative). Bias in favor of the “A” responseConfidence interval include “0”: detection not significant
M4
−0.58 ±1.18
0,55 Low sensitivity (d’ negative). Bias in favor of the “A” responseConfidence interval include “0”: detection not significant
M5
0.52 ±1.12
0.26 Average sensitivity. Bias in favor of the “A” responseConfidence interval include “0”: detection not significant
3.4 Spectral analysis
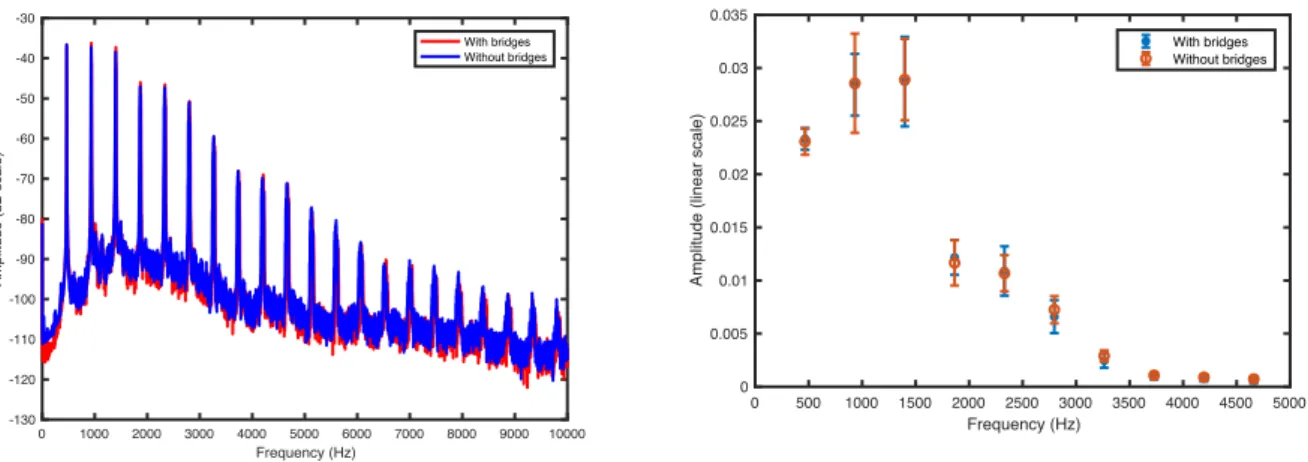
The average spectra for the two conditions (with and without bridges) for the note Bb4 of the trumpet are given in figure 3 (left). No noticeable difference can be highlighted between the average spectra: the variations are weak and probably due to the variability of the musician.
Figure 3. (left): Average spectra with and without the bridges of the note Bb4 – (right): Average amplitude and standard deviation of the 10 first harmonics of the note Bb4
To study statistically the difference between the spectra, the average amplitude of the ten first harmonics, with their standard deviation, are given in figure 3 (right). A permutation test, presented in table 5, confirms that none of the difference between the average values of the amplitudes of the harmonics is significant.
0 1000 2000 3000 4000 5000 6000 7000 8000 9000 10000 Frequency (Hz) -130 -120 -110 -100 -90 -80 -70 -60 -50 -40 -30 Amplitude (dB scale) With bridges Without bridges 0 500 1000 1500 2000 2500 3000 3500 4000 4500 5000 Frequency (Hz) 0 0.005 0.01 0.015 0.02 0.025 0.03 0.035
Amplitude (linear scale)
With bridges Without bridges
Table 5. p-value of the permutation test for the differences between the average values of the harmonics amplitude Harmonics n° 1 2 3 4 5 6 7 8 9 10 p-value 0.67 0.94 0.92 0.60 0.83 0.38 0.17 0.20 0.51 0.20
CONCLUSIONS
4
The main conclusion of this work is that with the ABX test carried out, the experimental conditions (free playing on his/her own trumpet) and the panel of 5 musicians, there is no significant effect of the presence of the bridges on the perception of the trumpet players. Similarly, the spectral analysis of sound in permanent regime did not allow the highlighting of significant difference between the sounds, with or without the bridges. If there is an effect of these bridges on the acoustics of the trumpet, and on the perception of the musician, it is weak, very difficult to highlight. It is important to mention here that the ABX test carried out does not prove that there is no effect of the bridges: these perceptual tests can only prove differences between stimuli, not prove that there is no difference. Other tests, with different experimental conditions, could be organized to try to highlight in a scientific way the effect of the bridges. Nevertheless, for at least two musicians (M1 and M2), the results of the ABX tests are relatively close to significance. This should ask questions about the cues used by the musicians to make their decision. On this subject, things are unclear: one of them reported an easiness in the playing of the high range with the bridges, while the other reported a brighter sound. This refers to the scientific explanations on the functioning of the bridges, which are flimsy for the moment, from an acoustical point of view. The explanations presented on the Internet are not scientifically valid, and no clear explanation on the physical principles used by the bridges is provided. This could be the topic of another paper.
ACKNOWLEDGEMENTS
Acknowledgments to Camille Berlizot and Marie Thibeaud of the specialization “Science and Music” of Ecole Centrale Nantes who led the perceptual tests. The author would also warmly thank the trumpet players (Emilie Boudou, Florent Buisson, Jean-Marie Cousinié, Eric Mussotte) who took part in the perceptual tests with great care and patience. Thank to Dominique Brisson from the music shop DB Musique Service (44400 Rezé, France) for lending different acoustic bridges.
This research was financed by public founds and is totally independent of any commercial company.
REFERENCES
[1] Smith R. The effect of material in brass instruments: a review. Proceedings of the Institute of Acoustics. Vol. 8, Part 1, pp 91-96, 1986.
[2] Good, Phillip. Permutation tests. A practical guide to resampling methods for testing hypotheses. Springer series in Statistics, 2000.
[3] Macmillan, N.A; Creelman, C.D. Detection Theory: A User’s Guide. Second edition. LEA Publishers, Mahwah, New Jersey, Erlbaum, 2005.
[4] Mahony M.; Hautus, M.J. The signal detection theory ROC curve. Some applications in food sensory science. Journal of Sensory Studies 23, 2008, 614-621.
[5] Boley, J; Lester, M. Statistical Analysis of ABX Results Using Signal Detection Theory. Convention paper Audio Engineering Society, 127th Convention, 2009.
[6] Hautus, M. J.; Meng, X. Decision strategies in the ABX (matching-to-sample) psychophysical task. Perception & Psychophysics, 2002, 64, 89-106.
[1w] https://www.syos.co/fr. Internet page of the SYOS company. Customization of saxophone mouthpieces. Last visited June 19, 2019.
[2w] https://www.lefreque.com. Web site of a seller of acoustic bridges. Last visited June 19, 2019.
[3w] https://www.lefreque.com/how-to-use/spectral-analysis: Research conducted by the Department of Applied Physics and the Centre for Physical Technology (Acoustics, Materials and Astrophysics) from the Polytechnic University of Valencia (Spain) of Valencia, (Spain). Last visited June 19, 2019.