To cite this version :
Lachin, Kevin and Le Sauze, Nathalie and Di Miceli Raimondi,
Nathalie and Aubin, Joelle and Fletcher, David F. and Cabassud,
Michel and Gourdon, Christophe Towards the design of an intensified
coagulator. (2017) Chemical Engineering and Processing, vol. 121. pp. 1-14.
ISSN 0255-2701
O
pen
A
rchive
T
OULOUSE
A
rchive
O
uverte (
OATAO
)
OATAO is an open access repository that collects the work of some Toulouse researchers
and makes it freely available over the web where possible.
This is an author’s version published in :
http://oatao.univ-toulouse.fr/19846
Official URL :
https://dx.doi.org/10.1016/j.cep.2017.08.003
Any correspondence concerning this service should be sent to the repository administrator :
tech-oatao@listes-diff.inp-toulouse.fr
Towards the design of an intensified coagulator
K. Lachin
a, N. Le Sauze
a, N. Di Miceli Raimondi
a, J. Aubin
a,⁎, D.F. Fletcher
b, M. Cabassud
a,
C. Gourdon
aaLaboratoire de Génie Chimique, Université de Toulouse, CNRS, INPT, UPS, Toulouse, France bSchool of Chemical and Biomolecular Engineering, The University of Sydney, NSW 2006, Australia
A R T I C L E I N F O
Keywords:Coagulation
Laminar flow simulation Lagrangian particle tracking Millimetric reactors Meandering channels Process intensification
A B S T R A C T
This study compares the hydrodynamics in three millimeter-scale continuous reactor geometries that can be easily used in laboratories and industries – a straight tube, a coiled tube and a Dean-Hex reactor – via numerical simulations and analyses the data in a way that is specifically relevant to coagulation processes, thereby offering insights for engineers to develop new coagulation reactors. A numerical approach based on Lagrangian particle tracking is presented to better understand the impact of the geometry and flow on properties that influence coagulation. The results show that the Dean-Hex meandering geometry provides narrower residence time and shear rate distributions, as well as higher mean average shear rates and Camp number distribution than the other geometries. This is attributed to the generation of transverse flows and radial mixing in the Dean-Hex reactor and suggests that a faster and more homogenous coagulation can be expected.
1. Introduction
Coagulation is a key process in several industries. When considering wastewater treatment the coagulation/flocculation process is used to remove the undesired organic matter from water, and is essential to the success of the wastewater cleaning process [1]. In the polymer in-dustries, latex coagulation typically follows emulsion polymerization, and aims at controlling both particle size distribution (PSD) and the shape of the aggregates. As the quality of the resulting polymer pro-ducts directly depends on these properties, coagulation must be con-trolled well.
Two main collision mechanisms can lead to coagulation. When the colloidal particles are small enough (i.e. with diameters less than sev-eral hundred nanometers) they will undergo Brownian motion. Temperature thus has a significant impact on coagulation; the term perikinetic coagulation is then used. Above particle diameters of several hundreds of nanometers, the hydrodynamics have an impact on coa-gulation. When particles/aggregates are large enough so that coagula-tion is driven only by shear rates, the terms orthokinetic coagulacoagula-tion or shear coagulation are used.
In most industries, latex coagulation/flocculation is performed in agitated vessels [2]. As a consequence, coagulation experiments in these devices can easily be found in the literature [3–9]. However, coagulation in stirred tanks often results in a broad PSD, heterogeneous shapes and other issues, such as fouling, due to poor control of local
hydrodynamics and uneven mixing.
In order to overcome these problems, new processes have to be studied and developed. One of the most interesting alternatives studied so far is the use of tubular reactors, whether in laminar [10–14]or turbulent[1,15]flow conditions. When the characteristic length of the reactor is in the millimeter range, coagulation typically occurs in la-minar flow conditions. Despite a broad distribution of shear rates due to the parabolic flow profile, it is possible to obtain almost spherical in shape aggregates due to the promotion of ballistic collisions between aggregates presenting size disparities[16]. Another interesting alter-native, so far not considered for latex coagulation, is the use of milli-meter-scale intensified reactors, which allow transverse mixing throughout the reactor, and thus reduce axial dispersion generated by the laminar velocity profile[17]. Among these reactors, those with meandering channels, sometimes referred to as “Dean-Hex” or zigzag reactors, are of particular interest here due to the relative simplicity of their conception. By promoting the generation of the so-called Dean vortices, these geometries enhance mixing during within the flow[18], and thus offer a way to overcome broad residence time distributions (RTD) encountered in straight tubes in laminar flow.
The aim of this paper is thus to investigate numerically the hydro-dynamics inside three millimeter-scale geometries that can be easily used in laboratories and industries – a straight tube, a coiled tube and a Dean-Hex reactor – and extract relevant data with regards to coagula-tion phenomena, offering insights for engineers to develop new
⁎Corresponding author.
E-mail address:joelle.aubincano@ensiacet.fr(J. Aubin).
coagulation processes. 2. Theory
2.1. Shear coagulation theory
In the early twentieth century, Smoluchowski[19]theorized shear coagulation in analogy with chemical kinetics. By assuming that:
•
the flow is laminar,•
all collisions are efficient (no repulsions between particles due to electrostatic or hydrodynamic effects),•
the particles follow streamlines,•
the particles can be considered as spheres,•
all the particles have equal radii, r,he derived an equation describing the evolution of the total number of particles per unit volume( )N with the average shear rate G. The decrease of N is given by Eq.(1):
−dN = dt GN r 16 3 2 3 (1) Later, several authors took into account the hydrodynamic inter-actions occurring when particles are close by correcting the coagulation kinetic equation with a purely hydrodynamic efficiency, α. Among the most commonly used efficiencies, the theoretical expressions proposed by Higashitani et al.[20], Han and Lawler[21]or the semi-empirical formula recently introduced by Selomulya et al.[22]can be mentioned. By inserting the efficiency α into the balance presented earlier, one obtains Eq.(2): −dN = dt α GN r 16 3 2 3 (2) The volume fraction of the particles
(
φ=43πr N3)
can be introducedin Eq.(2)to obtain Eq.(3):
−dN =
dt απGφN
4
(3) By integrating Eq.(3), an expression giving the decrease of N with time is obtained [11] (Eq. (4)). It assumes that the hydrodynamic
efficiency, the volume fraction of particles and the average shear rate are constant along the coagulator.
= ⎛ ⎝ − ⎞ ⎠ N N αφGt π exp 4 0 (4)
Interestingly, the coagulation rate given by Eq.(4)is directly related to the product Gt, sometimes called the Camp number. Despite the limitations of this expression, which is rigorously valid only during the early stages of coagulation when the primary particles can be con-sidered as spheres of equal radii, it clearly shows that the higher the Camp number, the higher the coagulation rate.
2.2. Hydrodynamic dimensionless quantities
When the geometry in which the fluid circulates displays curva-tures, centrifugal forces can have an influence on the flow behavior. Dean[23]was the first to numerically solve the problem in curved pipes. He demonstrated the presence of recirculation loops under la-minar flow conditions when centrifugal forces become significant. He thus proposed the use of a dimensionless quantity – the so-called Dean number(De) – to determine whether centrifugal forces can have a significant impact on the flow. The common expression used for cal-culating De is defined in Eq.(5):
=
De Re d
R
h
curv (5)
where Rcurvis the radius of curvature at the center of the bend and Re
the Reynolds number, defined using the hydrodynamic diameter of the considered pipe dh. In laminar flow, an increase in De means a shift of
Nomenclature
Dax Axial dispersion coefficient (m2s−1)
De Dean number (−) dh Hydraulic diameter (m)
E(t) Residence time distribution (s−1)
Fdrag Drag force (N)
G Average shear rate inside the reactor (s−1)
Gav,part Average shear rate experienced per particle (s−1)
Gmax,part Maximum shear rate experienced per particle (s−1)
H Depth of the square channels (m) L Length of the reactor (m) mp Mass of particle tracer (kg)
N Concentration of particles (m−3)
NCamp Camp number (−)
NSL Number of sub-layers in the inflation layer (−)
Nw Total number of weighted particles (−)
Pe Péclet number (−) Q Flow rate (m3s−1)
r Radial coordinate (m) Re Reynolds number (−) Rtube Radius of the tube (m)
Rcurv Radius of curvature (m)
S Cross-sectional area (m2) t Residence time (s) T Fluid temperature (K)
tm Mean residence time of the particles (s)
u Velocity vector (m s−1)
uinlet Inlet velocity (m s−1)
uav Average velocity (m s−1)
und Non-dimensional velocity (−)
V Volume of the reactors (m3)
X Particle location vector (m) x Cartesian coordinate (m) y Cartesian coordinate (m) Greek letters
α Hydrodynamic collision efficiency (−)
δt Characteristic size of the cell volume in the tetrahedral
mesh (m)
µ Fluid dynamic viscosity (Pa s)
φ Volume fraction of the particles (−)
ρ Fluid density (kg m−3)
σ2 Variance of the distribution (s2)
τ Fluid residence time (s)
Table 1 Dean-Hex parameters. Parameter Value (mm) L1 10.36 L2 10 L3 16.33 A1 2.42 A2 4.71 A3 9.42
the peak velocity away from the center of the channel to the outer wall. In a circular section, this results in the generation of a secondary flow normal to the main flow direction that is induced by centrifugal effects. In rectangular ducts, these structures are also observed and additional Dean vortices can appear beyond a critical value of De (between 100 and 250 depending on the vortex detection method)[24].
The appearance of primary and secondary Dean vortices is of great significance for mixing enhancement in laminar flow and process in-tensification. For example, in the case of a heat exchanger reactor, these vortices will enhance the renewal of the fluid layer at the walls, thus drastically improving heat exchange between the utility fluid and the process fluid compared with straight geometries[18]. Intensified re-actors promoting the generation of Dean vortices can thus be of great help for studying chemical reactions that are difficult to perform in conventional batch vessels due to the risk of thermal runaway[25,26].
3. Reactor geometries
Three geometries – a straight tube with square section, a coiled tube with circular section and a wavy geometry with square section, called “Dean-Hex” – of equal volume (V = 6.59 × 10⁻⁷m3
) and equal cross-section area (S = 3.14 × 10⁻⁶m2) have been considered for this study.
The cross-section corresponds to the section of a coiled tubular reactor considered in a previous experimental coagulation study[27]. 3.1. Straight tube
The straight tube with square cross-section is used as a reference for the later comparisons. The height of the section side (H = 1.77 mm) is chosen to be representative of a millimetric channel: the cross-section area of a 1.77 mm side square is indeed equivalent to that of a 2 mm diameter tube.
3.2. Coiled tube
The second geometry considered is a coiled tube, with the same length L as the straight tube. The internal diameter (dtube= 2 mm) and
the radius of curvature are chosen to correspond to realistic experi-mental conditions, where these tubular reactors are conventionally wound around small cylindrical guides to avoid space loss. As a con-sequence, the curvature radius of the tube Rcurv is chosen equal to
37 mm, which corresponds to the radius of the cylindrical guide that has been used to carry out latex coagulation experiments[27]. 3.3. Dean-Hex
The last geometry considered is a “Dean-Hex” geometry, of same length than the other channels. As a lot of parameters are involved (length between the inlet and the first bend L1, length between two
consecutive bends L2, length after the U-turn L3, length of the first bend
A1, length of the bends A2, length of the U-turn A3),Table 1andFig. 1
propose a detailed view of the geometry and the values of the geometric parameters taken for the study.
4. Numerical method
The hydrodynamics in the three geometries is studied by means of the commercial CFD software ANSYS CFX (V16.2). CFX solves the Navier-Stokes equations that are described afterwards using a finite
Fig. 1. (a) Dean-Hex geometry; (b) Dean-Hex geometry details.
Table 2 Dean-Hex parameters. Geometry Q (mL min−1) u av(m s−1) Re (−) De (−) Coiled tube 8.4–50.5 0.045–0.27 100–600 23–139 Dean-Hex 9.5–57.0 0.050–0.30 100–600 77–461
volume method (vertex-centered scheme) that employs a coupled solver. The equations are discretized using a High Resolution Scheme. The RMS convergence criterion for the residuals is set equal to 10−6,
ensuring highly converged results.
4.1. Mathematical formulation 4.1.1. Navier-Stokes equations
The study was performed exclusively in laminar flow and isothermal conditions. The fluid motion is governed by the Navier-Stokes equa-tions. The fluid considered here is water at temperature T = 25 °C. This fluid is assumed incompressible (ρ = 997 kg m−3) and Newtonian
(μ = 8.899 × 10⁻⁴Pa s).
Under these assumptions, the steady-state conservation equations for mass and momentum can be expressed as follows (Eqs.(6)and(7)):
.u=0 (6)
Fig. 3. (a) Influence of δton the shear rate profile; (b)
Influence of NSLon the shear rate profile.
Table 3
Summary of the meshing strategy and sizes for the three geometries.
Geometry Meshing method Nodes Coiled tube Tetrahedral with inflation + sweeping 1559000 Straight pipe Hexahedral with control via bias 1353000 Dean-Hex Hexahedral with control via bias 1380000
. (ρu⊗u)= −pstat+. (µ(u+(u) )T
(7) where pstatis the static pressure, and u is the velocity vector.
It should be noted that the fluid simulated is pure water without coagulating particles. The objective is to compare the hydrodynamic behavior of different channels by observing key characteristics of the flow, such as the shear rate fields, that may influence the coagulation process. The simulations assume that the presence of particles would not change the flow field and therefore not affect the conclusions de-duced from the present comparative study regarding the behavior of the different channel geometries.
4.1.2. Boundary conditions
The inlet velocity profile is assumed to be fully-developed. As the coiled tube has a circular cross-section, the conventional parabolic ex-pression of the velocity profile is used for this geometry. For the straight tube and the Dean-Hex geometry, the cross-section is square. The inlet velocity profile is thus approximated by the expression proposed by Shah and London[28]. The wall are treated as no slip and the outlet gauge pressure is set to 0 Pa. The range of flow rates, average velocities and corresponding Re and De are presented inTable 2.
4.1.3. Lagrangian particle tracking
In order to obtain local information about the flow, Lagrangian particle tracking is performed once the flow simulation is complete. Usually, this technique is used to model two-phase flows. However,
massless particles can also be used to obtain information on the history of fluid elements in moving flows [29,30]. The tracer particles are spherical with a diameter of 1 μm and a density equal to thefluid density. Under these conditions, the particles have a zero Stokes number, and thus perfectly follow streamlines. Furthermore, using this approach there is no interaction between particles, no physical diffu-sion and very little numerical diffudiffu-sion.
For each particle, the following kinematic balance (Eq. (8)) and momentum balance (Eq.(9)) are solved:
= X u d dt p (8) = u F m d dt p p drag (9) where X is the particle location vector and upthe velocity vector. mp
denotes the mass of a tracer particle. The drag force Fdragis modelled
using the Schiller Naumann drag coefficient. The particles are injected uniformly at the inlet of the reactor.
4.2. Mesh
Great care was taken to ensure the independence of the variables of interest on the mesh, i.e. the velocity and the shear rate fields. As the cross-sectional shapes of the coiled tube and the Dean-Hex geometry/ straight tube are different, two mesh independence studies have been done. As the shear rate is the most sensitive parameter studied here,
Fig. 4. Dimensionless velocity and shear rate profiles inside the coiled tube (Re = 400).
only these results are presented here to save space. 4.2.1. Dean-Hex geometry
For square cross-section geometries, the mesh independence study is performed for the Dean-Hex geometry where the flow is more complex and thus more difficult to resolve. The study is conducted at Re = 357. The mesh is hexahedral with a bias applied to the mesh to resolve the flow at the walls to better capture the wall effects. The mesh in-dependence is studied along three lines located where the flow is the most complex: just before, at the center of and immediately after the final bend. The three lines are perpendicular to the flow direction. The initial mesh is as follows: the cross-section is divided into 40 × 40 di-visions (in the channel depth and width directions). Each straight length between two bends is divided into 40 divisions. Finally, in each bend, the curved lines are divided into 20 divisions. The bias factor is taken equal to 4, meaning the mesh size at the center is 4 times that at the wall. The numbers of divisions presented inFig. 2are those of the straight lines; however, those of the curved lines are adjusted pro-portionally.
Fig. 2 clearly demonstrates that the initial mesh considered was precise enough for the study in regards with shear rate. A coarser mesh (black line) clearly displays large differences, especially near the walls, whereas a finer mesh does not change the results significantly. Similar results were obtained on all lines studied.
4.2.2. Coiled tube mesh independence
In order to mesh the coiled tube geometry, a swept tetrahedral mesh is used. The resolution at the walls is then adjusted by implementing a thin inflation layer (0.3 mm). Most of the independence study is per-formed on a line taken through the cross-section, located on the dia-meter of the circle near the outlet. A second line, taken at the center of the tube, is used to confirm the number of divisions used for sweeping the mesh is high enough to ensure mesh independence. The Reynolds number for these tests is 400.
The influence of the size of the tetrahedral elements size δtis shown
inFig. 3a. Whereas δt= 0.3 mm is clearly too large to ensure mesh
independent results, a size of 0.07 mm appears to be a good trade-off: for most of the data extracted, the results between 0.07 mm and 0.02 mm are strictly identical. The only difference observed is near the wall, where the 0.07 mm mesh appears too coarse to accurately capture the wall effect. Indeed, mesh independence in the inflation layer is also required, as shown inFig. 3b.
Concerning the number of inflation layers NSL,Fig. 3b demonstrates
that in this region the difference in shear rate profiles near the walls is small between 3 and 10 layers, and insignificant between 10 and 15. For these reasons, NSL= 10 in the rest of the study.
The previous results are obtained with a number of divisions along the coiled tube equal to 1200. As an increase up to 2000 only resulted in relative differences (below 0.1%) in terms of shear rate and velocity, the number of divisions is thus kept equal to 1200 for the rest of the study.Table 3summarizes the mesh chosen for each geometry in terms of number of nodes.
4.3. Lagrangian particle tracking
The number of particles seeding the flow has to be chosen carefully as a compromise between the simulation time and the statistical sig-nificance of the data extracted has to be reached. In this study, 1000 particles appear to be a good trade-off. It was found that an increase of the number of particles to 3000 and 5000 shows no significant accuracy improvement of the information extracted (residence time distribution, average shear rate per particle, maximum shear rate per particle). 4.4. Validation
The simulations performed here are for steady, laminar flow and
Fig. 5. Velocity tangential projection (plane P3) as a function of Dean number in the coiled tube.
involve no closure models for uncertain phenomena such as turbulence or multiphase interaction forces. Therefore provided the mesh is fine enough, the numerical scheme is accurate and the resulting algebraic equations are properly solved the results are physically correct. The methodology used here has been extensively verified for laminar flow in zig-zag heat exchangers of circular[31]and semi-circular[32]and also validated against experimental data for heat transfer [33] and transition to unsteady chaotic flow[34].
5. Results
Before extracting local data with Lagrangian particle tracking, nu-merical simulations are used to gain a detailed view of the flow in Dean-Hex and coiled tube geometries with regards to the velocity and shear rate fields. All the following results are presented at the same average inlet velocity uav= 0.181 m s−1, corresponding to a flow rate Q equal
to 34 mL min−1.
5.1. Velocity and shear rate fields 5.1.1. Coiled tube
Fig. 4shows contours of velocity and shear rate at four cross-sec-tions (inlet, 1/12 of thefirst coil (P1), 1/4 of the first coil (P2) and half of the first coil (P3)) in the coiled tube for Q = 34 mL min−1, which
corresponds to Re = 400. The velocity fields are presented using a non-dimensional form (und), calculated normalizing the velocity fields
ob-tained with simulation by the average velocity uav. The vectors
corre-spond to the tangential projection of the velocity and allow the visua-lization of the vortices. It can be seen that after plane P2, there is no change in the normalized velocity and the shear rate fields and there-fore the flow can be considered established. In comparison with the inlet profile, the maximum normalized velocity in the other planes is
Fig. 7. Dimensionless velocity profiles inside the Dean-Hex geo-metry (Re = 357): the color scale is related to the dimensionless velocity and the black arrow to the tangential projection of the velocity vector. (For interpretation of the references to color in this figure legend, the reader is referred to the web version of this article.)
shifted towards the outer wall of the tube and is 10% lower than the maximum velocity at the inlet. This deformation of the velocity profile, which is induced by centrifugal forces due to the curvature of the tube, also results in the deformation of the shear rate profile. Comparing with a straight tube, a higher shear rate zone (with G higher than 1000 s−1
and up to 1600 s−1) appears at the outer wall of the coiled tube. As the
coagulation directly depends on shear rate, this information is useful for the considered application: winding the tube will generate vortices – and thus will promote radial mixing – but also higher shear rates than in the straight tube, where shear rates do not exceed 1000 s−1, and will
thus have an impact on coagulation.
Moreover, it can be seen inFig. 5that Dean vortices are also ob-served at low Reynolds numbers. Indeed, in the range studied, the magnitude of the transverse velocity varies however the flow structure does not. Even at low flow rates, we can therefore expect a contribution of these vortices to radial mixing, whereas this mixing is controlled entirely by molecular diffusion in straight channels at these low Re.
5.1.2. Dean-Hex geometry
The locations of the cross-sectional planes where the results are given are presented inFig. 6. These positions have been chosen in order to understand the evolution of the normalized velocity and shear rate profiles before, inside and after a bend, where the centrifugal forces will have a significant impact on the flow.
Figs. 7 and 8present the normalized velocity fields and the shear rate fields, respectively, for a flow rate of Q = 34 mL min−1 which
corresponds to Re = 357. This Re is slightly different than that in the coiled tube since although the cross-sectional areas are identical, the hydraulic diameters are not. Unlike the coiled tube, the zigzag design creates a periodic change in direction of the vortices along the channel. Before the bend, the maximum fluid velocity is shifted towards the inner side of the bend (bottom of the plane P1 inFig. 7), meaning that the effect of the centrifugal force induced by the previous bend is still present. From plane P2, a clear displacement of the high velocity zone from the inner side to the outer side of the bend (from bottom to top) is observed due to the centrifugal effects induced by the current bend.
Fig. 8. Shear rate profiles inside the Dean-Hex geometry. (For interpretation of the references to color in the text, the reader is referred to the web version of this article.)
This motion involves the generation of primary Dean vortices (plane P2) and secondary vortices, which are clearly observed at plane P4. As the fluid flows through the straight length of channel (planes P5–P7), the vortices decrease in strength to increase again at plane P8, where the next bend starts to affect the flow.
The shear rate fields inFig. 8also reveal interesting information. The asymmetry of the velocity field induced by the centrifugal force generates very high shear rates close to the walls (higher than 1800 s−1, up to 3900 s−1) that are significantly higher than the
maxima encountered in the coiled tube (up to 1600 s−1). This is an
important observation since, as mentioned previously, coagulation is highly dependent on average shear rate (Eq.(4)), but it also depends on the time thefluid spends in high shear rate zones. It may be expected
that for larger zones of high shear rate, there is more chance that the fluid spends time in these zones.
Fig. 9shows the velocity vectors in plane P4 for different Reynolds and Dean numbers. Since secondary vortices are induced by centrifugal forces, such structures are not observed at low Dean number, De = 77 and 154 here. However, secondary vortices appear for Re ≥ 300 and De ≥ 230, which is in agreement with the critical values (Re = 270, De = 207) identified in the literature[24]. At De = 461, the flow is no longer symmetrical with respect to the vertical centerline of the channel. This suggests transition towards chaotic flow behavior, which was already observed numerically and experimentally in similar zigzag geometries[34].
The generation of Dean vortices is of significant interest for coa-gulation processes because this type of flow provides transverse mixing, which should lead to narrow residence time distributions and ensure that all particles visit similar levels of shear rate.
5.2. Lagrangian particle tracking
Lagrangian particle tracking is performed to obtain statistical in-formation on the following parameters:
1. Residence time;
2. Average shear rate experienced by each particle; 3. Maximum shear rate experienced by each particle; 4. Camp number for each particle.
All the results (excepted for the Residence time distribution) are presented with bar charts. Each class of the following bar charts in-cludes the lower limit and exin-cludes the higher limit of the interval. Each label represents the value of the lower limit. As an example, the class “50 s−1” inFig. 11includes all weighted particles having an average
shear rate Gav,partso that50 ⩽ Gav part, <100 s−1.
5.2.1. Residence time distribution
The residence time distribution E(t) can be computed as follows
[35,29](Eq.(10)): = E t N N t ( ) ∆ 1 ∆ w w (10)
NWstands for the total number of particles weighted by their velocity at
the inlet of the channel. ΔNWrepresents the weighted number of
par-ticles having a residence time between t and t + Δt. The residence time distributions (RTD) observed in the three geometries are represented in
Fig. 13. The time step (Δt) chosen is 0.1 s, which is a physically realistic sampling time. E(t) is plotted here as a function of the residence time of the particles.
Over the simulated length, the effect of the radial mixing induced by the bends in the Dean-Hex geometry can be clearly observed inFig. 10
andTable 4. The end time presented in Table 4corresponds to the upper limit of the end class, here corresponding to the first class where there are still particles and more than two consecutive empty classes, thus ensuring most particles have been recovered.
We can clearly observe that the RTD in the Dean-Hex geometry is narrower than for the two other geometries, with no particles having a residence time below 0.8 s (0.5 s for the straight tube), an end time much shorter (4.0 s) than for the two other geometries (up to 9.0 s for the straight tube) and a main mode (class 1.1 s) close to the fluid re-sidence time (τ = 1.16 s). All these data thus points out the fact that the Dean-Hex reactor displays a behavior close to a plug flow behavior. As the simulated lengths are fairly low compared with a realistic-sized coagulator, a Péclet number calculation does not seem relevant for this study. However, it could be interesting to corroborate this plug flow behavior with the calculation of a Péclet number using realistic-sized geometry based on the first and the second moments of E(t)[35]. By reducing the temporal flow inhomogeneities, more homogenous
Fig. 9. Velocity tangential projection (plane P4) as a function of Dean number in Dean-Hex.
suspension properties can be expected in this intensified reactor in comparison with the other reactors simulated.
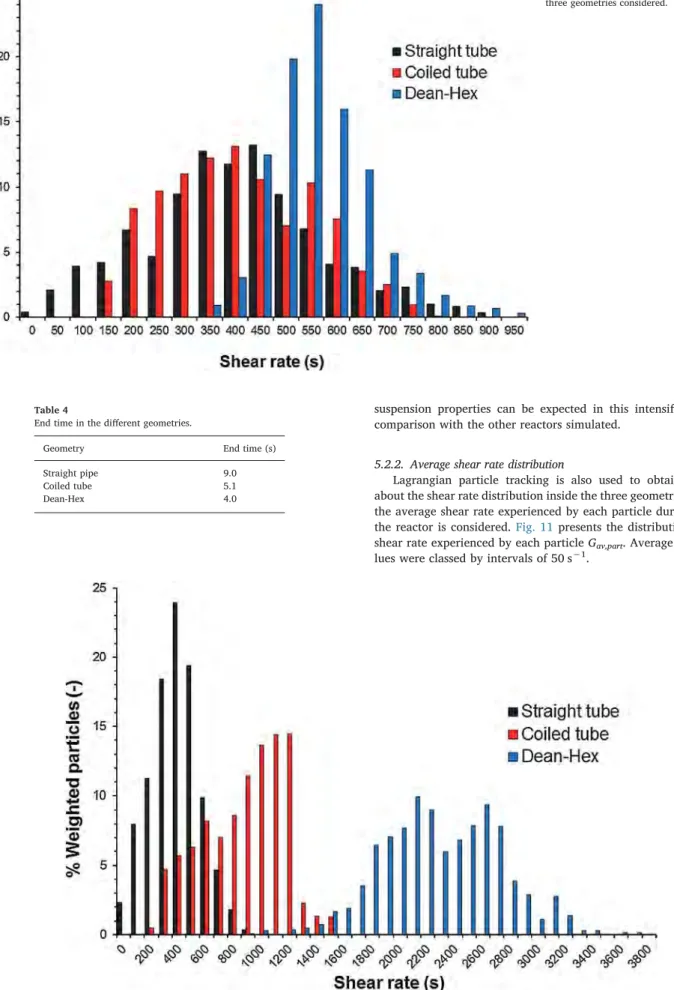
5.2.2. Average shear rate distribution
Lagrangian particle tracking is also used to obtain information about the shear rate distribution inside the three geometries. First of all, the average shear rate experienced by each particle during its time in the reactor is considered.Fig. 11presents the distribution of average shear rate experienced by each particle Gav,part. Average shear rate
va-lues were classed by intervals of 50 s−1.
Fig. 11. Average shear rate distribution for the three geometries considered.
Table 4
End time in the different geometries.
Geometry End time (s) Straight pipe 9.0 Coiled tube 5.1
Dean-Hex 4.0
The Dean-Hex geometry clearly exhibits a narrower shear rate dis-tribution than the other geometries, with no particles until the class 350 s−1, whereas there are a few particles even in the first class for the
straight tube. When comparing the mode of the distribution, we can also notice that the Dean-Hex geometry exhibits the highest mode in intensity (% particles: 24.0), furthermore located in a higher class (550 s−1), compared with the two alternatives (% particles: 13.2 and
class 450 s−1in the case of the straight tube, (% particles: 13.1 and
class 400 s−1 for the coiled geometry). This narrower distribution is
consistent with the results obtained for the residence time distribution. Indeed, the generation of transverse velocities with the primary and secondary Dean vortices means that particles will experience similar velocities and therefore shear rates, leading to a narrower shear rate distribution. It is also worth mentioning that the coiled tube offers a slightly narrower distribution than the straight tube due to the presence of two Dean vortices, as shown previously. It is therefore also fairly good alternative to the straight channel.
As coagulation is directly related to the shear rate experienced by the suspended particles and aggregates, the Dean-Hex geometry is very likely to promote homogenous coagulation by offering a narrower average shear rate distribution, furthermore located towards higher shear rate values.
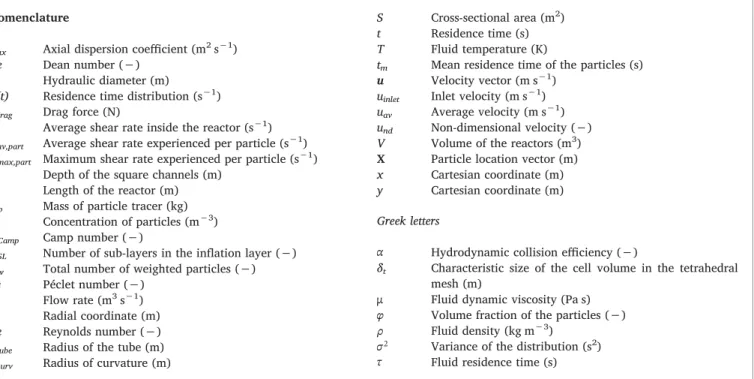
5.2.3. Maximum shear rate
Fig. 12shows the distribution of the maximum shear rate Gmax,part
experienced by each tracer particle. Maximum shear rates are classed in intervals of 100 s−1; this interval size is considered small enough with
respect to the global range of values. It can be seen that the distribu-tions are intrinsically different from one geometry to another, which is expected following the previous data on the flow fields. In the straight tube, the maximum shear rate experienced rarely exceeds 1000 s−1,
whereas in the coiled tube, values up to 1600 s−1are monitored and in
the Dean-Hex geometry, maximum shear rates can reach almost 3800 s−1.
The increase in geometry complexity thus brings not only higher maximum shear rate values, but also a greater spread in the distribu-tion. These extreme values (in comparison with the straight tube) are the direct consequence of the centrifugal effect acting in these geome-tries, causing the generation of transverse vortices that cause high shear rates at the wall near the bends. In the case of the Dean-Hex geometry,
the highest values are however located at very specific locations (just after the bend, and extremely close to the wall): despite the mixing, all the particles are thus very unlikely to reach 3800 s−1. However, the
intensity of the mixing is high enough to bring almost all the particles close to the wall at least once during their passage through the reactor (red zone inFig. 8, where shear rates are higher than 1800 s−1),
ex-plaining such polydispersity in the Dean-Hex geometry.
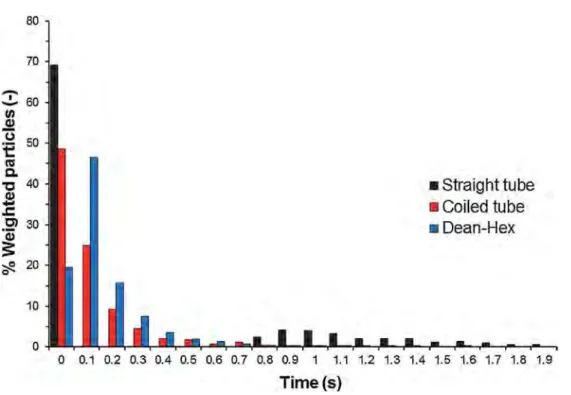
These data are also represented in terms of the maximum time spent by particles in a zone of high shear rate.Fig. 13presents the maximum time spent by different tracer particles in zones with a shear rate greater than 500 s−1.
It can be seen in the straight tube that almost 70% of the tracer particles spend less than 0.1 s in zones with shear rate higher than 500 s−1, whilst the rest of the tracer particles spend between 0.8 and 2 s
in such zones (the fluid residence time is τ = 1.16 s). This is due to the unidirectional laminar flow: the particles at the center of the tube do not visit high shear rates close to the tube walls due to the absence of transverse velocities. This clearly illustrates the limitations of con-sidering a volume averaged shear rate value (505 s−1from the
simu-lations, thus almost equal to the threshold used here) instead of a shear rate distribution. Also, in unidirectional laminar flow profiles the lowest shear rates are associated with the highest speeds and this is very likely to result in highly polydisperse coagulated suspensions.
Fig. 14presents the maximum time spent by tracer particles in zones with shear rates higher than 1000 s−1in the coiled tube and the
Dean-Hex geometry, using a bar chart (Fig. 14a) and a cumulative re-presentation (Fig. 14b). It can be seen inFig. 14a that the maximum times spent by tracer particles in the high shear zones is the Dean-Hex geometry ranges from 0 to 0.8 s, whereas in the coiled tube this range extends up to almost 2 s. The smaller range for the Dean-Hex geometry is due to the transverse velocities which improve radial mixing and allow a narrower residence time distribution. The cumulative re-presentation in Fig. 14b provides additional interesting information that is not apparent in the bar chart. 52% of the tracer particles flowing in the coiled tube do not experience shear rates greater than 1000 s−1,
whereas all the tracer particles in the Dean-Hex geometry do, thereby promoting a more homogenous distribution. These observations are particularly interesting when comparing the time spent in high shear rate zones with an approximate breakage time of aggregates. For ex-ample, if we assume that an aggregate breaks after about 1 s when
Fig. 13. Interval of time spent in shear rate zones higher than or equal to 500 s−1.
exposed to such shear rates, then the time spent in these high shear zones (i.e. less than 0.8 s in the Dean-Hex geometry) is too short and therefore very unlikely to affect the structure of the aggregates. How-ever, if we know that aggregates will break within 0.1 s at shear rates greater than 1000 s−1, then these high shear zones are very likely to
promote breakage of the aggregates and have a large influence on PSD. In this case, assuming that a population of aggregates will rupture after 0.1 s in the high shear zones, we can say that in the Dean-Hex reactor an aggregate has approximately 32% chance of breakage (since 32% of the tracer particles experience these high shear rate zones for at least 0.1 s).
Since the shear rate exposure time required for aggregate breakage will depend on many parameters (e.g. aggregate shape, size, composi-tion, and applied shear rate), it is difficult to provide an absolute time required for breakage. Micromechanical experiments or simulations could however be useful to get an idea of the stress required to break an aggregate and the associated time.
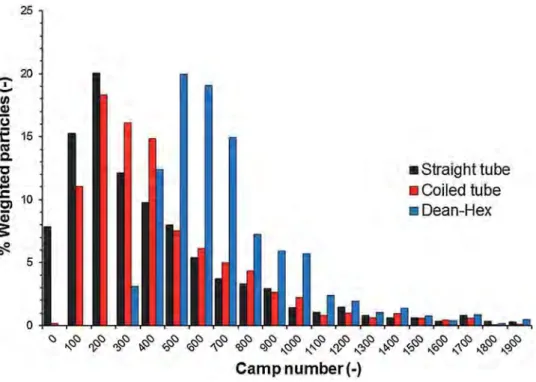
5.2.4. Camp number
As presented earlier, the coagulation rate not only depends on the shear rate experienced by particles and aggregates, but also on the time
spent at specific shear rate levels. Considering Smoluchowski’s ap-proach, the coagulation rate depends entirely on the product Gτ, which is sometimes called the “Camp number” [11]. Although Smo-luchowski’s approach is somewhat limited due to the underlying as-sumptions, it is frequently used to easily quantify coagulation phe-nomena and design coagulation processes through the use of the Camp number.
In order to provide information about the potential performance of the three geometries for coagulation, it is interesting to look at the distribution of the Camp number, NCamp, which is determined using
local values from the tracer particles instead of average fluid values. The data extracted for each tracer particle includes the value of the shear rate experienced as a function of time. At each time step, the shear rate experienced at t and t + Δtiis averaged( )Gi and multiplied
by the time interval(∆ti). It is thus possible to estimate NCampfor each
tracer particle using Eq.(11):
∑
= = NCamp G t∆ i k i i 1 (11)where k is the total number of time steps for the considered particle.
Fig. 15shows the distribution of the Camp number for the three different geometries. The Camp number distribution for the Dean-Hex geometry is narrower than in the other geometries with very high dif-ferences at the lower values: the lowest Camp number values observed for the Dean-Hex are located in the class 300, whereas there are par-ticles in the class 0 for the other geometries. Also, the mode (class 500, %particles = 20.0) is higher than for the other geometries (straight tube: class 200, %particles = 20.1 and coiled tube: class 200, %parti-cles = 18.3). Based on this criterion, it is therefore possible to expect a more homogenous and rapid coagulation in Dean-Hex reactor com-pared with the conventional geometries presented in this study. 6. Conclusions
In this paper, laminar flow generated in three millimetric channel geometries is simulated using CFD and a numerical approach based on Lagrangian particle tracking is presented to better understand the im-pact of the geometry and flow on properties that influence coagulation. The first two geometries (a straight tube and a coiled tube) are
commonly-used geometries due to their simplicity. The third geometry considered is a zigzag design – or Dean Hex geometry – which generates transverse flows due to the alternating bends of the geometry and en-ables process intensification. Lagrangian particle tracking is used to track and record what a fluid element or tracer particle experiences as it moves through the reactor. 1000 particles are tracked in the flow in order to obtain statistics on residence time, average shear rate dis-tribution, maximum shear rate distribution and the Camp number.
The Dean-Hex geometry provides the narrowest RTD of the three geometries. This is due to the generation of alternating Dean vortices, which are transverse flows perpendicular to the main flow. The curved tube provides a narrower RTD than the straight tube, due to the ap-pearance of Dean vortices but that are less effective than the alternating vortices in the Dean-Hex geometry.
Interestingly, the Dean-Hex reactor offers maximum shear rates that are considerably higher than those generated in the other geometries. This has a clear impact on the shear rate distributions, especially on the maximum shear rate distribution, where the highest value is almost three times that observed in the other geometries. The Dean-Hex geo-metry also shows narrower distributions and higher mean values of the average shear rate and the Camp number distribution, thus indicating that more rapid and homogenous coagulation can be expected in this geometry compared with the two alternatives considered.
It is well known that for a high shear stress, aggregates are likely to break after a certain time. The use of the Lagrangian particle tracking approach presented here offers the possibility to obtain an approx-imation of the characteristic time spent by tracer particles at specific shear rates, and therefore an idea of the potential for rupture of ag-gregates in the coagulator if certain critical shear rates are exceeded.
Despite the limitations of the hypotheses made (use of Smoluchowski formula, Newtonian rheology, Lagrangian particles faithfully following fluid motion whereas at some point, real aggregates will not strictly follow these streamlines), this study provides inter-esting information on the benefits of using millimetric channels that create transverse velocities and promote radial mixing. By promoting radial mixing with higher shear rates, one can expect to have a higher degree of coagulation and a narrower PSD, thereby offering a valuable alternative to standard geometries.
Fig. 15. Camp number distribution for the three geometries considered.
and solid-liquid separation, Int. J. Miner. Process. 75 (2005) 237–247. [2] A.T. Owen, P.D. Fawell, J.D. Swift, D.M. Labbett, F.A. Benn, J.B. Farrow, Using
turbulent pipe flow to study the factors affecting polymer-bridging flocculation of mineral systems, Int. J. Miner. Process. 87 (2008) 90–99.
[3] P.T.L. Koh, J.R.G. Andrews, P.H.T. Uhlherr, Flocculation in stired tanks, Chem. Eng. Sci. 39 (1984) 975–985.
[4] J. Gregory, Polymer adsorption and flocculation in sheared suspensions, Colloids Surf. 31 (1988) 231–253.
[5] G.B.J. De Boer, C. De Weerd, D. Thoenes, Coagulation in turbulent flow: part II, Inst. Chem. Eng. Chem. Eng. Res. Des. 67 (1989) 308–315.
[6] G.B.J. De Boer, G.F.M. Hoedemakers, D. Thoenes, Coagulation in turbulent flow: part I, Inst. Chem. Eng. 67 (1989) 301–307.
[7] Y. Li, G. Xu, M. Chen, K. Wang, Slow pelleting coagulation of MBS latex, Chem. Eng. Res. Des. 75 (Part A) (1997).
[8] M. Kobayashi, T. Maekita, Y. Adachi, H. Sasaki, Colloid stability and coagulation rate of polystyrene latex particles in a turbulentflow, Int. J. Miner. Process. 73 (2004) 177–181.
[9] M. Soos, A.S. Moussa, L. Ehrl, J. Sefcik, H. Wu, M. Morbidelli, Effect of shear rate on aggregate size and morphology investigated under turbulent conditions in stirred tank, J. Colloid Interface Sci. 319 (2008) 577–589.
[10] S. Elmaleh, A. Jabbouri, Flocculation energy requirement, Water Res. 25 (1991) 939–943.
[11] J. Gregory, Flocculation in laminar tube flow, Chem. Eng. Sci. 36 (1981) 1789–1794.
[12] K. Higashitani, S. Miyafusa, T. Matsuda, Y. Matsuno, Axial change of total particle concentration in Poiseuille flow, J. Colloid Interface Sci. 77 (1980) 21–28. [13] I.C. Tse, K. Swetland, M.L. Weber-Shirk, L.W. Lion, Fluid shear influences on the
performance of hydraulic flocculation systems, Water Res. 45 (2011) 5412–5418. [14] G.F. Vaezi, R.S. Sanders, J.H. Masliyah, Flocculation kinetics and aggregate struc-ture of kaolinite mixstruc-tures in laminar tube flow, J. Colloid Interface Sci. 355 (2011) 96–105.
[15] H. Odegaard, S. Grutle, H. Ratnaweera, An analysis of floc separation characteristics in chemical wastewater treatment, Chemical Water and Wastewater Treatment II, Springer, 1992, pp. 97–114.
[16] A. Zaccone, M. Soos, M. Lattuada, H. Wu, M.U. Bäbler, M. Morbidelli, Breakup of dense colloidal aggregates under hydrodynamic stresses, Phys. Rev. E 79 (2009). [17] M. Moreau, N. Di Miceli Raimondi, N. Le Sauze, M. Cabassud, C. Gourdon, Pressure
drop and axial dispersion in industrial millistructured heat exchange reactors, Chem. Eng. Process. Process Intensif. 95 (2015) 54–62.
[18]Z. Anxionnaz-Minvielle, M. Cabassud, C. Gourdon, P. Tochon, Influence of the meandering channel geometry on the thermo-hydraulic performances of an in-tensified heat exchanger/reactor, Chem. Eng. Process. Process Intensif. 73 (2013) 67–80.
[19]M. Smoluchowski, Drei vortrage uber diffusion, Brownsche molekularbewegung und koagulation von kolloidteilchen, Phys. Z. Sowjetunion 17 (1916) 557–599. [20]K. Higashitani, R. Ogawa, G. Hosokawa, Y. Matsuno, Kinetic theory of shear
coa-gulation for particles in a viscous fluid, J. Chem. Eng. Jpn. 15 (1982) 299–304. [21]M. Han, D. Lawler, The (relative) insignificance of G in flocculation, J. AWWA 84
(1992) 79–91.
[22]C. Selomulya, G. Bushell, R. Amal, T.D. Waite, Understanding the role of re-structuring in flocculation: the application of a population balance model, Chem. Eng. Sci. 58 (2003) 327–338.
[23]W.R. Dean, Fluid motion in a curved channel, Proc. R. Soc. Math. Phys. Eng. Sci. 121 (1928) 402–420.
[24]H. Fellouah, C. Castelain, A.O.E. Moctar, H. Peerhossaini, A criterion for detection of the onset of dean instability in Newtonian fluids, Eur. J. Mech. – BFluids 25 (2006) 505–531.
[25]F. Théron, Z. Anxionnaz-Minvielle, M. Cabassud, C. Gourdon, P. Tochon, Characterization of the performances of an innovative heat-exchanger/reactor, Chem. Eng. Process. Process Intensif. 82 (2014) 30–41.
[26]N. Di Miceli Raimondi, N. Olivier-Maget, N. Gabas, M. Cabassud, C. Gourdon, Safety enhancement by transposition of the nitration of toluene from semi-batch reactor to continuous intensified heat exchanger reactor, Chem. Eng. Res. Des. 94 (2015) 182–193.
[27]K. Lachin, N. Le Sauze, N. Di Miceli Raimondi, J. Aubin, C. Gourdon, M. Cabassud, Aggregation and breakup of acrylic latex particles inside millimetric scale reactors, Chem. Eng. Process. Process Intensif. 113 (2017) 65–73.
[28]R.K. Shah, A.L. London, Laminar flow forced convection heat transfer and flow friction in straight and curved ducts – a summary of analytical solutions, DTIC Document, (1971).
[29]J. Aubin, L. Prat, C. Xuereb, C. Gourdon, Effect of microchannel aspect ratio on residence time distributions and the axial dispersion coefficient, Chem. Eng. Process. Process Intensif. 48 (2009) 554–559.
[30]A. Mazubert, D.F. Fletcher, M. Poux, J. Aubin, Hydrodynamics and mixing in continuous oscillatory flow reactors—part II: characterisation methods, Chem. Eng. Process. Process Intensif. 102 (2016) 102–116.
[31]P.E. Geyer, D.F. Fletcher, B.S. Haynes, Laminar flow and heat transfer in a periodic trapezoidal channel with semi-circular cross-section, Int. J. Heat Mass Transf. 50 (2007) 3471–3480.
[32]N.R. Rosaguti, D.F. Fletcher, B.S. Haynes, Laminar flow and heat transfer in a periodic serpentine channel, Chem. Eng. Technol. 28 (2005) 353–361. [33]Z. Dai, D.F. Fletcher, B.S. Haynes, Impact of tortuous geometry on laminar flow heat
transfer in microchannels, Int. J. Heat Mass Transf. 83 (2015) 382–398. [34]Z. Dai, Z. Zheng, D.F. Fletcher, B.S. Haynes, Experimental study of transient
be-haviour of laminar flow in zigzag semi-circular microchannels, Exp. Therm. Fluid Sci. 68 (2015) 644–651.
[35]H.S. Fogler, Elements of Chemical Reaction Engineering, 4th ed., Prentice-Hall, Englewoods Cliffs, 1992.
Acknowledgements
This research work was supported by the French National Research Agency (ANR) in the framework of the Scale-Up project (ANR-12-RMNP-0016).
References