HAL Id: hal-01149716
https://hal.archives-ouvertes.fr/hal-01149716
Submitted on 13 May 2015HAL is a multi-disciplinary open access archive for the deposit and dissemination of sci-entific research documents, whether they are pub-lished or not. The documents may come from teaching and research institutions in France or abroad, or from public or private research centers.
L’archive ouverte pluridisciplinaire HAL, est destinée au dépôt et à la diffusion de documents scientifiques de niveau recherche, publiés ou non, émanant des établissements d’enseignement et de recherche français ou étrangers, des laboratoires publics ou privés.
Modeling and Optimization of Laser Polishing Process
Benoit Rosa, Jean-Yves Hascoet, Pascal Mognol
To cite this version:
Benoit Rosa, Jean-Yves Hascoet, Pascal Mognol. Modeling and Optimization of Laser Pol-ishing Process. Applied Mechanics and Materials, Trans Tech Publications, 2014, pp.766-770. �10.4028/www.scientific.net/AMM.575.766�. �hal-01149716�
Modeling and optimization of laser polishing process
Benoit ROSA
1a, Jean-Yves HASCOET
1b, Pascal MOGNOL
1c1 Institut de Recherche en Communications et Cybernétique de Nantes (IRCCyN), UMR CNRS 6597, Nantes, France.
a [email protected], b [email protected], c [email protected]
Keywords: laser polishing, initial topography, experimental design, statistical model.
Abstract. Laser polishing is a finishing process based on melting material, with the objective of
improving surface topography. Some operating parameters must be taken into consideration, such as laser power, feed rate, offset, and overlapping. Moreover, because of its dependence on the primary process, the initial topography has also an impact on the final result. This study describes a quadratic model, conceived to optimize final topography according to the primary process and laser polishing. Based on an experimental matrix, the model takes into account both laser operating parameters and the initial topography, in order to predict polished surfaces and to determine optimal set of parameters. After the phase of experimentation and the creation of the quadratic model, an optimal final topography is introduced, taking into account the initial surface and the laser parameters.
1. Introduction
Finishing operations on mechanical parts is a decisive step in the production chain, regarding the functionality of parts. In the molding field, the finishing process is often practiced manually, which represents up to 30 % of production cost [1]. These high costs are the result of high time processing operations that represent 10 to 30 min/cm² and require highly qualified operators [1,2]. Moreover, the geometrical shape of parts can be modified by un-mastered trajectories and efforts applied to the surface. The accessibility of a complex shape is also restricting [2]. The economical context forces the industrial companies to reduce production costs by automating the processes. In order to improve surface quality and to reduce processing time, some finishing processes were developed like six axis robot mechanical polishing. However, the accessibility of complex surfaces is limited by the abrasive diameter of tools. To improve the accessibility of complex surfaces laser polishing technology appears as notably promising. Used a few years ago to polish diamonds [3,4] or optical lenses [5], the laser polishing technique is now chosen more frequently, especially to polish metals. Thereby decreasing processing time and reaching 10 to 200 s/cm² according to the initial topography. The energy of the laser beam is applied to the surface and the topography peaks are melted. With the surfaces tensions, the molten material flow is reallocated into cavities in order to smooth the initial topography (Fig. 1). The final topography depends on the operating parameters of the laser on the material, and is also linked to the initial topography and the strategy of laser polishing [6,7].
Fig. 1: Principle of laser polishing
Filled valleys Laser
feed rate
Initial topography Melted peaks
2. Problematic
Few studies are focused on the optimization of laser polishing surfaces according to the primary process in context of large and complexes shapes, such as mold surfaces [8-10]. In this context, and to create a multi-processes optimization [11], this study introduces a statistical model of prediction. The surface quality optimization is realized according to primary process and laser polishing in order to decrease the processing time of the whole manufacturing chain. As a result, this study introduces a coupled optimization between the primary process and the laser polishing. The model includes the initial topography, realized with a hemispherical tool, operating parameters of laser and the overlap parameter. The following parameters are used to control the laser:
Laser power (P) [W]
Feed rate of the laser (Vf) [mm/min]
Offset (Of) [mm] which is the shift into laser’s focal point and surface
Overlap (Ov) [%] which means the distance a line overlaps with the last one. This parameter
is specific for the treatment of a complete surface.
The milled surfaces obtained with a hemispherical tool are characterized by scallop height (Hc),
which is a function of the radius of hemispheric milling tool R and the milling step (ae) Eq. (1).
Hc = ae² / 8R. (1)
The final surface is characterized by two parameters:
Surface roughness parameter Sa, which is the arithmetic average heights of the surface [12].
Percent reduction of surface roughness which gives information about surface roughness reduction, using the initial surface roughness [7].
Different initial topographies were studied through the parameter Hc, in order to decrease the time
of the primary process, and optimizing at the same time the reduction percentage of the initial surface roughness according to both processes. The present paper focuses on the modeling and coupled optimization of laser polishing on AISI 316L milled surfaces. The modeling is taking into account the initial topography and the laser operating parameters.
3. Experimental study
3.1. Surfaces polishing tests
A continuous fiber laser was used during the experimentation. The maximum laser power is 12 kW for a 600 µm fiber’s diameter. A welding head High Yag RLSK SWS was positioned on a six axes robot for the experiments. The welding head allows the motion of the laser beam independently of the robot. To protect surfaces from oxidation, argon gas was employed during laser polishing process. This step was performed according to an experimental design based on L16(45) Taguchi
method. This design experiment contains 5 factors and 4 levels. The strategy of surface polishing was perpendicular to the initial topography and the input factors were: the scallop height, the laser power, the feed rate, the offset and the overlap parameter (Table 1). Indeed, to study the homogeneity of surfaces, 21 mm x 28 mm surfaces were employed. Two samples AISI 316L were used, and were divided in 8 areas. Each area is corresponding to one test of the design experiment.
Table 1: factors and levels of design experiment
Levels Hc [µm] Laser Power [W] Feed rate [mm/min] Offset [mm] Overlap [%] 1 40 750 500 0 20 2 50 850 1000 10 30 3 60 950 1500 20 40 4 70 1050 2000 30 50
Choosing this type of design matrix was justified by the number of factors and by the number of levels. In this matrix, it is possible to integrate every factor of the problematic, such as: the characterization factor of the initial topography (Hc), the laser power, the feed rate, the offset and
the overlap. Fewer tests are necessary, and that could have an important effect on industrial application. A number of levels superior to two enables to approach nonlinear systems. The optimal results of this experimental study are a surface roughness reduction of 85 % and a final surface roughness of 2.08 ± 0.1 µm for an initial surface roughness of 13.73 µm. The average surface roughness reduction of the overall trials is 65 %. The efficiency of laser polishing has been highlighted by the smoothing of profile before polishing, and the decrease of the amplitude (Fig. 2).
Fig. 2: Optimal topography profile of the experimental design (85 % of surface roughness reduction)
3.2. Optimization of the final surface
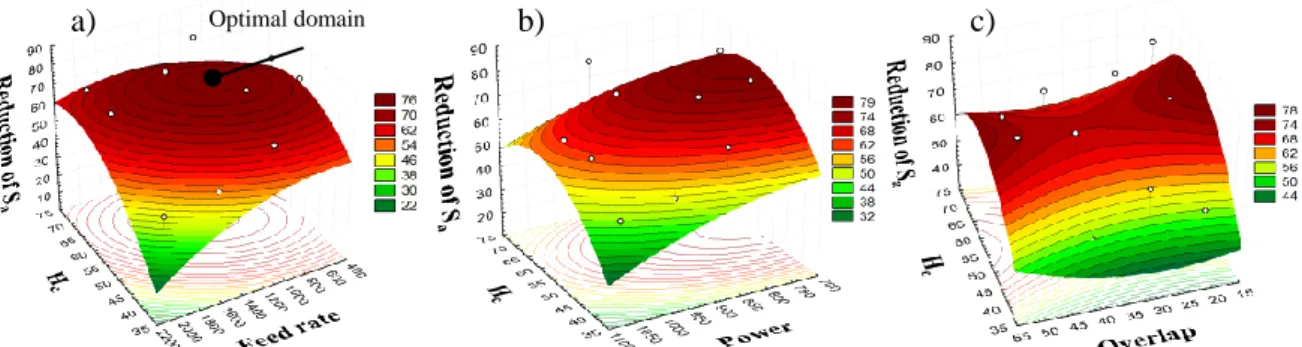
The surface response method was employed in order to optimize the final surface topography according to the initial topography and the laser parameters. Based on quadratic regression between the experimental data and the input parameters, it is possible to determinate the optimum position of the reduction of the surface roughness. The surface responses showed that the optimal domain of feed rate and Hc is in the experimental domain (Fig. 3a). For the laser power and Hc the optimal
domain is also in the experimental domain (Fig. 3b). Finally, regarding the overlap parameter the optimal domain is not in the experimental domain (Fig. 3c). This observation shows a superior value of 50 % improved surface roughness reduction. Moreover, the surfaces responses showed that a scallop height of 60 µm is an optimal value according to the laser parameters.
Fig. 3: Quadratic response surfaces between input parameters and the surface roughness reduction
The next step consisted in studying the increase of the overlap parameters for 60 and 90 % values. These overlap values were applied with an optimal laser parameters determined from surfaces responses (Hc = 60 µm, P = 750 W, Vf = 1000 mm/min, Of = 30 mm). According to these values of
input parameters, the maximum surface reduction was 93 %. According to the standard ISO 4288 a filter with a cut off of 800 µm was used. The final Sa was 0.94 µm ± 0.1 µm for an initial Sa of 13.6
µm. The augmentation of overlap considerably increased the final result. After this optimization, the initial topography was eliminated. This optimal surface smoothing was highlighted by the decrease of the profile amplitudes and the decrease of frequency (Fig. 4).
-30 -20 -10 0 10 20 30 40 50 0,5 0,6 0,7 0,8 0,9 1 1,1 1,2 1,3 1,4 1,5 Am pli tud e (µm ) Length (cm) Initial profile Polished profile a) Optimal domain b) c)
Fig. 4: Topography profiles for different overlap parameters on Y axis (Overlap 30, 60 and 90 %)
4. Modeling
Based on Taguchi design, the statistical model is available to the experimental matrix. As well as a nonlinear system [10], and a number of levels superior to 2, a quadratic model was used Eq. (2).
ymod = b0 + b1.x1 + b2.x2 + … + bk.xk + b11.x1² + b22.x2² + … + bkk.xk². (2)
The input parameters are represented by x1…x²k and the coefficients (monomials) by b0…bkk. The
quadratic regression equation is divided into two parts: a linear part and a quadratic part expressed by squared factors. The number of monomials is a function of the numbers of factors and the number of degrees of regression. After having calculated the coefficients, the quadratic regression model was obtained Eq. (3).
(3)
Roughness reduction of Sa (%) = -166.77768 + 5.44880583*Hc – 0.04559046*Hc² +
0.221260766*Power – 0.1514.10-3*Power² + 0.026068521*Feed rate – 0.12484.10-4*Feed rate² +
0.643237507*Offset – 0.00642640*Offset² - 0.9232599*Overlap + 0.012452807*Overlap².
5. Discussion of results
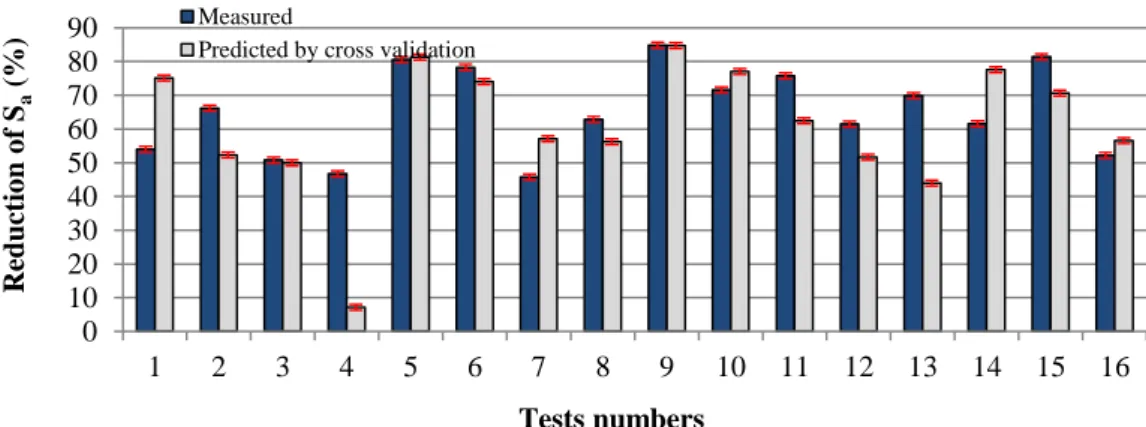
In order to test the predictive capacity of the model, the “leave one out” cross validation method was used. The aim of this methodology is to predict the extracted points of architecture of the model. In other words, this method informs about the comportment of the model between the points used for statistical regression. Thus, a model is calculated for each point. Each model is based on N-1 points and allows the prediction of the extracted point. After calculation of the N-16 points, the average error of the model is 11.5 % (Fig 5). However, three predicted point has an excessive error. The maximum predicted error is 40 % for a minimal error of 0.02 %.
Fig. 5: Measured and predicted values by cross validation methodology -6 -5 -4 -3 -2 -1 0 1 2 3 4 5 6 0,5 0,6 0,7 0,8 0,9 1 1,1 1,2 1,3 1,4 1,5 Am pli tud e (µm ) Length (cm)
Polished profile (Overlap = 30 %) Polished profile (Overlap = 60 %) Polished profile (Overlap = 90 %)
30% 60% 90% 0 10 20 30 40 50 60 70 80 90 1 2 3 4 5 6 7 8 9 10 11 12 13 14 15 16 Reduct io n o f Sa (%) Tests numbers Measured
In order to test the real predictive capacity of statistical model, a validation test was realized during the experimental campaign (Hc = 60 µm; P = 750 W; Vf = 1000 mm/min; Of = 30 mm and Ov = 30
%). The predicted value of the validation test is 87.3 % and the measured value is 84.5 %. The predicting error is 2.8 %.
6. Conclusions
This study focuses on the topography modeling of laser polishing of AISI 316L milled surfaces. The experimental campaign takes into consideration initial topography, laser parameters, overlap parameter and allows the establishment of statistical model. According to these results, more conclusions can be established:
The laser polishing process is effective with regard to surface smoothing.
Thanks to the leave one out cross validation method the predictive capacity of the statistical model is acceptable. The average error is 11.5 %.
The surface responses are a good indicator with regard to the position of the optimum.
The used of experimental matrix enables to obtain an average percentage of roughness reduction of 65 % for a maximum of 85 %.
After optimization, the percentage of surface roughness reduction is 93 %, for a final surface roughness of 0.94 µm ± 0,1 µm and an initial surface roughness of 13.6 µm.
References
[1]: E. Ukar, A. Lamikiz, L. N. López de Lacalle, F. Liebana, J. M. Etayo, and D. del Pozo, “Laser Polishing Operation for Die and Moulds Finishing” Advanced Materials Research, vol. 83–86, pp. 818–825, Dec. 2009.
[2]: C. Nüsser, I. Wehrmann, and E. Willenborg, “Influence of Intensity Distribution and Pulse Duration on Laser Micro Polishing” Physics Procedia, vol. 12, pp. 462–471, Jan. 2011.
[3]: A. Erdemir, M. Halter, G. R. Fenske, A. Krauss, D. M. Gruen, S. M. Pimenov, and V. I. Konov,
“Durability and tribological performance of smooth diamond films produced by Ar-C60 microwave plasmas and by laser polishing,” Surface and Coatings Technology, vol. 94–95, pp. 537–542, Oct. 1997.
[4]: S.Gloor, W. Lüthy, H.P. Weber, S.M. Pimenov, V.G. Ralchenko, V.I. Konov and A.V. Khomich, “UV laser polishing of thick diamond films for IR windows,” Applied Surface Science, Vol. 138-139, pp. 135– 139, Jan. 1999.
[5]: O. Y. Bol’shepaev and N. N. Katomin, “laser polishing of glass articles” Glass and ceramics, vol. 54, pp. 141–142, 1997.
[6]: E. Willenborg, “Polishing with Laser Radiation,” Kunststoffe international, vol. 97, no.6, 2007, pp.
37-39
[7]: A. M. K. Hafiz, E. V. Bordatchev, and R. O. Tutunea-Fatan, “Influence of overlap between the laser beam tracks on surface quality in laser polishing of AISI H13 tool steel,” Journal of Manufacturing
Processes, vol. 14, no. 4, pp. 425–434, Oct. 2012.
[8]: A. Gisario, A. Boschetto, and F. Veniali, “Surface transformation of AISI 304 stainless steel by high power diode laser,” Optics and Lasers in Engineering, vol. 49, no. 1, pp. 41–51, Jan. 2011.
[9]: A Lamikiz, J. Sanchez, L. Lopezdelacalle, and J. Arana, “Laser polishing of parts built up by selective laser sintering,” International Journal of Machine Tools and Manufacture, vol. 47, no. 12–13, pp. 2040– 2050, Oct. 2007.
[10]: E. Ukar, A. Lamikiz, L. N. López de Lacalle, D. del Pozo, and J. L. Arana, “Laser polishing of tool steel with CO2 laser and high-power diode laser,” International Journal of Machine Tools and Manufacture, vol. 50, no. 1, pp. 115–125, Jan. 2010.
[11]: M. Rauch, R. Laguionie, J.H. Hascoet and S.H. Suh, “An advanced STEP-NC controller for intelligent machining processes” Robotics and Computer-Intergrated Manufacturing, vol.28, 375-384. 2012.
[12]: Standard ISO 25178-2, Surface texture: areal. Parts 2: terms, definitions and surface texture parameters. 2012.