Master’s Thesis
Anycast-based DNS in Mobile
Networks
Graduation Studies conducted for obtaining the Master’s degree in
Computer science by Sarah Anne Wassermann
NU advisor: Prof. Fabián E. Bustamante
ULg advisor: Prof. Benoit Donnet
Academic year 2016 – 2017
Contents
1 Introduction 1 2 Anycast 2 2.1 Unicast Paradigm . . . 2 2.2 Anycast Paradigm . . . 2 2.2.1 IP-layer anycast . . . 3 2.2.2 Application-layer anycast . . . 3 2.3 Related Work . . . 42.3.1 Anycast in Content Delivery Networks . . . 4
2.3.2 Anycast in DNS services . . . 5
2.3.3 Anycast for mobile performance improvement . . . 5
2.3.4 Anycast server enumeration . . . 6
3 Cellular Networks 7 3.1 2G Cellular Network Architecture . . . 7
3.2 3G Cellular Network Architecture . . . 7
3.3 4G Cellular Network Architecture . . . 8
3.4 Mobile Internet Performance . . . 9
4 DNS and Anycast 10 4.1 Overview . . . 10
4.2 Architecture . . . 10
4.3 Analysed DNS Services . . . 11
5 Internet Diagnostic tools 13 5.1 Ping . . . 13
5.2 Traceroute . . . 14
6 Mobile Measurement Campaign 16 6.1 ALICE – A Lightweight Interface for Controlled Experiments . . . 16
6.2 Methodology . . . 17
6.3 Dataset Presentation . . . 17
7 Mobile Anycast Performance Analysis 20 7.1 Performance Comparison with Relative Latency Increase . . . 20
7.2 Performance Comparison with Absolute Latency Increase . . . 24
8 Mobile Anycast Distance Analysis 25 8.1 The Out-Of-Country Problem . . . 25
8.2 The Travel Distance Problem . . . 27
8.2.1 Impact on latency . . . 28
8.2.2 Where does the Travel Distance Problem occur? . . . 29
8.3 Why travelling so far? . . . 30
8.3.1 AS-path analysis . . . 30
8.3.2 Cellular anomaly classification . . . 31 2
CONTENTS 3
9 IP Assignment Dynamics 34
9.1 IP Distribution . . . 34 9.2 Impact on Anycast Performance . . . 37
10 Conclusions 39
List of Figures
2.1 Unicast routing scheme. . . 2
2.2 L4 anycast. . . 3
2.3 L7 anycast. . . 4
3.1 Scheme of a 2G network. . . 8
3.2 Architecture of a 3G network. . . 8
3.3 Coverage of the 4G technology in Belgium (courtesy of BIPT). . . 9
4.1 Part of the DNS hierarchy. . . 11
5.1 Ping overview. . . 13
5.2 Traceroute overview. . . 14
6.1 Distribution of experiments among the mobile clients. . . 18
6.2 Experiment distribution for both datasets at the AS level for top 10 ASes in terms of number of launched measurements. . . 18
7.1 Relative latency increases observed for CELL and WIFI. . . 21
7.2 Relative latency increases observed for the three DNS services on cell. . . 21
7.3 Relative latency increases in case anycast is suboptimal – AS level (top 10 ASes in terms of number of launched measurements in cellular networks). . . 21
7.4 Relative latency increases in case anycast is suboptimal – continental level. . . 22
7.5 Absolute latency increases in case anycast is suboptimal in one country per continent. . . 24
8.1 Potential correlation between geographical distance and minimum RTT for cellular measure-ments. . . 25
8.2 Frequency of out-of-country travelling for cellular clients to reach K- and F-Root. . . 27
8.3 Travel distance from clients to the assigned anycast servers. . . 28
8.4 Round-trip time from clients to the assigned anycast servers. . . 29
8.5 Distances between the cellular clients and their assigned anycast servers in top 5 ASes in terms of number of measurements. . . 29
8.6 Geographical distance differences between cellular client → anycast server and client → closest unicast replica in top 5 ASes in terms of number of measurements. . . 30
8.7 Path-length difference on the AS level between the paths client → anycast server and client →closest unicast replica on cell. . . 31
8.8 AS-path lengths observed for both anycast and unicast on cell. . . 31
9.1 Number of different IPs assigned to each client. . . 35
9.2 Correlation between the number of different IPs assigned to each cellular client and the number of IP changes. . . 36
9.3 Number of IP switches on cell. . . 37
9.4 Latency variation scores obtained for the three analysed DNS services on cell. . . 38
List of Tables
4.1 Distribution of the F- and K-Root servers at the continental level (as of August 2016). . . 12
7.1 Statistics concerning relative latency increases in case anycast is suboptimal – country level. . 23
8.1 Location of contacted K-Root anycast replicas for cellular clients. . . 26
8.2 Location of contacted F-Root anycast replicas for cellular clients. . . 27
8.3 Three classes of anycast anomalies encountered by our cellular clients. . . 33
9.1 Prefix/AS/organisation dynamics. . . 36
Abstract
Anycast offers a method for making a service IP address available to a routing system from several locations at once. It is used today to provide important services, such as naming and content delivery, in an economic, scalable, and simple to operate manner. The appeal and clear benefits of anycast to service providers have motivated a number of recent experimental studies on its potential performance impact. All studies have, to the best of our knowledge, focused on wired networks, despite the growing dominance of mobile as the most common and sometimes only form of Internet access. In this thesis, we present the first study of anycast performance for mobile users. In particular, our evaluation focuses on three distinct anycast services: K- and F-Root, each providing part the DNS root zone, and Google DNS.
Our research revolves around three axes. First, we show that mobile clients are frequently routed to sub-optimal replicas in terms of latency and that this issue is not limited to specific regions or ASes of the world. Second, we find that clients are often redirected to a DNS server hosted very far away from her. This happens more frequently while on a cellular connection than on WiFi, with a significant impact on performance. Our study reveals that this is not simply an issue of not having better alternatives, and that the problem is not loc-alised to particular geographic areas or particular ASes. We investigate root causes of this phenomenon and describe three of the major detected classes of anycast anomalies. Third and finally, we explore IP assignment dynamics of mobile clients and find that recurrent IP changes on the client side lead to significant perceived variations of anycast latency.
Acknowledgements
First and foremost, I would like to express my sincere gratitude to my MSc. research advisor, Prof. Fabián Bustamante, for having given me the opportunity to work on this exciting topic and having hosted me in the Aqualab group during summer 2016. Throughout our collaboration, you have motivated me to dive deeper and deeper into our research questions, and your guidance is an invaluable help. I will never forget this enriching experience.
I also would like to thank Dr. John Rula, who was not only a nice lab mate, but also a great mentor during my research stay at Northwestern University. Thanks John for all your work on our measurement campaign and for our discussions about research and the life of a PhD student.
I had the chance to have Prof. Benoit Donnet as a local MSc. advisor. I am not only grateful to him for his guidance in the context of this Master’s thesis, but also because he has been supporting me since my first year at the University of Liège. Most importantly, he helped me organise my first two internships. My research journey would never have been the same without you, thank you.
Even though he was not directly involved in this thesis, I cannot write acknowledgements without men-tioning Dr. Pedro Casas. Since summer 2015, I have been working with Pedro on multiple research projects and I performed two research internships under his supervision. He is also the one who introduced me to Fabián. However, Pedro is not only an exceptional researcher and supervisor, but also a fantastic human be-ing. Thanks to you, I discovered the beauty of research in the field of Internet measurements and got addicted to it. Our collaboration and insightful discussions helped me grow as a human, and overcome some very hard times. Pedro, I am forever grateful for everything you have done for me.
Next, I want to express a special thank you to my mother. Throughout my whole life, you supported me when I was about to give up. During the last five years, you suffered with me when the time for exams had come, and tried to help me whenever you could to make my student life more enjoyable.
Last but not least, I want to thank Thibaut Cuvelier for his unconditional love. Thank you for always believing in me and helping me whenever possible. My conference trips and my last year here in Liège are unforgettable thanks to everything we have experienced together. Finally, this thesis would not be of the same quality without your countless revisions.
Chapter 1
Introduction
Service providers rely on replication to improve service performance and reliability, placing server instances in multiple locations and redirecting clients to nearby copies of the requested data. IP anycast is a common mechanism used for redirecting clients in a variety of domains: from naming (e.g., root servers, top level domains, and many public resolvers) to CDNs and video streaming.
With IP anycast, services advertise a single IP address from many physical locations and clients’ requests are directed, based on BGP routing policies, to a “nearby” replica [1].
From an operator’s perspective, IP anycast offers an economic, scalable, and simple approach to replic-ated services, as BGP routing provides considerable robustness, adapting to changes in service and network availability. From a client’s perspective, however, the mapping can be suboptimal [2], unstable [3, 4], and seemingly chaotic [5, 6], as routing policies have not only technical motivations, but could also be dictated by political or commercial reasons, and routing changes can silently shift traffic from one site to another with a consequent loss of shared state and potential performance impact [7].
Given its wide deployment, criticality, and interesting trade-offs, IP anycast has been the focus of much recent measurement work. All prior studies have, however, focused on wired networks, despite the growing dominance of mobile as the most common form of Internet access.
The number of mobile subscriptions has grown rapidly in just a few years, surpassing 7.4 billion in the first quarter of 2016 [8]. Today, users spend most of their time browsing on their mobile phones, more than on any other device. In the United States and the United Kingdom, for instance, smartphone users spend 2-3x more hours (87 hours in the US and 66 hours in the UK) on their mobile device than on desktop machines (34 hours and 29 hours, respectively) [9]. The impressive growth in mobile devices and usage has led to unprecedented growth in cellular traffic.
In this Master’s thesis, we present the first study of anycast performance for mobile users. In particular, our evaluation focuses on three distinct anycast services: K-Root, F-Root, and Google DNS. F- and K-Root provide part the DNS root zone, unlike Google DNS. We show that mobile clients are routed to suboptimal replicas in terms of latency and geographic distance. Our study reveals that this is not simply an issue of not having better alternatives, and that the problem is not localised to particular geographic areas or particular ASes. We begin to explore the potential root causes of the geographical distance phenomenon in cellular networks and reveal three major classes of anycast anomalies. Additionally, we look at the IP assignment dynamics on mobile networks. We find that cellular clients change their IP address much more frequently than WiFi users. This peculiarity is most probably linked to their greater mobility, and has a significant impact on perceived latency variations for the three anycast services.
This thesis is structured as follows. The Chapters 2 to 5 aim at providing the necessary background to fully understand the research detailed in this document. In particular, these chapters introduce the anycast paradigm (Chapter 2), cellular networks (Section 3), the domain name system (DNS) and its use of anycast (Chapter 4), and finally the currently most used Internet diagnostic tools, ping and traceroute (Chapter 5). Chapters 6 to 9 present our work. Chapter 6 explains our measurement campaign. In Chapter 7, we show that the performance of anycast is often suboptimal in terms of latency (i.e. another replica would provide smaller latency), independently of the considered DNS service. Our findings described in Chapter 8 demonstrate that mobile clients are very often routed to a suboptimal server in terms of geographic distance and we analyse potential root causes. In Chapter 9, we take a look at IP assignment dynamics, i.e. how many different IPs a client gets assigned over time to and how frequently she changes from one IP to another. Chapter 10 concludes this work.
Chapter 2
Anycast
Summary. This thesis focuses on anycast in cellular networks. In this chapter, we first explain in Section 2.1 the unicast scheme, the currently most used one in the Internet. In Section 2.2, we present the anycast paradigm and why it is so attractive for providers. In Section 2.3, we discuss related work.
2.1
Unicast Paradigm
Unicast is the most widely deployed communication scheme. In this context, a transmission only involves one specific receiver and one sender. Each IP is assigned to one machine at a time. This implies that every packet with the same receiver IP is routed to the same machine, independently of the location of the sender. The unicast routing scheme is illustrated in Figure 2.1.
This paradigm might cause performance troubles, as the client may have to contact a server very far from her.
Figure 2.1: Unicast routing scheme.
2.2
Anycast Paradigm
Anycast offers a method for making a service IP address available to a routing system from several locations at once. This means that, contrary to the unicast scheme, several (mostly geographically distributed, but not necessarily) machines, so-called replicas, respond to the same IP address [10]. More precisely, an anycast service uses several sites, i.e. several locations hosting replicas, to provision its clients. We define as catchment of a site the users served by this site [2].
The anycast scheme is popular among multiple services. For instance, LinkedIn, root DNS services, or Content Delivery Networks (CDNs) such as CloudFlare heavily rely on this methodology. The way a user is assigned to a server differs between the different variations of the anycast paradigm, which are explained in Sections 2.2.1 and 2.2.2.
CHAPTER 2. ANYCAST 3
2.2.1
IP-layer anycast
In the context of IP-layer anycast, also called L4 anycast, the server selection depends on BGP. In a nutshell, the same IP address (i.e. the anycast IP address) is advertised across many locations thanks to BGP announcements. The server the client is assigned to is selected based on the best-path notions of BGP, such as shortest AS-path length, Hot Potato criterion, etc. [1]. Figure 2.2 illustrates an example of an IP-layer anycast application.
However, as pointed out in [11], IP-layer anycast faces some challenges. One major issue is that L4 anycast (as well as BGP) does not take into account the dynamics of the network, such as quality changes along the different paths and server load. Moreover, L4 anycast can lead to the interruption of ongoing TCP connections, which then need to be restarted. Obviously, this results in a performance penalty for the affected users.
In this thesis, we focus on this anycast paradigm.
Figure 2.2: L4 anycast. The selection of the server for the client is carried out based on BGP announcements. In this example, AS 3 will choose one of the two anycast servers based on BGP’s best-path notions.
Autonomous System (AS)
An Autonomous System regroups multiple routers, which are thus often under the same administrative control. Each AS is identified by a unique Autonomous System Number (ASN). Popular ASes are for example Google’s AS, AS15169, and the AS managed by Comcast, AS7922.
An AS path corresponds to all the ASes a packet traverses to reach its destination. Border Gateway Protocol (BGP)
BGP [12] is the most used (and most complex) routing protocol in today’s Internet. If the maintainers of an AS decide that it should be reachable from the outside, they need to ensure that the other ASes are aware of its existence. This is where BGP comes into play.
In a nutshell, this protocol works as follows: gateway routers, i.e. routers that lie at the border of a network, send a message to neighbouring gateway routers containing the prefixes hosted within their network. The gateway router receiving the message distributes this information among the routers in this AS, so that the routers can update their routing tables accordingly. The gateway then appends the prefixes included in its own network to the list of received prefixes and advertises the updated list to its own neighbour networks, and so on.
However, these BGP messages also contain the ASes they have already traversed, i.e. an AS path. Before a gateway router distributes the list of prefixes to the routers, it therefore first checks whether its ASN is in the AS path of the message. If so, it has experienced a loop in the routing system and is simply dropped.
2.2.2
Application-layer anycast
Application-layer anycast, also called L7 anycast, heavily relies on DNS redirection and IP unicast. The server-selection procedure is depicted in Figure 2.3. As explained in [11], this scheme works as follows.
First, the user requests a resource, such as a video or a HTML webpage, via its URL. The user agent infers from this URL the hostname, probably belonging to a certain Content Delivery Network. In this case, the
CHAPTER 2. ANYCAST 4 main role is then played by the client’s local DNS resolver and the CDN: once the DNS resolver receives the hostname the user wants to contact, it forwards this hostname to the concerned CDN.
Next, the CDN chooses the node that should serve the client. This can be achieved in several ways [13]. For instance, the CDN simply chooses the geographically closest node to the client. Another approach is to select the closest CDN node in terms of latency with respect to the client, or the closest in terms of number of hops. To this end, CDN servers periodically launch ping or traceroute measurements towards access Internet Service Providers (ISPs), and report the results to the DNS resolvers of the CDN (more details about ping and traceroutecan be found in Chapter 5). The CDN may also return the same IP address, independently of the user. In this case, the IP address is an IP-layer-anycast address (see Section 2.2.1), associated to several (or even all) CDN nodes to balance the load among the different servers. The main issue with these methods is that the client is represented by her DNS resolver, which may be relatively far away from the user and thus does not necessarily represent her very well [14]: the server selection might therefore be suboptimal in terms of performance for the user. Alternatively, this selection can be performed on the client side: a possible technique is that the manifest file of the resource to fetch contains a series of IP addresses and that the client chooses the optimal one based on latency, i.e. by pinging the servers indicated in the manifest file. This solution is implemented by Netflix [13].
As a final step, the DNS resolver forwards the selected IP address to the client.
Figure 2.3: L7 anycast. The client wants to know the IP address mapped to the hostname host.CDN.org. The DNS resolver forwards the request to the CDN to get the IP address of the “best” server for this client.
2.3
Related Work
Anycast plays a central role in computer networks and is thus subject to many research efforts, dealing with different aspects of the paradigm.
2.3.1
Anycast in Content Delivery Networks
A large part of previous work [15, 16, 17, 18, 19, 14, 20, 11] aims at characterising the server deployment of popular services relying on either L7 or L4 anycast.
[18, 19, 15] focus on the characterisation of YouTube’s server infrastructure and the geolocation of these servers [15]. In [18], the authors study the characteristics of the servers seen from both fixed-line and mobile networks. They find that caching significantly enhances the performance in terms of delay and downlink throughput for mobile clients, whereas there is a non-negligible performance variation for fixed-line users. [19] presents the impact of the server-selection strategies employed by YouTube on the Quality of Experience (QoE) of the users.
[16, 20, 17] study the server deployment of Netflix. They find that Netflix heavily relies on Amazon cloud services and on three different CDNs: Akamai, Limelight, and Level-3. Adhikari et al. also reveal that the CDN selection is rather static, i.e. a player sticks to the same CDN, even if another could provide better QoE. [17] additionally sheds light on the location of the different Netflix servers. According to the authors,
approxim-CHAPTER 2. ANYCAST 5 ately 5,000 servers are located in at least 243 different locations across six continents, with a concentration in North America and Europe.
Authors of [14] assess the L7-anycast strategy used in a Akamai’s CDN. They state that most of the clients are located near their local DNS resolvers, which implies that L7 anycast performs well in most cases. However, some DNS resolvers serve clients scattered across a larger geographical region, and the authors show that these clients experience performance issues with L7 anycast. They also present a redirection approach based on EDNS-Client-Subnet (ECS) [21] and achieve significant performance improvements.
[11] analyses the performance implications of L4 anycast in a latency-sensitive CDN. More precisely, they study the Microsoft Bing search service. They find that L4 anycast works fairly well, but that 20% of the clients are redirected to a suboptimal server in terms of performance. In this thesis, we are studying a similar problem.
Alzoubi et al. present in [22, 23] a load-aware CDN architecture, which makes use of route control mech-anisms to take server and network load into account to address the L4-anycast issues explained in Section 2.2.1. Authors of [24] showcase FastRoute, a similar system to [22, 23], but with an emphasis on scale.
2.3.2
Anycast in DNS services
We are not the first ones investigating anycast in DNS. A lot of related work already deals with anycast within DNS services [25, 26, 27, 28, 29, 30, 6, 31]. The main focus of these research efforts are server enumeration [25] and characterisation [25, 26, 27, 28, 29, 6, 31]. When it comes to the analysis of more specific aspects in anycast, we can subdivide prior work in several categories: studies of the proximity between the users and the selected servers [26, 27, 29]; research concerned with user affinity, i.e. how many different anycast servers a client gets directed to over time and how frequently she switches between these servers [27, 28, 29, 31]; work about anycast load distribution[29, 28]; and, lastly, research studying anycast-server availability [29, 31].
In [6], the author concludes that about half of the vantage points (VPs) he uses in the context of his evaluation are served by a suboptimal server of the K-Root DNS infrastructure, both in terms of latency and geographical distance.
While [6, 26] study K-Root, authors of [27, 29, 28, 5] primarily focus on F- and J-Root server character-isation. The authors acknowledge that the use of anycast improves DNS service to clients worldwide. In [5], Bellis et al. describe how they make use of RIPE Atlas to detect and address issues related to F-Root. For in-stance, they notice that packets issued from RIPE Atlas probes in Europe are redirected to a F-Root instance in Atlanta instead of one located in European countries, which they attribute to BGP misconfiguration. Besides F- and J-Root servers, [29] analyses the behaviour of L4 anycast in the Autonomous System (AS) 112, an AS designed for distributing the load across the Internet for a certain type of queries1. It is worth mentioning
that the latter paper carries out the study at a larger scale as opposed to other work, involving about 20,000 vantage points.
The research presented in [30] is motivated by the potential Distributed Denial of Service (DDoS) attack against many of the root DNS servers on November 30 and December 1, 2015 (the traffic directed towards a large number of them was multiplied by a factor 100 with respect to normal load). In this paper, besides analysing data collected during these two days, Moura et al. also evaluate L4 anycast under stress with public data.
2.3.3
Anycast for mobile performance improvement
Nowadays, a significant amount of data traffic is generated by mobile devices. Researchers therefore aim at optimising the performance of the mobile networks. One aspect they are looking at is anycast [32, 33, 34].
In [34], Chen et al. argue that anycast service discovery in Mobile Ad hoc Networks (MANETs) is challen-ging and implies large traffic overhead. They thus propose an anycast scheme which reduces the number of necessary queries.
Similarly, [33] presents MQAR, a Mobility- and Quality of Service-aware Anycast routing scheme in MANETs.
The research in [32] describes an anycast-based server selection model that enables roaming mobile clients to detect and access an anycast server that gives better performance based on the mobile clients’ latest network location. Indeed, mobile IPv6 imposes its users to remain connected to the same server, even if they are
CHAPTER 2. ANYCAST 6 roaming into foreign networks, in which there might be servers that would provide better service to the clients [35].
2.3.4
Anycast server enumeration
Several other pieces of previous work focus on developing techniques for anycast-server enumeration [36, 37, 38] and geolocation based on latency measurements [36, 37].
Schmidt et al. analyse how many anycast sites shall be used to ensure that all the clients experience satisfactory latency [2]. The authors conclude that increasing the number of sites does not solve the suboptimal mapping issues. Indeed, the authors observe that having more sites does not help lower latency, which does not seem intuitive.
In [39], authors conduct the first Internet-wide anycast census and show that major players in the Internet ecosystem are relying on anycast, even though only a small part of the IPv4 space has so far been anycasted. To the best of our knowledge, all studies have so far focused on the performance of anycast in fixed-line networks. In this thesis, we carry out the first analysis of the performance of DNS anycast on mobile – cellular and WiFi – networks. In particular, we mainly focus on the K-Root and F-Root DNS services, but also take a look at Google DNS.
Chapter 3
Cellular Networks
Summary. In this thesis, we explore anycast for DNS mostly in cellular networks. This chapter provides a brief overview of this kind of network. First, we will focus on the architecture of a cellular network by detailing the structure of a 2G network (Section 3.1), before moving on to 3G (Section 3.2) as well as 4G technologies (Section 3.3), both building on the grounds laid by 2G (GSM). Mobile Internet performance is a critical point for smartphone users. Unfortunately, the mobile clients’ experience is often rather unsatisfactory. In Section 3.4, we take a brief look at the factors influencing the performance of the mobile Internet.
3.1
2G Cellular Network Architecture
2G networks were exclusively designed for voice traffic, as data traffic did not play an important role when the first GSM networks appeared. Figure 3.1 depicts the architecture of such a network.
First of all, the geographic region to be covered is subdivided into so-called cells (hence the name of cellular network). Each cell contains a set of mobile clients and a base transceiver station (BTS), which is responsible for transmitting and receiving signals to and from the mobile devices located in the given cell. A major challenge in wireless networks is to increase the coverage of a cell. Indeed, the latter is influenced by numerous factors, among which are the transmission power of the BTS, the buildings in this area, etc.
Second, every 2G network includes base station controllers (BSC) used by multiple BTSes. Indeed, a BSC is responsible for allocating the appropriate BTS channel resources needed by the different mobile clients to communicate. In order to do so, a BSC performs paging, i.e. determines for each client in which cell she is located. Furthermore, a BSC takes care of the handoff of clients, which occurs when they switch to another BTS. The base station controller along with all the base transceiver stations under its control form a base station system(BSS).
Finally, a 2G network includes at least one mobile switching center (MSC). A typical MSC serves approx-imately five BSSes; its main responsibility is user authentication. They also handle handoff between several BSCs or MSCs. Specific MSCs, called gateway MSCs, connect the GSM clients to the larger public telephone network.
3.2
3G Cellular Network Architecture
With the ever growing need to have access to the Internet on the go, 3G made its appearance. In addition to voice traffic, 3G networks explicitly support data traffic. Figure 3.2 shows the scheme of such a network.
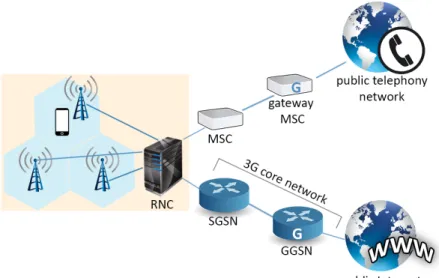
The architecture of a 3G network heavily relies on the 2G network structure: the whole 2G architecture is left untouched; the necessary infrastructure is simply grafted onto the 2G network. More precisely, the 3G part is connected to the initially called BSC, which is referred to as radio network controller (RNC) in the 3G world.
The 3G core network connects the mobile subscribers to the public Internet. To do so, it is composed of serving GPRS support nodes(SGSN) and gateway GPRS support nodes (GGSN). The task of a SGSN is to transmit datagrams to/from mobile clients located in the radio access network the SGSN is assigned to. The GGSN is considered as a gateway and connects multiple SGSNs to the public Internet. As such, the GGSN is the last 3G
CHAPTER 3. CELLULAR NETWORKS 8
Figure 3.1: Scheme of a 2G network.
architecture component a datagram sent by the mobile user encounters before entering the public Internet. It is also worth mentioning that the GGSN appears to the outside world as a normal gateway router and the mobility dynamics of the 3G protagonists are therefore well hidden.
Figure 3.2: Architecture of a 3G network.
3.3
4G Cellular Network Architecture
The aim of the 4G networks was to enhance the performance perceived by the mobile clients (both in terms of latency and throughput).
A 4G network has roughly the same architecture than a 3G one. However, two key points make 4G having a great advantage over 3G networks.
First, 4G does not include a separate circuit-switched network for voice and a packet-switched cellular network for data traffic. Instead, both parts are merged into an IP network, which has as the consequence that both kinds of traffic are transferred using IP datagrams. A very important component of a 4G (LTE) network is
CHAPTER 3. CELLULAR NETWORKS 9 the Packet Gateway (PGW), which is the point of contact with the outside world (similar to the GGSN in a 3G architecture). This new kind of network lead to the development of Voice over Long-Term Evolution (VoLTE), a standard to transfer voice packets over 4G networks.
Second, the 4G radio access network allows the usage of multiple input, multiple output (MIMO) antennas, which makes it possible to significantly increase the data rate for mobile clients (up to 100 Mbps for downloads and 50 Mbps for uploads).
3.4
Mobile Internet Performance
Mobile Internet is known to provide very variable experience in terms of performance to its users. Multiple factors influence the performance perceived by a mobile client.
First of all, it is heavily influenced by the signal strength captured by the users’ phone, as a longer distance between the phone and its assigned Base Transceiver Station and/or physical objects weaken the signal.
Moreover, the performance depends also on the used network technology: while 4G offers a bandwidth of maximum 100 Mbps, the upper limit of 3G is merely 3 Mbps.
In addition to that, usually, neither 3G nor 4G cover the entire surface of a country, which implies that the users have no other choice than to use 3G if 4G is not available at their current location, or even 2G. An interactive map published by the Belgian Institute for Postal services and Telecommunications (BIPT) [40] illustrates the coverage of 2G, 3G, and 4G in Belgium. As an example, Figure 3.3 shows the 4G coverage.
The performance also depends on the device itself. Indeed, some devices simply do not support 4G. The operating system, available RAM, and settings may also prevent the users from experiencing a satisfactory Internet connection.
Chapter 4
DNS and Anycast
Summary. This chapter sheds light on the domain name system (DNS) and its use of anycast. In particular, we explain in Section 4.1 the basic principles behind DNS and why it is so crucial for the Internet to work in a smooth way. In Section 4.2, we detail the distributed architecture of the domain name system. Finally, we provide in Section 4.3 an overview of the three analysed DNS services, namely K-Root DNS, F-Root DNS, and Google DNS.
4.1
Overview
The main task of DNS is to provide name-to-IP mappings.
Each Internet host is identified by an IP address which can be used to contact the given host. How-ever, IP addresses are a rather inconvenient way for users to interact with hosts, as they are not easy to remember. Instead, numerous hosts are assigned so-called hostnames that can be used to reach them. For instance, for accessing the Google search engine, a user prefers to simply type google.com instead of 216.58.213.142. DNS can thus be considered as a huge directory that maps hostnames to their corres-ponding IP addresses.
4.2
Architecture
The architecture used for DNS is rather complex. One possibility would have been to consider one single DNS server storing all the different name-to-IP mappings. However, this would mean a single point of failure and a huge amount of traffic to handle for one single server.
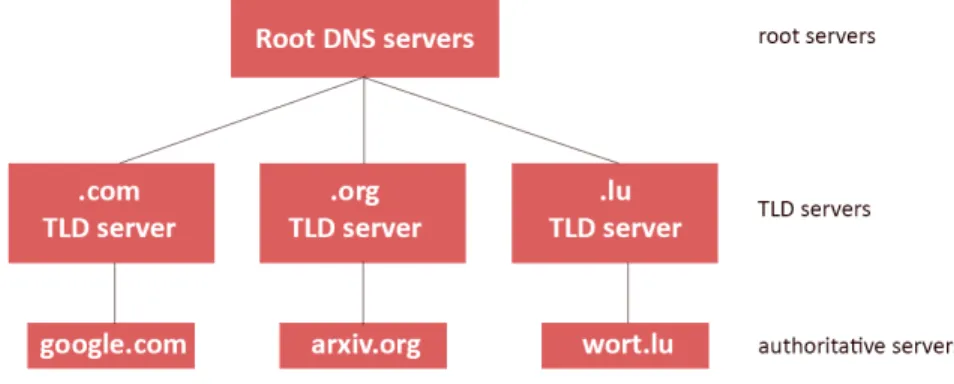
This is why a distributed, hierarchical architecture has been adopted since the early days of the naming system, in 1987 [41]. More precisely, the DNS servers are subdivided into three categories which interact with each other:
• root DNS servers: there are 13 root DNS servers worldwide, labelled A through M, managed by 12 dif-ferent operators having volunteered to host a root server. They make up the so-called root zone. Most of these services use the anycast paradigm to ensure reliability and security. B-Root started to rely on anycast in May 2017, according to a post on the official website of the DNS root servers [42]. On the same website, one can find a map depicting the location of the different servers running the root DNS service. As of May 2017, there are almost 700 root DNS servers distributed around the world, even though 20% of them are hosted in North America. In this thesis, we investigate anycast for two root servers, namely F-Root and K-Root. There is no hierarchy between these 13 root servers: all of them are equally important and behave identically in DNS terms. The only differences are their operators, their names, and their IP addresses [43].
• top-level domain (TLD) DNS servers: this kind of DNS server is responsible for top-level domains such as .org, .com, and .net, as well as for country top-level domains such as .lu, .fr, and .be. The TLD servers must be registered with the root servers so that they know the given TLD servers.
CHAPTER 4. DNS AND ANYCAST 11 • authoritative DNS servers: every organisation with publicly accessible hosts such as Web and mail servers has to provide DNS mappings for them. These DNS records are stored on the organisations’ authoritative servers. To notify their existence, authoritative servers must register with TLD servers with the help of a registrar.
Let’s have a look at an example to understand how a DNS request is processed. Suppose a client needs the DNS mapping for www.google.com. First, the request is sent to one of the root servers, and the contacted server returns the IP address of the appropriate TLD server responsible for the top-level domain .com. To this end, root servers maintain a root zone file [44], which contains the corresponding TLD mappings and can therefore be considered as a DNS “phone book”. Second, the client sends her request to the suggested TLD server, providing her with a list of IP addresses of the authoritative servers for google.com. Third and finally, the user sends her DNS-mapping request to one of the indicated authoritative servers and retrieves one of the IP addresses corresponding to the hostname www.google.com. Figure 4.1 depicts a part of the DNS architecture. This kind of architecture has also the advantage that updates are easier to perform, as every organisation can independently update the DNS entries stored on the corresponding authoritative servers.
This example is a so-called iterative query, as the client issues all the different requests herself. However, a DNS request can also be carried out through recursive queries. In the latter scenario, the DNS servers (instead of the client) contact the different servers of the hierarchy in order to get the requested mapping. The choice between the two operation modes is made by server configuration, as explained by Microsoft [45]. However, still according to Microsoft, recursive queries are usually avoided to prevent denial of service attacks (DoS).
Figure 4.1: Part of the DNS hierarchy.
4.3
Analysed DNS Services
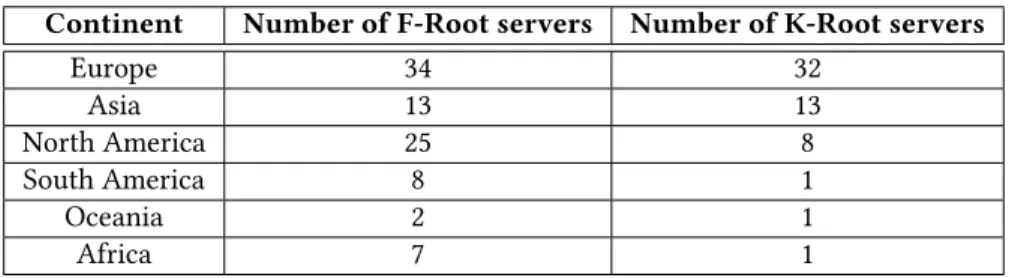
In this work, we investigate the anycast performance of three DNS services: F-Root DNS, K-Root DNS, and Google DNS. We selected these three services since they are both widely replicated services, with publicly available site locations and unicast IP addresses. This information allows to evaluate the performance of anycast routing relative to its “optimal” (in terms of unicast) site location.
The F-Root service is operated by the Internet Systems Consortium (ISC) and supports both IPv4 and IPv6. F-Root DNS includes more than 80 servers scattered across 39 different cities, covering 34 countries.
K-Root is a DNS service operated by the RIPE NCC (Network Coordination Centre). As F-Root, it runs both IPv4 and IPv6, but it is less well distributed. Indeed, K-Root DNS runs only 56 servers, which are distributed across 42 cities situated in 30 countries around the world.
CHAPTER 4. DNS AND ANYCAST 12 Continent Number of F-Root servers Number of K-Root servers
Europe 34 32 Asia 13 13 North America 25 8 South America 8 1 Oceania 2 1 Africa 7 1
Table 4.1: Distribution of the F- and K-Root servers at the continental level (as of August 2016). Google DNS is a DNS resolution service provided by Google (and, contrary to F- and K-Root, not part of the root zone). The Google-DNS servers are scattered across 15 cities in 10 countries. However, they are very unevenly distributed; indeed, more than 40% of them are located in the US!
Chapter 5
Internet Diagnostic tools
Summary. In this chapter, we analyse the two most used Internet diagnostic tools, namely ping (Section 5.1) and traceroute (Section 5.2).
5.1
Ping
Ping[46] is a powerful tool written by Mike Muuss in 1983. Its purposes are twofold: first of all, it checks whether a host is reachable, and, if so, it measures the round-trip time (RTT) for messages sent from the source (i.e. the host on which ping is executed) to the target. To do so, ping relies on the Internet Control Message Protocol (ICMP) [47]: it sends ICMP echo request packets (ping packets) towards the target and waits for an echo reply(pong packets). This waiting time is then considered as the RTT. If the waiting time is higher than a given threshold, ping considers the target as unreachable. Moreover, ping provides additional information such as packet loss, the mean RTT, and errors that occurred during its execution. The general working scheme of this tool is depicted in Figure 5.1.
Besides the standard ping, there exist two variations of this diagnostic tool, relying on the principles of two different transport protocols [48]:
• UDP ping: to check whether a given target is alive, UDP ping sends UDP packets [49]. A target host is considered alive if the source receives an ICMP port unreachable message. Therefore, if possible, the source should send a packet to a port which is supposed to be closed.
• TCP ACK ping: TCP ACK ping works as follows: first of all, it sends a TCP ACK [50] to the target. The target is then reported as being alive if the source receives an RST message from the target. In the study described in this thesis, we use ICMP ping, as it is implemented in the ALICE engine we are relying on for mobile measurements. This platform is presented in more detail in Chapter 6.
Figure 5.1: Ping overview.
CHAPTER 5. INTERNET DIAGNOSTIC TOOLS 14
5.2
Traceroute
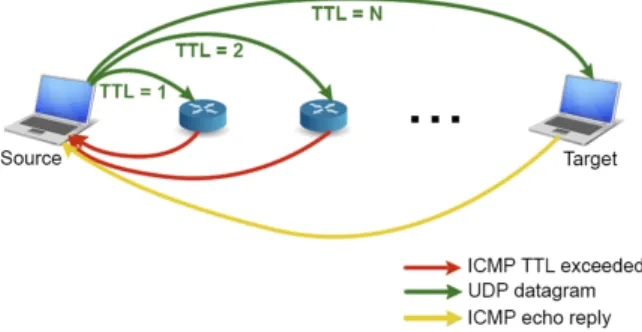
Traceroute[51] is a tool allowing to infer a route from a source to any other target and was designed by Van Jacobson in 1989. Traceroute relies on UDP packets with a likely unused UDP destination port number (i.e. no process is listening on that port) whose destination address is the one of the target. This diagnostic tool makes use of the Time To Live (TTL) field and the IP forwarding mechanism in an ingenious way.
The basic idea behind traceroute is to discover the routers on the path by receiving ICMP time exceeded messages. Traceroute initially sends a UDP packet with a TTL equal to one and iteratively increments this value until the destination has been reached (or the TTL has exceeded a value defined by the user). The general working scheme of traceroute is depicted in Figure 5.2.
In a nutshell, when the Nth packet arrives at the Nth router, this router observes that the TTL has expired. According to forwarding rules of the IP protocol, this router discards the datagram, but sends an ICMP time exceeded message back to the source, which can then use the received packet to extract the IP address of the given router. The TTL of a datagram can thus be considered as its “life bar”: each encountered router decreases it by one and, as soon as it is equal to zero, the packet “dies” (i.e. is not forwarded anymore). This TTL mechanism therefore prevents a cycling packet from wasting too many resources which could be useful for others. We have to point out that not every router sends an ICMP message back to the source. In this case, a timeout will be triggered and this hop will be indicated by a * instead of an IP address. When the target has been reached, the source receives an ICMP port unreachable message instead of a time exceeded message.
In addition, traceroute reports for each hop the RTT. Indeed, a timer is started when a new packet is sent, which allows traceroute to determine the time elapsed between the transmission of the UDP packet and the reception of the time exceeded/port unreachable message.
Figure 5.2: Traceroute overview.
As for ping (Section 5.1), there are two variations of the standard traceroute tool using two different transport protocols:
• ICMP traceroute: instead of sending UDP packets, ICMP traceroute is based on ICMP echo request messages. The target sends back an ICMP echo reply message when this tool is used. ALICE implements this version of traceroute.
• TCP traceroute: the disadvantage of ICMP and UDP traceroute is that firewalls and routers often block the ICMP protocol completely or disallow the ICMP echo requests (ping requests), and/or block various UDP ports. However, they rarely drop TCP packets on port 80 as this is the HTTP port. TCP traceroute sends TCP SYN packets, and the target responds with an RST packet if the port is closed and with a SYN/ACK packet otherwise.
The three variants of traceroute do not only distinguish themselves by the protocols they are relying on, but also by the information they can provide to their user. In their paper [52], Luckie et al. note that there are significant differences between the IP paths inferred by the three methodologies. Moreover, they observe that the three variants of traceroute are not on par when it comes to the discovery of IP links.
More precisely, the authors find that UDP traceroute infers the most unique links with respect to ICMPand TCP traceroute. Their results indeed suggest that the paths discovered by the ICMP and TCP methodologies are often the same. Concerning the number of discovered links, Luckie et al. observe that TCP traceroutederives by far the fewest links, that the UDP variant discovers the most links, but that ICMP
CHAPTER 5. INTERNET DIAGNOSTIC TOOLS 15 tracerouteinfers the most links that are not seen by any other method and reaches the most destinations. However, UDP traceroute does not really discover more links on the AS level, which suggests that the UDP variant provides more visibility on the intra-AS topology.
The authors assume that these differences are due to the fact that some routers use different forwarding policies depending on the transport protocol.
Chapter 6
Mobile Measurement Campaign
Summary. In this chapter, we present our measurement campaign. In particular, we introduce the mobile experiment engine ALICE we rely on in the context of this work (Section 6.1), the methodology we use to set up our measurements (Section 6.2), and provide an in-depth analysis of our dataset (Section 6.3).
6.1
ALICE – A Lightweight Interface for Controlled Experiments
In the context of our study, we launched and collected measurements from geographically distributed mobile vantage points through the ALICE engine [53, 54]. The characteristics making ALICE so appealing to use are the fact that it is designed as an Android library, which implies that it can be easily incorporated into existing applications, and the fact that it takes into account the resources of the mobile devices. More precisely, ALICE attempts to parallelise the requested measurements in order to minimise power consumption. Moreover, it imposes an upper limit to the network resources used by the experiments, so that the application does not use too much of the user’s monthly data volume. As of December 2016, the ALICE engine has been run on over 2,100 unique mobile devices. Moreover, it has been integrated in three Android applications, namely NU Signals [55], Application Time [56], and Namehelp Mobile [57].
The current version of ALICE allows the user to launch the following types of active measurements and to gather useful information. The available active measurement probes are:
• DNS • HTTP GET • Ping • Traceroute
• NDT (Network Diagnosis Tool – a network performance testing suite) • IPerf (a bandwidth testing tool)
The user can retrieve the following information about the mobile device serving as a vantage point: • the unique device identifier
• available sensors
• active and available network interfaces (3G, 4G, WiFi) • traffic statistics (bytes sent/received by each application)
• the mobile client’s anonymised current location (latitude/longitude coordinates) • cellular signal strength
• available WiFi access points
CHAPTER 6. MOBILE MEASUREMENT CAMPAIGN 17 ALICE operates both on the mobile client’s device as well as on a centralised cloud service. The cloud service is responsible for distributing the experiment scripts to the concerned clients and makes sure that the requested measurements fit the capabilities of the mobile device. On the client side, ALICE schedules the measurements to be performed, executes the code, and retrieves the data.
6.2
Methodology
In the context of this study, geographically distributed mobile clients launch active measurements, more pre-cisely ping and traceroute measurements, towards several unicast IPs and the corresponding anycast IPs of the three analysed DNS services to investigate whether the given clients get redirected to the optimal server in terms of latency and geographic distance.
Before launching any measurement, we preprocess the list of servers run by the concerned DNS services: for each service and each city hosting at least one server running the given service, we only keep one replica, as we assume that one server is representative for one city, and that measurements towards multiple servers in the same city would yield very similar results. In order to not overload the clients, we do not issue measurements towards each server of the three services. Instead, we choose for each client the five closest servers in terms of geographic distance. In the end, each client therefore issues 18 ping and traceroute measurements: towards five unicast IPs for each of the three services, and towards the corresponding anycast IPs. We refer to this set of measurements as experiments. The measurements are launched approximately once per hour.
We now clarify how we compute the geographic distance between a mobile client and a server. First, we determine the AS the client is hosted in thanks to her IP address. Whois data allows us to gather information about this AS. More precisely, we are interested in the country the AS is located in. In [58], Balakrishnan et al. argue that cell phone IP addresses are a very unreliable indicator for geographical locations. However, their accuracy is still reasonable at the country level. Finally, this information allows us to compute the geographic coordinates of the client: the ones representing the country her AS is hosted in. The approximate (latitude, longitude) coordinates of the unicast servers are known thanks to the airport situated in the city. After having computed the coordinates of both the client and the server, we calculate the distance between both using the classic Vincenty’s formulae [59].
6.3
Dataset Presentation
We collected our data from September 2016 until April 2017, using the ALICE engine described in Section 6.1 and the methodology presented in Section 6. The analysis focuses on three major DNS services, namely F-Root, K-Root, and Google DNS. The data used for our study was retrieved from mobile devices while clients were connected to either WiFi or cellular networks. Our dataset can thus be divided into two sets: on the one hand, the set containing experiments launched from cellular networks (CELL); on the other hand, the set including the experiments issued from WiFi (WIFI). As measurements are collected opportunistically, based on connection availability and resource usage, the number of experiments launched over each connection type is not the same.
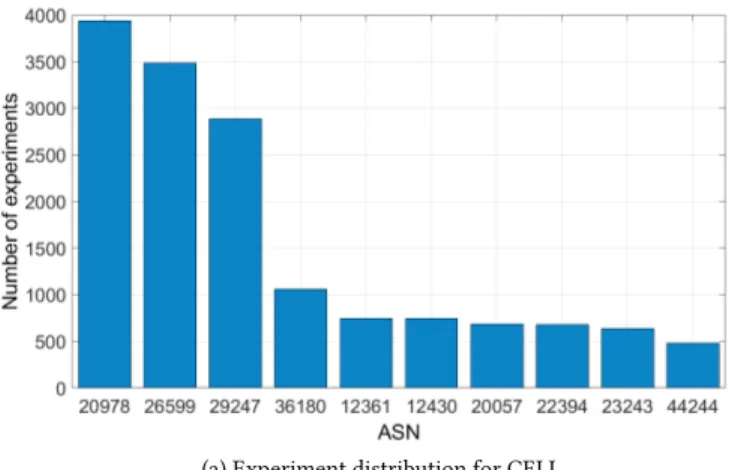
CELL Dataset CELL includes more than 20,000 experiments performed on cellular networks, issued from 151 different clients. Our cellular users are scattered across nearly 40 different countries, about 70% of the clients being located in the United States, Greece, Brazil, and France. Furthermore, the analysed clients are hosted in major ASes, such as AS 29247 (COSMOTE, Greece), AS 26599 (Vivo, Brazil), and AS 22394 (Verizon Wireless, United States). The experiments were launched using different network technologies: 91% were launched on 4G network, while 9% were issued with 3G.
WIFI Dataset WIFI encompasses thrice as many experiments than CELL, launched from 251 clients. The measurements were issued from nearly 50 different countries around the world. As for the CELL dataset, 70% of the WiFi clients are located in Greece and the United States. The most active clients (i.e. the ones having launched the most experiments) are hosted in ASes such as AS 6799 (Otenet, Greece), AS 9121 (TTNet, Turkey), and AS 7922 (Comcast, United States).
125 mobile users launched experiments from both cellular and WiFi networks.
The performed experiments are very unevenly distributed among the different clients. Figure 6.1 depicts this distribution. We can see that, for both cellular and WiFi, more than 90% of the clients have launched less than 500 experiments during the analysed seven months, i.e. less than three experiments per day on average.
CHAPTER 6. MOBILE MEASUREMENT CAMPAIGN 18 One point which is worth mentioning is that a dataset involving cellular users is very difficult to gather. Indeed, a major drawback of active measurements is that they generate traffic on the client side. However, the clients’ monthly data allowance is often rather limited and a lot of mobile users therefore do not want to dedicate a part of their data volume to this kind of study. We believe that, with these constraints, this amount of measurements is already a very good starting point.
Figure 6.1: Distribution of experiments among the mobile clients.
Even though cellular clients issued experiments from 59 different ASes scattered around the world, only 19 of them present more than 100 experiments. We note the same for WIFI: 182 ASes are represented in this dataset, but the dataset includes less than 100 experiments for 139 of them. Figure 6.2 depicts the distribution of experiments among ASes for CELL (Figure 6.2a) and WIFI (Figure 6.2b). We observe that the different ASes cover several regions over the world: the top 10 ASes for CELL are located in countries such as Turkey, Brazil, Guatemala, Iran, the United States, and Greece, while the top 10 for WIFI sees the appearance of Slovakia, Cyprus, and Iraq.
(a) Experiment distribution for CELL.
Figure 6.2: Experiment distribution for both datasets at the AS level for top 10 ASes in terms of number of launched measurements.
CHAPTER 6. MOBILE MEASUREMENT CAMPAIGN 19
(b) Experiment distribution for WIFI.
Figure 6.2: Experiment distribution for both datasets at the AS level for top 10 ASes in terms of number of launched measurements.
Chapter 7
Mobile Anycast Performance Analysis
Summary. In this chapter, we present our study of anycast performance in terms of latency with respect to unicast in two different ways. To this end, we introduce two metrics: the relative latency increase (Section 7.1), and the absolute latency increase (Section 7.2).
7.1
Performance Comparison with Relative Latency Increase
The first part of our DNS anycast study consists in assessing its performance in terms of percentages by comparing the RTTs towards the anycast servers and the corresponding five unicast replicas. To do so, we use the following formula, defined as relative latency increase:
relative latency increase = (RTTanycast− RTToptimal) × 100
RTToptimal
where RTTanycastrefers to the RTT towards the examined anycast server and RTToptimaldenotes the smallest
observed RTT among the six ping measurements. Multiplying the fraction by 100 ensures that this increase is expressed in percentages. A relative latency increase of zero means that anycast is optimal in terms of latency; in other words, negative values cannot occur. Our metric is similar to the relative error, a metric very frequently used in the field of machine learning.
Figure 7.1 shows the relative latency increases we obtained for both CELL and WIFI. We can see that anycast performs well in about 60% of the measurements of our two datasets, i.e. anycast provides optimal latency with respect to the geographically closest unicast replicas. However, for the remaining 40%, anycast is suboptimal and the relative latency increase higher than 100% in approximately 10% of the carried out measurements.
We now investigate the performance of anycast for each of the three DNS services separately on cellular networks. The corresponding latency increases are presented in Figure 7.2. It demonstrates that all of the three services are confronted with anycast performance issues. Nevertheless, we can clearly note that the performance of anycast seems to be the worst for K-Root: while the latency towards the anycast server is optimal in about 70% of the measurements for F-Root and Google DNS, this is the case for less than 40% when it comes to K-Root.
CHAPTER 7. MOBILE ANYCAST PERFORMANCE ANALYSIS 21
Figure 7.1: Relative latency increases observed for
CELL and WIFI. Figure 7.2: Relative latency increases observed forthe three DNS services on cell. Next, we analyse whether this performance problem occurs only in specific regions or if it happens to be more general. Figures 7.4a to 7.4f depict the relative latency increases obtained by cellular clients in each encountered country in case anycast is suboptimal. The six figures show that there is no particular pattern at the continental level. Nevertheless, several points are worth mentioning. In Europe (Figure 7.4a), 7 out of 13 countries present relative latency increases of at least 200%, while anycast performs reasonably well in the five remaining ones. We observe the same kind of behaviour for anycast in Asia (Figure 7.4b). In North America (Figure 7.4c), the performance of the anycast paradigm with respect to unicast is rather poor: for all of the examined countries, the relative latency increase exceeds 1000%! The three remaining continents, i.e. South America (Figure 7.4d), Oceania (Figure 7.4e), and Africa (Figure 7.4f), are unfortunately not very well covered by our CELL dataset. Nevertheless, we see that the relative latency increases provided by Australian cellular clients are relatively low, with the maximum being less than 300%. Our measurements suggest that anycast performs surprisingly well in Africa, but the number of measurements for this region is extremely low. Table 7.1 summarises additional statistics we gathered about the relative latency increases in case the performance of anycast was suboptimal, and underlines the heterogeneous behaviour of this paradigm across the encountered countries.
Additionally, we analyse the relative latency increases observed in the top 10 ASes in terms of number of launched measurements on cellular networks (the list of these ASes as well as the corresponding number of measurements can be found in Chapter 6). The obtained relative latency increases are plotted in Figure 7.3. As for the regional analysis, we cannot infer from our results that anycast performance in some ASes is significantly different than the one in other ones. Of course, we do note some differences, but, in our opinion, they are not striking enough to conclude that suboptimal anycast performance is an AS-specific problem.
Figure 7.3: Relative latency increases in case anycast is suboptimal – AS level (top 10 ASes in terms of number of launched measurements in cellular networks).
CHAPTER 7. MOBILE ANYCAST PERFORMANCE ANALYSIS 22
(a) Relative latency increases in Europe. (b) Relative latency increases in Asia.
(c) Relative latency increases in North America. (d) Relative latency increases in South America.
(e) Relative latency increases in Oceania. (f) Relative latency increases in Africa.
CHAPTER 7. MOBILE ANYCAST PERFORMANCE ANALYSIS 23 Continent Countr y % any cast sub optimal total # measur ements Mean Me dian Standar d de viation 10% p er centile 25% p er centile 75% p er centile 90% p er centile Eur op e Belgium 50% 12 115.0% 157.0% 74.3% 10.6% 48.1% 170.4% 177.6% France 39.1% 422 422.8% 2.6% 3793.3% 0.5% 1.1% 5.6% 31.6% Bulgaria 42.2% 45 20.1% 13.3% 17.6% 1.6% 7.4% 32.2% 41.9% Germany 2.6% 1288 202.2% 30.2% 366.0% 11.7% 17.2% 218.0% 515.0% Portugal 33.3% 18 6.8% 2.4% 10.0% 0.6% 1.1% 5.1% 17.4% Poland 66.7% 3 17.0% 17.0% 7.9% 10.6% 13.0% 21.0% 23.4% Gr ee ce 33.3% 11,996 75.1% 7.7% 418.5% 0.9% 2.7% 31.0% 107.6% Italy 80.7% 57 45.3% 27.3% 39.5% 1.9% 13.6% 83.2% 104.7% Cze ch Republic 58.1% 93 72.8% 22.4% 142.5% 2.4% 4.7% 57.4% 174.4% A ustria 0.9% 847 419.6% 62.7% 710.0% 11.3% 19.6% 450.3% 1047.7% Spain 37.7% 2220 60.4% 62.0% 26.7% 23.2% 48.4% 73.2% 90.4% Slo vakia 53.8% 169 260.9% 38.4% 939.2% 11.4% 27.2% 328.1% 387.1% Unite d Kingdom 21.8% 284 43.8% 8.4% 115.7% 1.4% 4.1% 12.3% 104.8% A sia China 50% 108 41.6% 13.9% 50.2% 6.6% 10.0% 55.2% 117.9% Turke y 91.8% 942 59.7% 67.2% 44.6% 6.2% 16.9% 89.1% 104.4% Thailand 11.9% 118 18.2% 14.4% 14.0% 6.7% 7.6% 18.2% 42.7% Philippines 55.3% 85 263.5% 95.0% 885.7% 3.6% 9.0% 124.1% 341.6% Afghanistan 82.4% 17 27.7% 11.9% 26.6% 5.7% 6.0% 38.2% 67.8% Iran 57.0% 1443 34.9% 9.6%% 82.5% 2.2% 4.6% 28.2% 66.6% Vietnam 56.1% 66 51.6% 17.9% 86.8% 4.8% 8.1% 32.1% 207.1% Singap or e 77.1% 1042 274.6% 89.1% 352.0% 11.7% 30.7% 292.6% 861.8% Kor ea 74.1% 27 11.9% 9.5% 8.5% 3.1% 5.7% 17.9% 23.7% Malaysia 8.2% 134 148.5% 62.1% 211.8% 9.8% 52.6% 122.7% 299.0% North America Dominican Republic 2.9% 588 434.8% 113.8% 576.0% 8.3% 15.6% 1005.3% 1477.1% Guatemala 53% 1732 87.2% 40.4% 337.8% 3.3% 10.2% 91.7% 120.0% Canada 36.4% 1332 45.6% 43.4% 37.1% 20.2% 32.7% 52.9% 61.6% Unite d States 56.0% 7852 90.4% 64.1% 280.6% 11.8% 25.7% 105.2% 146.4% Me xico 54.1% 135 175.4% 34.6% 533.4% 3.0% 7.3% 53.6% 139.5% South America Brazil 52.7% 10,773 116.5% 89.0% 254.9% 21.1% 34.1% 151.7% 194.5% Colombia 50% 4 57.4% 57.4% 20.0% 41.4% 47.4% 67.5% 73.5% A ustralia Ne w Cale donia 0.8% 1334 63.4% 50.3% 43.4% 15.4% 31.2% 89.0% 107.3% A ustralia 37.8% 82 129.3% 171.8% 95.0% 4.3% 21.0% 212.6% 230.1% Africa Kenya 33.3% 15 21.9% 26.7% 13.6% 5.2% 12.6% 31.9% 35.5% Table 7.1: Statistics concerning relativ e latency incr eases in case any cast is sub optimal – countr y le vel.
CHAPTER 7. MOBILE ANYCAST PERFORMANCE ANALYSIS 24
7.2
Performance Comparison with Absolute Latency Increase
The relative latency increase metric has a disadvantage. Indeed, it does not reveal any information about the perceived anycast latency: for instance, a relative latency increase of 100% is obtained when the anycast latency is 4 ms and the optimal unicast latency is equal to 2 ms (4−2
2 × 100 = 100%). However, our metric has
the same value when the anycast latency is equal to 200 ms and the optimal unicast one to 100 ms. In the first case, anycast is indeed suboptimal, but the impact on latency is relatively negligible for the mobile clients.
Therefore, we now introduce the absolute latency increase metric, simply defined as: absolute latency increase = RTTanycast− RTToptimal
where, as for the relative latency increase, RTTanycastrefers to the RTT towards the examined anycast server
and RTToptimaldenotes the smallest observed RTT among the six ping measurements; again, this implies
that negative values cannot occur.
We compute the absolute latency increases in case anycast is suboptimal for one country of each continent. More precisely, we choose the country for which we observe the worst relative latency increases. One excep-tion is Europe, for which we select Slovakia instead of Austria, as we have significantly more measurements for this country. Figure 7.5 illustrates our results. Even though most of the absolute latency increases are below 500 ms (which is already a very high value for a RTT!), besides for the Dominican Republic, we observe a high amount of absolute latency increases which are higher or equal to 100 ms. To grasp even better what this means, we can note that a packet theoretically travels at 2/3 of the speed of light (which corresponds to the maximum speed in optical fibre [60]), i.e. at approximately 200,000 kilometres per second – ignoring the processing delay induced by the routers on the path. This means that a mobile client’s probe having yielded an RTT higher or equal to 100 ms might have travelled at least 20,000 kilometres, corresponding to a return trip between San Francisco and Berlin!
Chapter 8
Mobile Anycast Distance Analysis
Summary. In this chapter, we investigate the geographic distances between mobile clients and the DNS rep-licas. In Section 8.1, we present the Out-Of-Country Problem, i.e. the phenomenon that clients’ packets get routed outside their home country in spite of local alternatives. In Section 8.2, we analyse the distances trav-elled by packets in more general terms and observe that the journey of packets is frequently longer than necessary, with a negative impact on latency. We refer to this problem as the Travel Distance Problem. In Section 8.3, we begin to explore the root causes of the encountered problems and find three classes of mobile anycast anomalies.
Remark. We leave out the Google DNS service from the analyses presented in this chapter. The reason for this is that this part of the study heavily relies on geographical locations of replicas and that Google DNS servers are extremely difficult to geolocate. Indeed, nearly all of the servers are geolocated in the US, while we know thanks to official information that a large number of Google DNS servers are hosted in other regions.
8.1
The Out-Of-Country Problem
Our findings presented in Chapter 7 suggest that anycast is suboptimal in terms of latency for a non negligible fraction of measurements. Further investigation shows that mobile clients get often routed towards a subop-timal anycast replica in terms of geographical distance, which negatively impacts the perceived performance. One could argue that the most impacting factor on latency in wireless networks is the signal strength and that geographic distance is not very influential. However, Figure 8.1 clearly shows that high geographical distance is correlated with large latency, underlining that the distance between cellular clients and anycast servers is an important aspect to take into account when it comes to performance optimisation. We observe a similar behaviour for WiFi clients.
Figure 8.1: Potential correlation between geographical distance and minimum RTT for cellular measurements. 25
CHAPTER 8. MOBILE ANYCAST DISTANCE ANALYSIS 26 This leads us to the analysis of the geolocation mapping between mobile clients and anycast replicas. Our initial results show that cellular clients are in general frequently routed towards a replica hosted outside the country they are residing in, despite local alternatives. To characterise distances between clients and anycast replicas, given that anycast IP addresses cannot be geolocated [10], we geolocate the penultimate hop of the traceroutepath connecting the mobile client to the anycast server to estimate its location. Our mobile clients recorded their geographic location, anonymised to a 10 km2 area, through the ALICE engine.
Tables 8.1 and 8.2 summarise the collected statistics for cellular clients. We can point out that the sent packets happen to be redirected to locations lying very far away from their country of origin. For instance, we observe packets from the United States being sent to K-Root replicas in Iran and United Kingdom! We see the same abnormal behaviour for F-Root DNS, for example with cellular users in Germany being routed to the US.
However, we need to be aware that geolocation databases are not 100% reliable [61]. The statistics provided in this thesis might therefore contain some inaccurate information, due to a wrong IP-to-location mapping. In the context of this study, we rely on the IP2Location DB5.LITE database [62].
Client’s country Contacted server’s location Any local replica? Dominican
Republic United States No France France Yes
Bulgaria Bulgaria Yes
Belgium Iran No
Germany United Kingdom
Yes
Brazil United Kingdom, United States,
Germany
No
Turkey Iran, Germany No
Poland Germany Yes
Guatemala United States No
Greece Greece, Germany
Yes
Canada United States, United Kingdom
Yes
Iran Iran, Germany, India, Yes Client’s country Contacted server’s location Any local replica? Czech Republic Czech Republic, Germany Yes
Australia Australia Yes
United
Kingdom United Kingdom Yes Spain United Kingdom, Russia, Latvia Yes Kenya Johannesburg No United States United States, United Kingdom, Iran Yes Slovakia Germany No
Korea United States,
United Kingdom No Singapore Japan, India No
Mexico United States No
CHAPTER 8. MOBILE ANYCAST DISTANCE ANALYSIS 27
(a) K-Root DNS. (b) F-Root DNS.
Figure 8.2: Frequency of out-of-country travelling for cellular clients to reach K- and F-Root. Client’s country Contacted server’s location Any local replica? Dominican
Republic United States No France Netherlands Yes
Bulgaria Netherlands Yes
Belgium Netherlands No
Germany United States, Netherlands
Yes
Brazil Brazil Yes
Turkey United States No
Poland Czech Republic Yes
Guatemala United States,
Canada No Greece United States,
Netherlands, Germany No Client’s country Contacted server’s location Any local replica? Canada Canada, United States Yes
Iran United Arab Emirates, Netherlands
Yes
Czech
Republic Czech Republic Yes Australia Australia,
United States
Yes
Spain Spain Yes
Kenya Netherlands Yes
United States
United States, Singapore
Yes
Slovakia United States No
Korea United States Yes
Singapore United States Yes
Table 8.2: Location of contacted F-Root anycast replicas for cellular clients.
We analyse how frequently this out-of-country phenomenon occurs in the affected countries. Figures 8.2a and 8.2b depict our results. Our evaluation reveals that the packets travel abroad very often: for K-Root, cellular clients in 50% of the concerned countries are systematically redirected abroad, while this is the case for even more than 70% of the concerned countries when looking at F-Root. Moreover, the out-of-country observation occurs in fewer countries for K-Root than for F-Root. A striking fact is that cellular clients residing in the US are routed towards foreign K-Root replicas more than 70% of the time, while this holds for only merely 1% of the measurements when probing F-Root.
8.2
The Travel Distance Problem
The out-of-country analysis detailed in Section 8.1 already gives a good intuition about the journey of the issued packets. However, it could be the case that clients are located at the border of a country and that it would be cheaper in terms of distance to contact a unicast server hosted in the neighbour country instead of
CHAPTER 8. MOBILE ANYCAST DISTANCE ANALYSIS 28 letting their request traverse the whole country to reach a local alternative. This part of the study focuses on the analysis of distances between mobile clients and their assigned anycast DNS servers.
Figure 8.3a presents the travel distance between clients and anycast servers (Dclient→anycast) for K-Root
DNS. We can easily see that there is a significant difference between cell and WiFi: Dclient→anycastis smaller
than 4,000 kilometres for approximately 75% of the experiments carried out on a WiFi network, whereas this holds for merely 50% of the experiments issued from cellular clients. While we can observe the same phe-nomenon for F-Root in Figure 8.3b, the differences are not as significant as for the K-Root service. Moreover, the distances plotted in Figure 8.3 suggest that the mobile clients are in general located closer to F-Root rep-licas than to K-Root ones. This can be explained by the number and geographical distribution of the different servers, presented in Chapter 4.
(a) Distance to K-Root servers. (b) Distance to F-Root servers.
Figure 8.3: Travel distance from clients to the assigned anycast servers.
8.2.1
Impact on latency
As already stated in Section 8.2, the additional distance travelled does impact users’ performance. We evaluate the impact of the geographical distance between the clients and the replicas in terms of latency. The results are depicted in Figure 8.4. As expected, the recorded latencies are higher for the measurements carried out on cellular networks than for the ones performed on WiFi. Again, the difference is more pronounced for K-Root, as we can conclude from Figure 8.4a: 90% of the WiFi experiments yielded a RTT lower than 180 ms, versus only 70% on cell. A comparison of Figures 8.4a and 8.4b shows that the distribution of latencies is similar for K-Root and F-Root on WiFi. However, we obtained worse performance for K-Root compared to F-Root on cellular networks: 80% of the experiments output a RTT lower than 150 ms for F-Root, but less than 65% for K-Root DNS. Note that Cisco considers 150 ms as being the upper delay limit to get an acceptable quality for most voice applications [63].