Comparative analysis of the predictive capacity of breaching models for an
overtopped rockfill dam
B.J. DEWALS FNRS Research Fellow, University of Liège, Belgium
P. ARCHAMBEAU Research Engineer, University of Liège, Belgium
S. ERPICUM Professor Assistant, University of Liège, Belgium
S. DETREMBLEUR Research Engineer, University of Liège, Belgium
M. PIROTTON Professor, University of Liège, Belgium
SUMMARY
The paper covers a brief description and a comprehensive comparative analysis of several state-of-the-art dam breaching models. The study is specifically focused on the applicability and on the predictive capacity of the models for the gradual breaching of an overtopped rockfill dam. A wide range of modelling techniques is reviewed, from process-oriented numerical simulations to empirical models. Comparisons are performed regarding various aspects, such as the applicability of the model without prior calibration or the possibility of coupling the breaching model with a quasi-3D flow solver such as WOLF.
Finally, a sensitivity analysis of the downstream hydrograph to various parameters is conducted and the conclusions drawn are illustrated in the case of a large-scale real application in Belgium.
1 INTRODUCTION
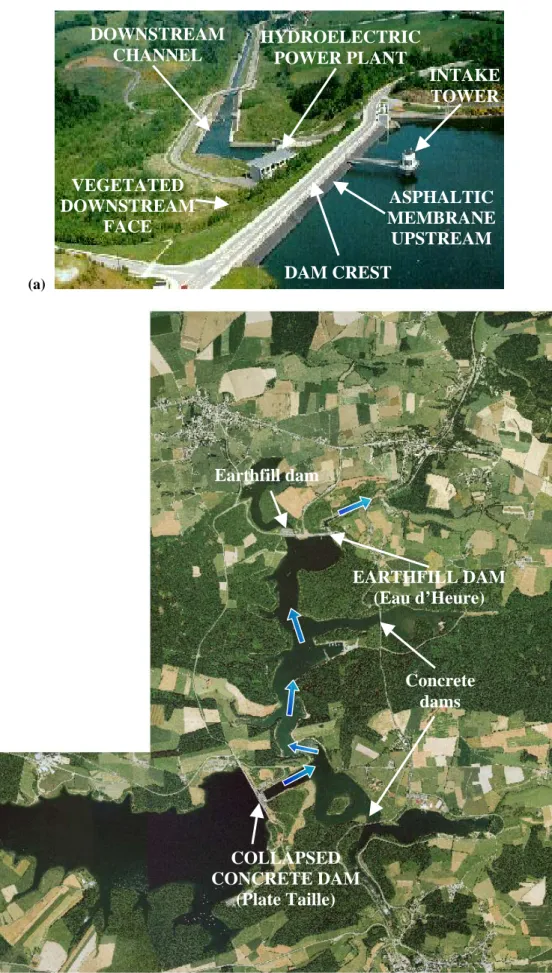
A 20-meter high rockfill embankment dam (Eau d’Heure dam) is located less than five kilometres downstream of the largest Belgian concrete dam (Plate Taille dam), the height of which is 50 m (Figure 1). The overtopping wave over the downstream dam induced by the instantaneous and total collapse of the upstream one has been estimated to be 6 m high by way of a 2D numerical simulation involving over 400,000 computation cells. The question of the behaviour of the rockfill embankment under such a severe solicitation naturally arises. A range of modelling alternatives is reviewed in the following paragraphs, covering complex process-oriented numerical simulations as well as simpler models such as empirical formulae. Besides, comparisons with norms imposed in the regulation of several European and American countries or in national companies are also considered. A comparative discussion identifies the advantages and drawbacks of each modelling tool in terms of applicability for the rockfill embankment dam without prior calibration, particular data requirements as well as the possibility of coupling the breaching model with a quasi-3D flow solver. The most relevant methodology for the case of interest is carefully identified and justified.
Furthermore, a comprehensive sensitivity analysis of the outflow hydrograph with respect to various parameters, such as breach width and formation time, is presented.
(a) DOWNSTREAM CHANNEL HYDROELECTRIC POWER PLANT INTAKE TOWER VEGETATED DOWNSTREAM FACE ASPHALTIC MEMBRANE UPSTREAM DAM CREST (b) Earthfill dam EARTHFILL DAM (Eau d’Heure) COLLAPSED CONCRETE DAM (Plate Taille) Concrete dams
2 CHALLENGE
Predicting the flow induced by dam breaks is always tightly related to the scenario of collapse, the initiation criterion and the duration of the breach formation are assumed. Moreover those questions take still a higher importance in the case of hydraulic structures such as earthfill or rockfill dams. Indeed, analysing the most likely types of failure for those structures leads to the identification of significantly slower and more intricate mechanisms than in the case of concrete dams.
Before 1980, almost no research had been undertaken in a systematic way concerning the failure mechanism of earthfill and rockfill dams. At the beginning of the eighties, indications were given, on the sole basis of observed cases of failures. In the mid-eighties, MacDonald and Langridge-Monopolis (MacDonald and Langridge-Monopolis 1984) and Froelich (Broich 1997; Wahl 1998; Marche 2004) established a correlation between the main breach parameters and observable characteristics of the dam and the reservoir.
In spite of a certain level of predictive capacity, those correlations also demonstrate an extreme variability in the behaviour of embankments undergoing an overtopping. Performing sensitivity analysis is thus essential to assess the reliability of the selected breach parameters. This type of analysis has been carried out and is presented hereafter in § 6.
3 FAILURE CRITERION
While the number of predictive tools available today for modelling the breach formation appears to be limited, there is hardly any predictive model for forecasting the initiation of the breach. Predicting with accuracy where and when the breach will be started remains extremely difficult and the answer depends on the most detailed characteristics of both the structure and the incident overtopping wave.
In the United States, the criterion of initiation of the process of gradual erosion applied by the "National Weather Service" (NWS) corresponds to an overflow of 30 cm to 1.5 m above the dam crest (Marche 2004). In the framework of the present study, the most pessimistic value has been used, namely an overtopping flow 30 cm deep. Moreover, the sensitivity analysis described in § 6 for the specific case of Eau d’Heure dam has allowed to conclude that the change in the released peak discharge remains lower than 1 % if the threshold overtopping depth is varied between 0 cm and 1.5 m. The rising part of the breaching hydrograph is slightly shifted in time.
4 MODELLING TECHNIQUES
Four major families of mathematical and numerical modelling techniques can be listed for either a detailed or a global description of the fluid–structure interaction during the breaching of a rockfill embankment. By order of decreasing complexity, let us cite:
- quasi-3D process-oriented numerical simulations,
- other physically based methods: parametric and (semi-)analytical methods,
- empirical or statistical formulae,
- and the method of analogy.
In addition, the potentiality to perform physical modelling may not be neglected.
4.1 Numerical simulations
Numerical tools able to perform 2D and quasi-3D simulations provide a proper coupling between the hydrodynamic processes, the erosion of the structure as well as the solid
transport. The coupling is also reproduced in a suitable way between the depletion of the upstream reservoir, the highly erosive flow on the structure and the transport of the water-sediments mixture towards downstream. Slope instabilities and bank collapses are also taken into account.
These tools for dam breaching simulations are described as "free evolving breach models" because they are not based on a simplified assumption regarding the geometry of the breach. Though their predictive capacity is reduced in the presence of strongly graded embankment material, non-homogeneous dikes or cohesive sediments they are recognized by far as the most attractive ones on the scientific level. WOLF 2D (Dewals et al. 2002c; Dewals et al. 2002a) is currently counted among the very few models in Europe reported as being able to carry out this type of calculations (Broich 2003).
Very promising, those numerical simulations are getting ever more available for routine applications on large scale real cases as key challenges are taken up, such as a significant reduction in the high CPU time still required today for such a calculation.
In the present case of interest, almost no information is available regarding the properties (such as the grain size distribution) of the material used for the embankment. It appears hence unreliable to provide the transport capacity law included in the model with sufficient data and this modelling alternative may not be identified presently as the most applicable.
4.2 Parametric and (semi-) analytical methods
Though of a lower level of complexity, the analytical and parametric models rely also on a process-oriented calculation of the flow and of the solid transport induced on the structure. These methods are however funded on two main shades of assumptions regarding the shape of the breach and regarding the a priori location of uniform flow zones and of control sections. The fundamental limitation of this modelling technique lies in the hypothetical separation between distinct zones of flow (upstream of the structure, erosion on the structure, propagation downstream) neglecting de facto the potentially strong couplings between those different parts of the flow.
The assumptions on which the analytical methods rely are the most restrictive, but they make it possible to derive a complete analytical solution. The parametric methods, similar to the former ones are slightly more general but they require a numerical resolution involving a time discretization and no space discretization.
The reliability of all those process-oriented methods may be altered depending on the simplifications introduced into the description of the breaching mechanism taken into account. Moreover, similarly as for 2D/3D numerical models a thorough knowledge of the structure and of the embankment material is required since a solid transport capacity law is once more at the basis of the model.
4.3 Empirical or statistical methods
The starting point for elaborating empirical or statistical formulae is a database of recorded historical events of gradual dam breaching. The methodology consists in developing statistical regression formulae by analysing correlations between several parameters, characterizing:
- the dam: shape, grain size and cohesion of material, …
- the hydraulic conditions: the initial head, the volume stored upstream, ...
- the breach: shape, size, side slopes, amount of eroded materials, formation time, …
- the flow induced: volume of water released, peak discharge, …
These simple methods have the unquestionable advantage of a fast and inexpensive implementation, mainly because they generally require only a very global knowledge of the dam site characteristics and no detailed data such as the grain size distribution. On the other
hand, it is important to remain conscious of the limited reliability of the databases available, particularly because of the relatively fragmented and partial documentation accessible for most reported historical cases. One also observes a very variable degree of correlation between the parameters as well as a noticeable dispersion of some data. This fact is obviously explained by the rather rough simplifications introduced in the description of the phenomenon. Although applying these formulae for cases different from those at the basis of their development remains controversial, different simple empirical models exist today and have been elaborated using best up-to-date database of real events.
4.4 Method of analogy
The method of analogy may be considered as a simplified alternative of the predictive rules described in § 4.3. It consists in simply identifying among the reported and documented cases of dam breaching accidents, those presenting characteristics similar to that of interest. Afterwards, the breach geometry and breaching hydrograph can be deduced in a rather straightforward way by an argued comparison.
4.5 Physical modelling
Experimental models prove to be helpful but their quantitative exploitation turns out to be complex for predicting the behaviour of real large dams. Indeed, if the flow is scaled according to Froude’s similarity law, the smaller Reynolds numbers observed on the scale models make it difficult to satisfactorily reproduce shear stresses, erosion rates and sedimentation. For this purpose it is possible to keep other selected non-dimensional expressions similar between the prototype and the model by working with material of scrupulously chosen density and grain size. Anyway, scale effects remain generally significant and hard to quantify (Marche 2004). More valid tests are carried out in natural fields (Vaskinn 2002).
4.6 Discussion
It is certainly difficult in such a context to identify one modelling approach as ideal. Nevertheless, a coherent methodology, specifically adapted to the case of Eau d’Heure dam, has been identified.
The unavailability of reliable data regarding the grain size distribution of the dam material must be underlined straightaway, thus precluding any chance of a credible computation with either a coupled quasi-3D numerical simulation or a parametric model. Indeed both techniques involve a solid transport capacity law requiring grain size data.
On the other hand, recent databases have been studied, such as that gathered by Wahl (Wahl 2001), and this analysis has revealed a clear under representation of rockfill dams. As a consequence the analogy method is also judged as inapplicable in the present case.
Furthermore, due to the previously detailed difficulty in fulfilling similarity criteria, physical modelling of such a fluid–structure interaction wouldn’t lead to a credible evaluation of the breach parameters for Eau d’Heure dam, the constitutive material of which remains fairly unknown.
In conclusion, exploiting empirical formulae appears as the most suitable for the present case and their application for Eau d’Heure dam is discussed in § 5.1. Nevertheless, it must be outlined that our approach refers to those formulae exclusively for describing the breach parameters and not for predicting the flow behaviour, such as the outflow hydrograph or the peak discharge. On the contrary, the flow is computed by means of a fully 2D unsteady numerical simulation with WOLF 2D, on the basis of a time varying topography according to the breach parameters previously found out.
In order to furthermore increase the reliability of the results, several different empirical models have been compared and their results confronted to each other as well as to the standard norms applied in various European and northern American countries (§ 5.2).
A comprehensive sensitivity analysis of the hydrograph with respect to the breach parameters is undertaken thereafter (§ IV.8), in order to definitively corroborate the relevance of the operated choices to be included as a time-varying topography in the 2D flow model.
5 APPLICATION TO EAU D’HEURE DAM
5.1 Empirical models
5.1.1 Dam break in cascade
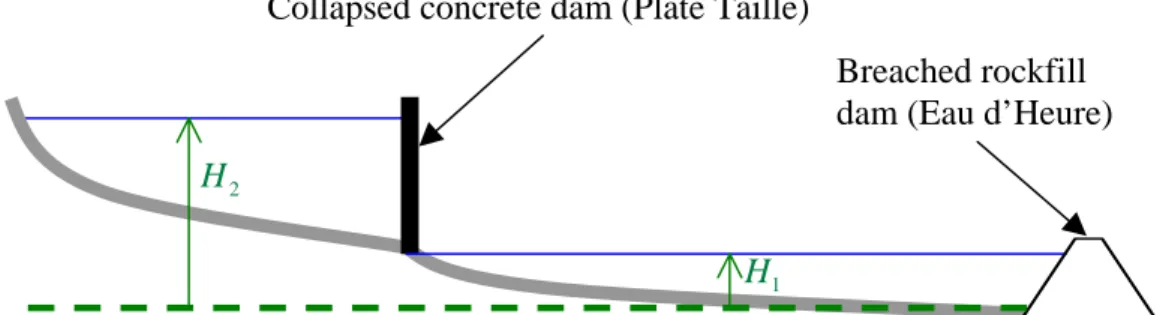
The influence on the dynamics of the breach evolution of the two main reservoirs laid out in cascade (Figure 2) must be introduced properly into the empirical model. The formulation of all empirical models involves the “volume of water in the reservoir” and the “water head”. The volume of water to be taken into account is clearly the total volume of water, which is released through the breach and thus contributes to the erosion process. Determining the most relevant water head is more intricate. In order to test the sensitivity of the results to this particular feature, two cases have been considered:
- the total storage of both reservoirs is taken into account and the water head is
measured immediately upstream of Eau d’Heure dam : H1 (scenario 1);
- the total storage is considered and the water head corresponds to an average of both heads, weighted by the corresponding storage capacity (scenario 2).
Collapsed concrete dam (Plate Taille)
Breached rockfill dam (Eau d’Heure)
1 H 2
H
Figure 2: Schematic view of the two main reservoirs arranged in cascade.
5.1.2 Empirical formulae
Several empirical models have been applied to the case of the failure Eau d’Heure dam. A short description of the main models is depicted here and the results are discussed in § 5.3.
The formulae of MACDONALD andLANGRIDGE-MONOPOLIS (1984) are based on the study of
42 historical cases of gradual failure. A better degree of correlation is obtained for the estimation of the volume of eroded material than for the breach formation time. According to the authors (MacDonald and Langridge-Monopolis 1984), the time of failure tends to be over-estimated because the predictive model is based on data which possibly include not only the formation time but also a part of the time of reservoir depletion (Dam Safety Office 1992).
FROELICH (Broich 1997; Marche 2004) has exploited testimonies as well as descriptions of
the remaining parts of failed dams to study the mechanism of breach development. Whatever the type of erosion (either internal or external), Froelich (1987) provides an estimation of the average width and formation time of the breach, the shape of which is judged to be most
likely either triangular or trapezoidal. In 1995, Froelich enhanced his prior analysis on the basis this time of 63 different cases, including 18 cases of rupture never reported so far (Wahl 1998). New relations offering a better correlation factor were obtained.
VON THUN and GILLETTE (1990) recommend a relation for approximating the average breach
width, applicable for reservoirs larger than 10 million m³. According to these authors, the formula achieves a better correlation than previous results based on the Breach Formation Factor (Wahl 1998). They also identify the value of approximately 150 m as an upper limit for breach width.
5.2 Foreign regulations
5.2.1 Description of recent norms
Table 1 summarizes legal norms and standards applicable in different countries. Symbol represents the total dam height. It must be emphasized that these standards are not primarily dedicated to a highly accurate description of failure phenomenon but to serve as guidelines containing implicitly a certain "safety factor".
H
According to standards of Hydro-Quebec, a trapezoidal breach formed in 30 minutes must be assumed for rockfill dams. If an upstream asphaltic membrane protects the dam the failure time may be increased up to 2 hours. In any case, the breach is supposed to form in the centre of the main valley.
According to the preliminary standard MEQ issued by the “Centre d’Expertise Hydrique du Québec” the breach shape is supposed to be rectangular.
In Switzerland, the formation of a trapezoidal breach is assumed to be instantaneous.
In France, the cases with and without asphaltic upstream membrane are clearly distinguished. In the former case the failure scenario corresponds to a total and instantaneous collapse of the dam while in the latter case the erosion time may be selected as high as a few hours.
5.2.2 Application to Eau d’Heure Dam
The application of the legal regulations exposed in Table 1 in the particular case of Eau d’Heure dam, with an asphaltic upstream membrane, leads to the breach parameters described in Table 2.
Table 1: Norms and standards applicable in various countries (Marche 2004).
Hydro-Québec NWS (USA) MEQ (CEHQ) Switzerland
Mean width 5H 1 to 3H 3H 3H
Formation time 0,5 h to 2 h 0.1 to 0.5 h 0,5 h 0
Table 2: Breach parameters for Eau d’Heure dam according to the international standards. Hydro-Québec NWS (USA) MEQ (CEHQ) France Switzerland Mean width 150 m 30 to 90 m 90 m 250 m 90 m Formation time 0.5 to 2 h 0.1 à 0.5 h 0.5 h 0.01 h 0
5.3 Discussion
5.3.1 Final breach width
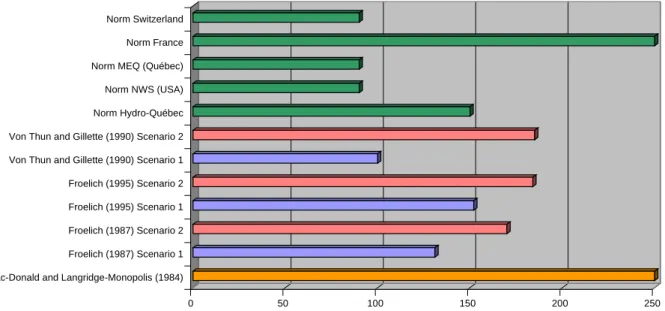
The evaluations of the final width of the breach produced by the various empirical models and by the international standards are summarized in Figure 3. The extreme variability of the results must be underlined. Nevertheless the results may be sorted out into three major categories: width slightly lower than 100 m, width of about 150 to 200 m or width of 250 m (total crest length). The lowest widths result mainly from norms in force in Quebec, likely to be specifically suited for extremely long dams and relatively low height. The configuration of Eau d’Heure dam being by far different, these results are not seen as the most relevant. Similarly, the values estimated on the basis of "scenario 1" will be systematically neglected because this scenario is considered as less realistic than "scenario 2" (see § 5.1.1).
0 50 100 150 200 250
Mac-Donald and Langridge-Monopolis (1984) Froelich (1987) Scenario 1 Froelich (1987) Scenario 2 Froelich (1995) Scenario 1 Froelich (1995) Scenario 2 Von Thun and Gillette (1990) Scenario 1 Von Thun and Gillette (1990) Scenario 2 Norm Hydro-Québec Norm NWS (USA) Norm MEQ (Québec) Norm France Norm Switzerland
Figure 3: Breach final width (m) according to empirical models and regulations.
Among the remaining possibilities, the breach width corresponding to the total crest length, namely 250 m, was chosen for three main reasons. First, it appears a priori as the most careful solution regarding the flow induced. Secondly, the sensitivity analysis exposed in § 6.3 shows the moderate influence of this choice on the hydrograph to be propagated towards the downstream valley. Finally, if a lower width was privileged (e.g. 200 m) additional questionable assumptions would be needed regarding the location of the breach in the transverse direction: either a breach centred with the main valley or centred with the point where the overtopping flow is most likely to initiate external erosion?
5.3.2 Breach formation time
The difficulty of estimating the formation time must be kept in mind, especially for rockfill dams due to possible almost unpredictable structural failures.
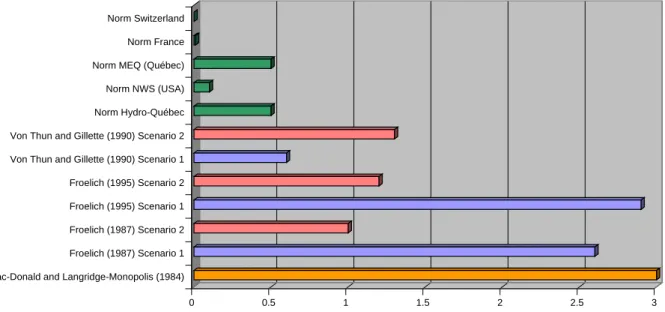
Figure 4 summarizes the calculated formation times. Once more, the assumption "scenario 1" is not considered as sufficiently realistic and the corresponding results are disregarded. Moreover, the model of MacDonald and Langridge-Monopolis is known to produce estimates of the breach formation time reliable essentially for earthfill dams and not for rockfill dams.
Consequently, three possibilities remain: quasi-instantaneous formation, breaching in about 30 minutes or in about 60 minutes. The sensitivity analysis of § 6.2 shows that the most unfavourable time of the formation corresponds neither to the quickest failure nor, of course, to the slowest one. Consequently, the intermediate duration of 30 minutes is selected.
0 0.5 1 1.5 2 2.5 3
Mac-Donald and Langridge-Monopolis (1984) Froelich (1987) Scenario 1 Froelich (1987) Scenario 2 Froelich (1995) Scenario 1 Froelich (1995) Scenario 2 Von Thun and Gillette (1990) Scenario 1 Von Thun and Gillette (1990) Scenario 2 Norm Hydro-Québec Norm NWS (USA) Norm MEQ (Québec) Norm France Norm Switzerland
Figure 4: Breach formation time (h) according to empirical models and regulations.
5.3.3 Breach lateral slope
A great variability is observed in the side slopes forecasted by the various empirical models and prescribed by the standards. However, in the framework of the present study it appears relevant to admit a gradual decrease in the level of the crest remaining horizontal, hence forming a breach extending along the whole width of the natural valley. Indeed, any other alternative leads to the emergence of additional doubtful questions related to the precise geometry and location of a potentially triangular or trapezoidal breach. In other words, this increased complexity of the geometrical description of the breach would only lead to an illusion of enhanced accuracy.
5.3.4 Conclusion
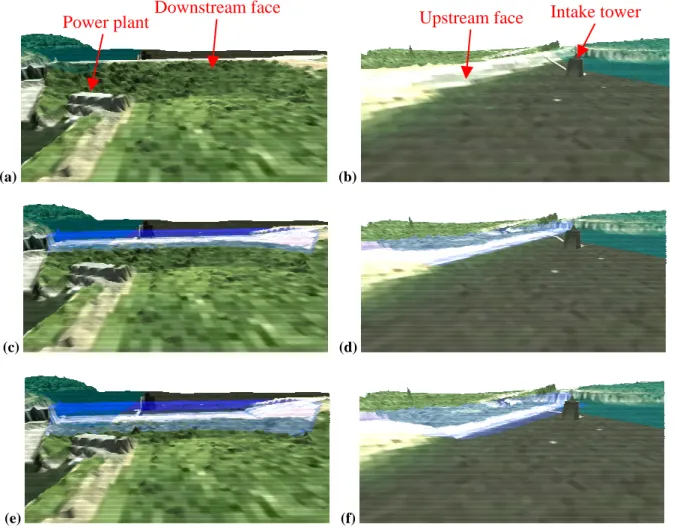
The process of gradual erosion of Eau d’Heure dam has been investigated and characterized for being implemented in a fully unsteady 2D flow simulation of the dam break wave induced by the instantaneous collapse of the upstream concrete dam. As illustrated by Figure 5, the retained breach characteristics correspond to the development in 30 minutes of a 250 m wide breach, the crest of which is assumed to remain horizontal.
6 SENSITIVITY ANALYSIS
Due to the remaining level of uncertainty regarding the selection of the breach parameters, it appears crucial to estimate the sensitivity of the results with respect to input data such as the breach width, the formation time as well as the overtopping depth initiating the breach. This study is based on the development and the application of a simplified module for flow computation, able to provide the modeller with an approximated outflow hydrograph in a very short computation time.
(a) (b)
Downstream face Intake tower
Upstream face Power plant
(c) (d)
(e) (f)
Figure 5: 3D views of Eau d’Heure dam in the DEM (for 2D flow simulation) during the breaching. (a) View from downstream, at the beginning; (b) View from upstream, at the beginning; (c) View from downstream, after 15 minutes; (d) View from upstream, after 15 minutes;
(e) View from downstream, at the end; (f) View from upstream, at the end.
6.1 Simplified flow model
The main objective of the simplified hydrodynamic model developed is to enable quick comparisons between the results of a series of simulations in the framework of the sensitivity analysis. Those various simulations only differ from each other only by the failure scenario taken into consideration for Eau d’Heure dam.
A 0D mathematical and numerical model, explicitly discretized in time but not distributed in space has been adopted. The principle of calculation is simply based on the solution of a time-dependant continuity equation for the reservoir of Eau d’Heure dam. This approach simulates the unsteady evolution of the volume stored in the reservoir and thus the time evolution of the water level by means of the depth-volume curve of the reservoir, obtained on the basis of a laser Digital Elevation Model (DEM). The inflow hydrograph into the reservoir of Eau d’Heure is estimated by means of an analytical curve fitted to the dam break hydrograph of the upstream dam. This latter hydrograph is supplied by a 2D numerical simulation. The flow released downstream of Eau d’Heure reservoir is evaluated at each time step as a function of the water depth exceeding the instantaneous dam crest.
6.2 Breach formation time
The formation of the breach is initiated once a threshold value of the load provoked by the overtopping flow is reached. According to § 3, a threshold water depth has been selected, namely 30 cm, though the actual process is more tightly related to a critical shear stress able to initiate external erosion or a critical extra-load responsible for a structural failure. Afterwards, the crest level is assumed to decrease linearly with time.
0 0.2 0.4 0.6 0.8 1 1.2 1.4 1.6 1.8 2 0 1 2 3 4 5 6 7 8x 10 4 Time (h) O u tf lo w d is c h a rg e (m ³/ s ) Inflow hydrograph
Overtopping without erosion Breach formation time : 12 min Breach formation time : 30 min Breach formation time : 60 min Instantaneous breach formation
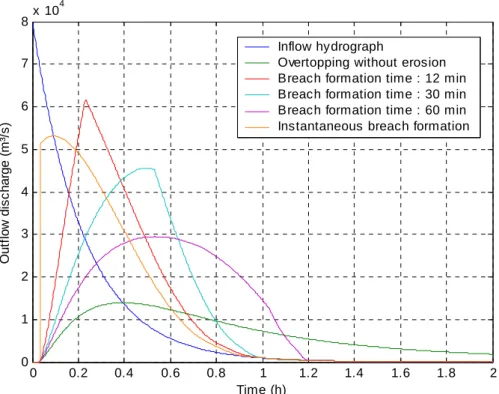
Figure 6 : Hydrographs released at Eau d’Heure dam in the case of various breach formation times as well as in the case of an overflow without erosion of the structure.
Figure 6 compares the hydrographs calculated according to different assumptions: overflow without erosion, instantaneous breach formation, and gradual breaching in 12, 30 or 60 minutes. It clearly appears that the inflow hydrograph (due to the collapse of the upstream concrete dam) is significantly smoothed either in case of a particularly slow breaching process or without breach formation. On the other hand, the sensitivity of the peak discharge with respect to the breach formation time remains relatively low. Indeed, for breaching conditions varying from an instantaneous breach formation to a breach opening time of 30 minutes, the modification in the peak discharge doesn’t exceed 20 to 25 %.
More generally, the sensitivity of the peak discharge with respect to the formation time is directly related to the variation of the water head during the process of progressive breaching. For reservoirs of low capacity compared to the considered discharges, the water head upstream is likely to vary significantly during the development of the breach and the sensitivity of the peak discharge is thus substantial. In contrast, for a reservoir of large capacity, the breach formation time has a weaker influence on the peak discharge.
Actually, Figure 6 demonstrates a more complex pattern. Indeed, the peak discharge does not evolve in a monotonous way with the formation time. On the contrary a maximum value of the peak discharge has been identified to occur in the case of a gradual opening in twelve minutes. This behaviour results from the combined action of two antagonistic effects:
- In case of a faster breach formation, the quicker lowering of the crest compared to the water level in the reservoir increases the water head, and thus the hydraulic gradient directly affecting the flow rate towards downstream,
- In case of a slower breach development, the water head is also increased since the reservoir is permanently fed with water flowing from upstream and hence a larger amount of water is temporarily stored in the reservoir.
6.3 Breach final width
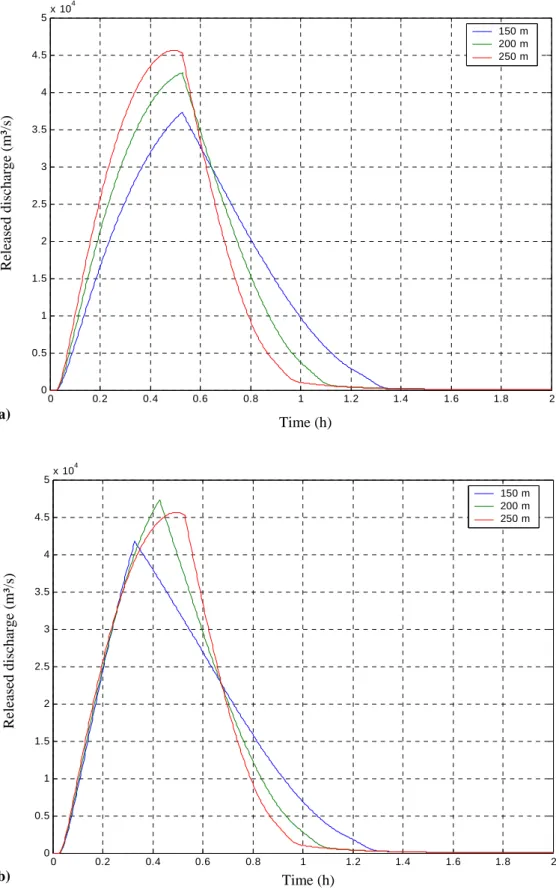
Figure 7(a) illustrates the outflow hydrographs calculated assuming the development in half an hour of a breach of 150, 200 or 250 m in width. The figure confirms that a modification in the breach width has a fairly weak influence on the peak discharge in the case of the reservoir of Eau d’Heure. This trend is explained by the combination of the two previously mentioned antagonistic effects on the water head at the dam (§ 6.2).
Moreover, it is expected that if the amount of material to be eroded is weaker, because of the lower breach size, the formation time is also reduced. As a consequence, the comparison of the three scenarios has been repeated with breach formation times adjusted in proportion to the breach width (respectively 18 min, 24 min and 30 min). Figure 7(b) illustrates the results obtained and again corroborates the low sensitivity of the hydrograph with respect to the breach width.
6.4 Near-field and far-field
In a general way, the breach parameters directly influence the consequences and the gravity of the flood only in a downstream area close to the broken dam. On the other hand, further downstream in the valley, the time of arrival of the wave is shifted according to the change in the formation time of the breach but, globally, the extent of the flood and the maximum levels are mainly independent of the other breach parameters (Wahl 1998; Marche 2004). This fact is justified not only by the large volume of water stored by the complex of upstream dams, but also by the wave propagation effects in the natural valley. Thus, the sensitivity of the discharges and of the maximum levels with respect to the breach formation time and the breach geometry is rather quickly attenuated towards downstream. 2D simulations confirm this fact.
7 CONCLUSION
The characteristics of the breach induced in the Eau d’Heure dam after the total collapse of an upstream concrete dam were investigated. Due to the unavailability of reliable and accurate data on the grain size distribution of the embankment material, the study of the failure scenario by gradual breaching rests on a critical and comparative examination of several empirical models validated in the literature as well as on guidelines prescribed by national legislations or standards. Most likely values have been identified for the breach final width and breach formation time. Moreover, a sensitivity analysis of the hydrograph inundating the downstream valley has been conducted for different breach parameters. This study has enabled to corroborate the relevance of the selected values. Those results have been implemented in the quasi-3D flow model WOLF with time-varying topography. This distributed hydrodynamic model has already demonstrated its ability to perform reliable and accurate simulations of dam break flows (Dewals et al. 2002b; Erpicum et al. 2004). Detailed risk maps as well as hydrographs or limnigraphs at strategic locations are obtained as output results.
0 0.2 0.4 0.6 0.8 1 1.2 1.4 1.6 1.8 2 0 0.5 1 1.5 2 2.5 3 3.5 4 4.5 5x 10 4 Temps (h) 150 m 200 m 250 m D é bi t év ac u é (m ³/ s ) Released discharge (m³/s) (a) Time (h) (b) 0 0.2 0.4 0.6 0.8 1 1.2 1.4 1.6 1.8 2 0 0.5 1 1.5 2 2.5 3 3.5 4 4.5 5x 10 4 T 150 m 200 m 250 m D ébi t év ac u é ( m ³/ s ) Released discharge (m³/s) emps (h) Time (h)
Figure 7: Outflow hydrograph released at Eau d’Heure dam as a function of the breach width for a breach formation time either of 30 min (a) or adjusted according to the breach final width (b).
ACKNOWLEDGEMENTS
The authors gratefully acknowledge the departments “SETHY” and “Direction des barrages de l’Ouest” of the “Ministère Wallon de l’Equipement et des Transports” (Belgian Ministry of Facilities and Transport) for funding the research project and for providing data.
REFERENCES
BROICH, K. (1997). Computergestützte Analyse des Dammerosionsbruchs, Universität der
Bundeswehr München.
BROICH, K. (2003). "Sediment transport in breach formation process." 3rd IMPACT Project Workshop, Louvain-la-Neuve.
Dam Safety Office. (1992). "Dam safety guidelines: Dam break inundation analysis and downstream hazard classification." Washington State - Department of Ecology.
DEWALS, B., ARCHAMBEAU, P., ERPICUM, S., MOUZELARD, T., and PIROTTON, M. (2002a). "Coupled computations of highly erosive flows with WOLF software." 5th International Conference on Hydro-Science & -Engineering, Warsaw, 10 p.
DEWALS, B., ARCHAMBEAU, P., ERPICUM, S., MOUZELARD, T., and PIROTTON, M. (2002b). "Dam-break hazard mitigation with geomorphic flow computation, using WOLF 2D hydrodynamic software." Risk Analysis III, C. A. Brebbia, ed., WIT Press, 59-68.
DEWALS, B., ARCHAMBEAU, P., ERPICUM, S., MOUZELARD, T., and PIROTTON, M. (2002c). "An integrated approach for modelling gradual dam failures and downstream wave propagation." 1st IMPACT Project Workshop, Wallingford.
ERPICUM, S., ARCHAMBEAU, P., DEWALS, B., DETREMBLEUR, S., and PIROTTON, M. (2004). "Computation of the Malpasset dam break with a 2D conservative flow
solver on a multiblock structured grid." 6th International Conference of
Hydroinformatics, Singapore.
MACDONALD, T. C., and LANGRIDGE-MONOPOLIS, J. (1984). "Breaching characteristics of dam failures." J. Hydraul. Eng.-ASCE, 110(5), 567-586.
MARCHE, C. (2004). Barrages : crues de rupture et protection civile, Presses Internationales
Polytechniques.
VASKINN, K. A. (2002). "Large-scale Field Test." 1st IMPACT Project Workshop,
Wallingford.
WAHL, T. L. (1998). "Prediction of embankment dam breach parameters, a litterature review
and needs assessment." DSO-98-004, Dam Safety Office, Water Ressources Research
Laboratory, US Bureau of Reclamation, Denver.
WAHL, T. L. (2001). "The Uncertainty of Embankment Dam Breach Parameter Predictions Based on Dam Failure Case Studies." Workshop on Issues, Resolutions, and Research Needs Related to Dam Failure Analysis, Oklahoma City, OK.