RESEARCH OUTPUTS / RÉSULTATS DE RECHERCHE
Author(s) - Auteur(s) :
Publication date - Date de publication :
Permanent link - Permalien :
Rights / License - Licence de droit d’auteur :
Bibliothèque Universitaire Moretus Plantin
Institutional Repository - Research Portal
Dépôt Institutionnel - Portail de la Recherche
researchportal.unamur.be
University of Namur
gViz, a novel tool for the visualization of co-expression networks
Helaers, Raphaël; Bareke, Eric; De Meulder, Bertrand; Pierre, Michael; Depiereux, Sophie;
Habra, Naji; Depiereux, Eric
Published in: BMC Research Notes DOI: 10.1186/1756-0500-4-452 Publication date: 2011 Document Version
Publisher's PDF, also known as Version of record Link to publication
Citation for pulished version (HARVARD):
Helaers, R, Bareke, E, De Meulder, B, Pierre, M, Depiereux, S, Habra, N & Depiereux, E 2011, 'gViz, a novel tool for the visualization of co-expression networks', BMC Research Notes, vol. 4, 452.
https://doi.org/10.1186/1756-0500-4-452
General rights
Copyright and moral rights for the publications made accessible in the public portal are retained by the authors and/or other copyright owners and it is a condition of accessing publications that users recognise and abide by the legal requirements associated with these rights. • Users may download and print one copy of any publication from the public portal for the purpose of private study or research. • You may not further distribute the material or use it for any profit-making activity or commercial gain
• You may freely distribute the URL identifying the publication in the public portal ?
Take down policy
If you believe that this document breaches copyright please contact us providing details, and we will remove access to the work immediately and investigate your claim.
T E C H N I C A L N O T E
Open Access
gViz, a novel tool for the visualization of
co-expression networks
Raphaël Helaers
1,3†, Eric Bareke
1*†, Bertrand De Meulder
1, Michael Pierre
1, Sophie Depiereux
1, Naji Habra
2and
Eric Depiereux
1Abstract
Background: The quantity of microarray data available on the Internet has grown dramatically over the past years and now represents millions of Euros worth of underused information. One way to use this data is through co-expression analysis. To avoid a certain amount of bias, such data must often be analyzed at the genome scale, for example by network representation. The identification of co-expression networks is an important means to unravel gene to gene interactions and the underlying functional relationship between them. However, it is very difficult to explore and analyze a network of such dimensions. Several programs (Cytoscape, yEd) have already been
developed for network analysis; however, to our knowledge, there are no available GraphML compatible programs. Findings: We designed and developed gViz, a GraphML network visualization and exploration tool. gViz is built on clustering coefficient-based algorithms and is a novel tool to visualize and manipulate networks of co-expression interactions among a selection of probesets (each representing a single gene or transcript), based on a set of microarray co-expression data stored as an adjacency matrix.
Conclusions: We present here gViz, a software tool designed to visualize and explore large GraphML networks, combining network theory, biological annotation data, microarray data analysis and advanced graphical features.
Background
The merging of network theories, public biological data knowledge and microarray data analysis techniques pre-sents an unexploited opportunity to explore and under-stand the functionality of genes. Similar patterns in gene expression profiles have been assumed to suggest rela-tionships between genes [1] and it is important to dis-cover these relationships between co-expressed genes using co-expression matrices from microarray data. While the construction of co-expression networks may be straightforward, we limit our work to the presenta-tion of a visualizapresenta-tion tool to search for co-expression between genes and leave to other studies the important question of determining whether it is biologically mean-ingful to represent a gene by a network node and a functional relationship by an edge.
Several network exploration softwares have been developed these past years; each of them with particular pros and cons. We direct readers to the following reviews for more details on those programs [2,3]. After testing some of the programs discussed in those reviews, we estimated there was an advantage to build our own visualization program, with several new features included.
Our motivations for developing our program were to allow use of the GraphML (Graph Markup Language) format into a network visualization software and provid-ing a biologists-oriented network exploration solution, both user-friendly and light. To the best of our knowl-edge, gViz is the only software capable of rendering dynamically GraphML networks. We are aware of the Cytoscape plugin ‘Graphmlreader’, however it is still in development and seems to be non-functioning at the moment.
The GraphML format is based on XML structure and is therefore ideally suited as a common denominator for all kinds of services generating, archiving, or processing graphs. It supports attributed for nodes and edges, * Correspondence: [email protected]
† Contributed equally
1Bioinformatics and Biostatistics unit, Molecular Biology Research Unit
(MBRU), Namur Center for Complex Systems (NAXYS), University of Namur (FUNDP), 61 Rue de Bruxelles, B-5000 Namur, Belgium
Full list of author information is available at the end of the article
© 2011 Bareke et al; licensee BioMed Central Ltd. This is an open access article distributed under the terms of the Creative Commons Attribution License (http://creativecommons.org/licenses/by/2.0), which permits unrestricted use, distribution, and reproduction in any medium, provided the original work is properly cited.
hierarchical graphs and is very flexible [4]. GraphML was developed as modern graph exchange format, suita-ble in particular for exchange between graph drawing tool and other applications, during the 8thSymposium on graph drawing (GD 2000). It has been developed with the following pragmatic goals in mind: simplicity, generality, extensibility and robustness [5]. We also noticed that this format is very compact and therefore allows for faster transfer or loading into a software. One given network uses less storage space when encoded in GraphML format then, for example, in DOT format.
gViz is a novel tool built around clustering coefficient-based algorithms to visualize and manipulate networks of co-expression interactions among a selection of pro-besets (each probeset representing a single gene or tran-script), based on a set of microarray co-expression data stored as an adjacency matrix. This adjacency matrix, representing numerically the relationships between pro-besets, can be inferred using co-expression data compu-tational tools such as MINET [6], an R package that computes co-expression relations between probesets, and several microarrays.
The inference of interaction networks is a relatively new area in the field of bioinformatics. However, several algo-rithms are available, including but not limited to the fol-lowing: Bayesian approach-based algorithms, such as the GeneTS package [7], neuronal computation model algo-rithms, such as the“neuro-fuzzy” [8] approach, or mutual information computation-based algorithms, such as MINET or qpGraph [9]. We chose to use MINET for sev-eral reasons: at each step of the computation process, it is possible to choose between several methods and to set dif-ferent parameters; the methods contained in the algorithm are at the cutting edge of current knowledge in the field; and finally we were able to interact with the developers of the package to refine certain steps of the computation. MINET accepts preprocessed microarray data (we chose to use the GCRMA [10] preprocessing method) and provides a co-expression matrix in the form of a GraphML file.
Even if input co-expression matrices are based on pro-beset identifiers, gViz provides users with advanced fea-tures to visualize the corresponding interaction networks using other associated identifiers, such as gene identifiers (Entrez Gene IDs [11], Ensembl IDs [12], UniGene IDs [13] and gene symbols), protein identifiers (SwissProt Accession Codes [14]) and disease identifiers (OMIM IDs [15]).
Implementation
gViz is written in Java and uses JUNG 2 (Java Universal Network/Graph Framework, http://jung.sourceforge.net/ ), a Java library that provides a common and extensible language for the modeling, analysis and visualization of data that can be represented as a graph or a network.
Annotation information displayed on the graph origi-nates from an external microarray database, PathEx [16], a manually-curated web-based expression array dataset builder of human microarray data, for researchers who need to generate organized microarray datasets effi-ciently and according to their specific needs.
Results and discussion
Comparison with existing software
Several programs have been designed for the analysis of biological networks, the best known of which is Cytoscape [17]. Although it is a major first class visualization pro-gram, we chose to develop gViz and to add some unique and convenient functionalities, the first of which is the capacity to compute and display sub-networks using sev-eral different built-in filters (see Figure 1 and 2 for an overview of gViz interface and functionalities). This func-tionality, although potentially biologically important, does not have its counterpart in Cytoscape (see Figure 3). We also noted that gViz is much more user-friendly and easier to use than most of the alternative software packages. Although it is technically possible to display a huge net-work containing tens of thousands of nodes and a hundred times more edges, it would not be humanly efficient to identify specific parts of that network. In that context, gViz proposes various features that allow the user to dis-play only parts of the network of interest. The user can then select one or more identifiers from a list deriving from a data set provided and display the sub-network con-taining only the relationships to be studied. A“deepness” slider feature provided can be used to gradually adjust the neighborhood of the selected identifiers: if n identifiers are selected and a deepness of d is chosen, the sub-network displayed will include the n identifiers and all their neigh-bors at a distance of a maximum of d edges. For example, selecting a single node and a deepness of 2 will display the selected node, its immediate neighbors and neighbors of the immediate neighbors. It is also possible to set deepness to the“maximum”, hence displaying all neighbors reach-able from the selected identifiers, regardless of their distance.
gViz can also filter the displayed relationships (edges) by excluding those with a weight under a given thresh-old (determined during the computational part in MINET; the weight represents the certainty of the selected interaction; i.e., if we consider a pair of nodes i and j, the weight of the arc between them is the maxi-mum of the MRMR (maximaxi-mum relevance/minimaxi-mum redundancy) score computed in both directions.). The user can at any time reduce (or increase) the number of edges displayed by eliminating those which are most likely to be false positives.
Apart from filtering by edge weight, one can filter the node list by degree (i.e. number of neighbors) and/or by Helaerset al. BMC Research Notes 2011, 4:452
http://www.biomedcentral.com/1756-0500/4/452
clusters (i.e. sub-networks without a connection between them). The clusters are recalculated whenever the user changes the threshold of the edge weights, because they do not take into account edges excluded by the filter. Another prominent feature allows the user to find iden-tifiers by providing annotation criteria (such as a description of a gene or its involvement in a biological process), and generate a sub-network using all or part of the search results.
It is worth mentioning that, to our knowledge, gViz is one of the few software packages capable of displaying and analyzing GraphML-based networks at the genome scale. The yEd graph editor [18] is another piece of soft-ware able to display GraphML; however, it is less powerful and proposes fewer features than gViz. The GraphML format was introduced around the year 2000 as a common network information exchange format. As such, gViz is a serious candidate for widespread GraphML analysis.
Here is a summary of gViz main advantages: an impor-tant feature of gViz is the ability to render dynamic net-works. This feature does not appear in most network visualization software (Rhodobase, Starnet, ... [19,20]), although it does in Cytoscape. gViz has also a unique additional feature of reading and displaying GraphML-based networks. Another important feature of gViz is the possibility to filter networks on the basis of different cri-teria, topological (number of neighbors, strength of edges, ...) and biological ones (membership in a certain pathway, known interactions, ...). The filtering ability based on several criteria does appear in other programs; however the set of criteria on which one can filter net-works in gViz is unique. We believe that some of the fil-ters available in gViz will be very useful to biologists.
gViz functionalities
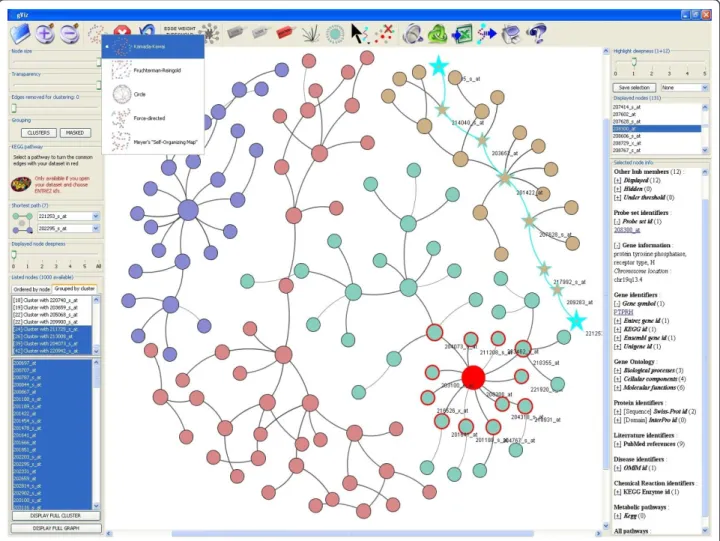
Networks displayed by gViz are dynamic and can be manipulated; each node or group of nodes can be Figure 1 Screenshot of the general interface of gViz. This is the interface of a typical analysis in gViz. The center panel displays the current network. The top panel contains the visual functionalities. The left panel contains the different sliders as well as the clustering and comparison tools. Finally, the right panel shows the information contained in PathEx on the nodes selected in the current network.
moved using the mouse. Several layout algorithms are available to automatically position graph nodes and the user can hence organize nodes differently depending on the complexity of the actual network. Other ‘visual’ fea-tures include the possibility to change the size and transparency of nodes, to set edge thickness as a tion of their weight, or to set node diameter as a func-tion of their degree. Specific nodes can be selected directly on the network graph using the mouse or from a list of displayed identifiers, and their neighbors are highlighted (the number of neighbors is set using a desired distance). Users can also generate colored clus-ters differently by choosing the number of edges to remove to form highly connected sub-networks, where these edges are identified using the Girvan and Newman clustering algorithm [21].
When one or more nodes of the network are selected, gViz displays a range of annotation information from the displayed sub-network, such as the list of direct
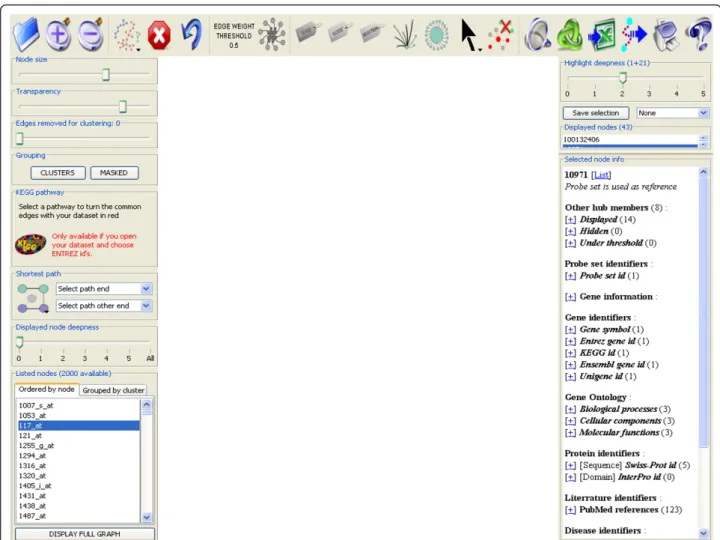
neighbors (displayed or not in the sub-networks) and the neighbors reached by an edge below the threshold set for the edge weight, and from a biological database, such as the probeset identifier, information on asso-ciated genes, biological processes, cellular components and molecular functions involved (from Gene Ontology [22]), proteins (sequences from SwissProt and domains from InterPro [23]), references in the literature (from PubMed [24]), diseases in which corresponding genes are involved (from OMIM), chemical reactions and pathways in which these genes are involved (from KEGG [25] and GenMAPP [26]). gViz also has two fea-tures that display the shortest path between two nodes and highlight the edges of the sub-network that can be identified in a pre-selected KEGG pathway. Various sta-tistics on the sub-network can be obtained, including histogram plots providing the user with the degree of network node distribution, the diameter of the sub-net-work, the weight distribution of the edges, the graph Figure 2 Zoom of the top, left and right panels. Detailed view of the top panel where are grouped the visual tools of gViz, left panel containing the sliders along with the clustering and comparison tools and right panel presenting the information from PathEx on the selected genes, as well as slider to adjust the selection deepness.
Helaerset al. BMC Research Notes 2011, 4:452 http://www.biomedcentral.com/1756-0500/4/452
distribution coefficient of clustering [27] and/or the cluster size distribution. Finally, the displayed (sub-)net-work and its statistics can be exported into different image and data file formats.
Case study
In this section, we will give an example of how to col-lect data, generate a GraphML using Minet and R and explore the resulting graph in gViz.
- Data collection: There are several web repositories for microarray data (GEO [28], Array Express [29]). We recommend the use of our database PathEx, for easier and faster data collection.
- Network Computation:
We use the following packages to compute our net-works: GCRMA, Minet and Infotheo (all of which freely available for download in Bioconductor). Here follows the R code to compute the network from microarray.cel files (for R > = R2.10)
library(gcrma) library(minet) cel < -list.celfiles() a < -ReadAffy(filenames = cel) b < -gcrma(a) c < -exprs(b) d < -t(c)
disc < -discretize(d, disc =“equalfreq “, nbins = sqrt(nrow(d)))
mim < -mutinformation(disc) net < -mrnet(mim)
write.table(net, file =“net.txt “, sep =“ \t”)
Once these steps are done (which can be long, depending on the computer’s speed and dataset size), one can import the network computed into gViz.
- gViz exploration
Once the network is loaded in gViz (using the ‘open’
1
2
3
Figure 3 Filters in gViz. This figure displays a network filtered by the number of neighbors (> 2) and the Minet score (score > 0.5). The filters are triggered by the buttons in {1} and {2}, and controls for the filters are accessed in the left lower panel {3}.
button {1}, see Figure 4 and the gViz manual), the list of the available nodes (genes) is shown in the lower left panel {2}. To display the entire graph, first select the ‘circle’ layout {3} then click on ‘display full graph’{4}. The circle layout is recommended for its low computa-tional needs; rendering a very large network can be extremely resource consuming. However, this step allows for a first overview of the network. At this step, one might want to filter his graph, using the filter on the Minet score {5}, or the filter on the number of neighbors{6}. One can also use the clustering option {7} to group similar nodes, by removing progressively the weakest edges in the graph (controlled by the ‘edge removed for clustering’ slider {8}). Then, using the selec-tion tool {9}, one highlights the nodes of interest, then hits the‘remove non-selected nodes’ button {10}. The
resulting sub-graph can then be shown using another, more explicit, layout (for example,‘force-directed’).
The different layouts available in gViz have different uses: the‘circle’ layout suits best the very big graphs, as it requires less computational power to be displayed. When working on a mid-sized sub-graph (less than 1,000 nodes), the‘Kamada-Kawai’ or ‘Fruchterman Rein-gold’ layouts are suggested. ‘Force directed’ or ‘Meyer’s self organizing’ layouts are best suited for small (less than 100 nodes) networks, as they need more computa-tional power to work but better discriminate the edges.
To compute the shortest path between two nodes, first select the‘shortest path’ tool {11}, click on the first node of interest then maintain the SHIFT key and click on the second node. gViz automatically computes the shortest path between those two nodes, with respect to
1
2
3
4
5
6
7
8
10
9
11
13
14
15
12
11’
Figure 4 Case study in gViz. Detailed view of the gViz interface and location of the tools mentioned in the‘case study’ section. Legend: 1-Open button; 2- Lower left panel, list of nodes available; 3- Layout control button; 4- Display full graph button; 5- Filter on edges scores; 6- Filter on number of neighbors; 7- Clustering button; 8- Edges removed for clustering control slider; 9- Selection tool; 10- Remove non-selected nodes buttons; 11- Shortest path tool; 12- Export shortest path button; 13- Export network (png); 14- Export network (text); 15- Lower right panel, information on selected nodes.
Helaerset al. BMC Research Notes 2011, 4:452 http://www.biomedcentral.com/1756-0500/4/452
the filters possibly applied. This feature can also be con-trolled via the left panel {11’}. The shortest path can be exported using the‘Export shortest path’ button {12}.
It is possible to export the current graph in image (click on ‘export network (png)’ button {12}) or in var-ious text formats (using the‘export network (text)’ but-ton {13}).
To obtain information on a certain node, simply click on its name in the lower right panel {14}, displaying all the information contained in the PathEx database for this particular gene (for more information about PathEx, see [16]).
Conclusions
This manuscript presents gViz, a new software package for the visualization, exploration and analysis of GraphML-based genetic co-expression networks. It has many convenient built-in filtering and displaying fea-tures and is connected to an external database contain-ing gene and annotation information. In conjunction with the MINET R package, we use gViz to explore the co-expression relationships of genes in different cellular states.
Availability and requirements
gViz is available at http://urbm-cluster.urbm.fundp.ac. be/webapps/gviz for 32 and 64 bit Windows, MacOS × and Linux/Unix. It requires Java engine 1.6 or higher to run http://java.com. To connect with the external data-base PathEx, the port 3306 of the user’s computer must be opened. This port may be blocked by a firewall and thus users must ask their network administrator to unblock it for their machine, if necessary. gViz is avail-able under the Open GPL license.
Acknowledgements and funding
gViz was developed with the support of the Bioinformatics & Biostatistics Lab that provided the computing facilities. We also thank Professor Michel Milinkovitch for providing authorization to use and modify a graphic engine from the Mantis database.
RH was funded by the University of Namur (FUNDP), EB received funding from two sources, namely the University of Namur (FUNDP) and the Belgian Government through the Belgian Technical Cooperation (BTC-CTB, Belgium), BDM works under a Télévie grant (FRS-FNRS, Belgium), MP is financed by the FRIA (FRS-FNRS, Belgium) and SD is a grantee of the FRS-FNRS.
Author details
1Bioinformatics and Biostatistics unit, Molecular Biology Research Unit
(MBRU), Namur Center for Complex Systems (NAXYS), University of Namur (FUNDP), 61 Rue de Bruxelles, B-5000 Namur, Belgium.2Research Center in
Information Systems Engineering (PReCISE), Faculty of Computing, University of Namur (FUNDP), 21 Rue Grandgagnage, B-5000 Namur, Belgium.
3Laboratory of Human Molecular Genetics (GEHU), de Duve Institute,
Catholic University of Louvain (UCLouvain), 75 Av. Hippocrate, B-1200 Brussels, Belgium.
Authors’ contributions
RH performed the major part of the coding, as well as debugging and web-publishing of the software. EB developed the PathEx database and took part
in the coding and debugging process. BDM took part in the design, debugging and biological testing. MP and SD participated in the biological testing process. NH was involved in the design and implementation process. ED conceived the study and supervised the development and publication. All authors have read and approved the final manuscript.
Competing interests
The authors declare that they have no competing interests.
Received: 2 May 2011 Accepted: 27 October 2011 Published: 27 October 2011
References
1. Yu H, Luscombe NM, Qian J, Gerstein M: Genomic analysis of gene expression relationships in transcriptional regulatory networks. Trends Genet 2003, 19(8):422-427.
2. Gehlenborg N, O’Donoghue SI, Baliga NS, Goesmann A, Hibbs MA, Kitano H, Kohlbacher O, Neuweger H, Schneider R, Tenenbaum D, et al: Visualization of omics data for systems biology. Nat Methods 7(3 Suppl): S56-68.
3. Suderman M, Hallett M: Tools for visually exploring biological networks. Bioinformatics 2007, 23(20):2651-2659.
4. The GraphML file format. [http://graphml.graphdrawing.org/index.html]. 5. Brandes U, Marshall MS, North SC: Graph data format workshop report.
8th International Symposium on Graph Drawing (GD 2000): 2001 2000 Lecture Notes in Computer Science; 2000, 410-418.
6. Meyer PE, Lafitte F, Bontempi G: minet: A R/Bioconductor package for inferring large transcriptional networks using mutual information. BMC Bioinformatics 2008, 9:461.
7. Schafer J, Strimmer K: An empirical Bayes approach to inferring large-scale gene association networks. Bioinformatics 2005, 21(6):754-764. 8. Chen CF, Feng X, Szeto J: Identification of critical genes in microarray
experiments by a Neuro-Fuzzy approach. Comput Biol Chem 2006, 30(5):372-381.
9. Castelo R, Roverato A: Reverse engineering molecular regulatory networks from microarray data with qp-graphs. J Comput Biol 2009, 16(2):213-227.
10. Wu Z, Irizarry RA, Gentleman R, Martinez-Murillo F, Spencer F: A model-based background adjustement for oligonucleotides expression arrays. Journal of the American Statistical Association 2004, 99(468):909-917. 11. Maglott D, Ostell J, Pruitt KD, Tatusova T: Entrez Gene: gene-centered
information at NCBI. Nucleic Acids Res 2005, , 33 Database: D54-58. 12. Hubbard T, Barker D, Birney E, Cameron G, Chen Y, Clark L, Cox T, Cuff J,
Curwen V, Down T, et al: The Ensembl genome database project. Nucleic Acids Res 2002, 30(1):38-41.
13. JU P, L W, GD S: UniGene: a unified view of the transcriptome. The NCBI Handbook Bethesda (MD): National Center for Biotechnology Information 2003.
14. Boeckmann B, Bairoch A, Apweiler R, Blatter MC, Estreicher A, Gasteiger E, Martin MJ, Michoud K, O’Donovan C, Phan I, et al: The SWISS-PROT protein knowledgebase and its supplement TrEMBL in 2003. Nucleic Acids Res 2003, 31(1):365-370.
15. Rashbass J: Online Mendelian Inheritance in Man. Trends Genet 1995, 11(7):291-292.
16. Bareke E, Pierre M, Gaigneaux A, De Meulder B, Depiereux S, Berger F, Habra N, Depiereux E: PathEx: a novel multi factors based datasets selector web tool. BMC Bioinformatics 2010, 11:528.
17. Shannon P, Markiel A, Ozier O, Baliga NS, Wang JT, Ramage D, Amin N, Schwikowski B, Ideker T: Cytoscape: a software environment for integrated models of biomolecular interaction networks. Genome Res 2003, 13(11):2498-2504.
18. yEd- Graph Editor. [http://www.yworks.com/en/products_yed_about.html]. 19. Moskvin OV, Bolotin D, Wang A, Ivanov PS, Gomelsky M: Rhodobase, a
meta-analytical tool for reconstructing gene regulatory networks in a model photosynthetic bacterium. Biosystems 103(2):125-131. 20. Jupiter D, Chen H, VanBuren V: STARNET 2: a web-based tool for
accelerating discovery of gene regulatory networks using microarray co-expression data. BMC Bioinformatics 2009, 10:332.
21. Girvan M, Newman ME: Community structure in social and biological networks. Proc Natl Acad Sci USA 2002, 99(12):7821-7826.
22. Ashburner M, Ball CA, Blake JA, Botstein D, Butler H, Cherry JM, Davis AP, Dolinski K, Dwight SS, Eppig JT, et al: Gene ontology: tool for the unification of biology. The Gene Ontology Consortium. Nat Genet 2000, 25(1):25-29.
23. Apweiler R, Attwood TK, Bairoch A, Bateman A, Birney E, Biswas M, Bucher P, Cerutti L, Corpet F, Croning MD, et al: The InterPro database, an integrated documentation resource for protein families, domains and functional sites. Nucleic Acids Res 2001, 29(1):37-40.
24. Guillaume JC: [PubMed]. Ann Dermatol Venereol 1998, 125(6-7):467-468. 25. Ogata H, Goto S, Sato K, Fujibuchi W, Bono H, Kanehisa M: KEGG: Kyoto
Encyclopedia of Genes and Genomes. Nucleic Acids Res 1999, 27(1):29-34. 26. Salomonis N, Hanspers K, Zambon AC, Vranizan K, Lawlor SC, Dahlquist KD, Doniger SW, Stuart J, Conklin BR, Pico AR: GenMAPP 2: new features and resources for pathway analysis. BMC Bioinformatics 2007, 8:217. 27. Watts DJ, Strogatz SH: Collective dynamics of‘small-world’ networks.
Nature 1998, 393(6684):440-442.
28. Barrett T, Troup DB, Wilhite SE, Ledoux P, Rudnev D, Evangelista C, Kim IF, Soboleva A, Tomashevsky M, Edgar R: NCBI GEO: mining tens of millions of expression profiles–database and tools update. Nucleic Acids Res 2007, , 35 Database: D760-765.
29. Parkinson H, Kapushesky M, Shojatalab M, Abeygunawardena N, Coulson R, Farne A, Holloway E, Kolesnykov N, Lilja P, Lukk M, et al: ArrayExpress–a public database of microarray experiments and gene expression profiles. Nucleic Acids Res 2007, , 35 Database: D747-750.
doi:10.1186/1756-0500-4-452
Cite this article as: Helaers et al.: gViz, a novel tool for the visualization of co-expression networks. BMC Research Notes 2011 4:452.
Submit your next manuscript to BioMed Central and take full advantage of:
• Convenient online submission
• Thorough peer review
• No space constraints or color figure charges
• Immediate publication on acceptance
• Inclusion in PubMed, CAS, Scopus and Google Scholar
• Research which is freely available for redistribution
Submit your manuscript at www.biomedcentral.com/submit
Helaerset al. BMC Research Notes 2011, 4:452 http://www.biomedcentral.com/1756-0500/4/452