Open Archive TOULOUSE Archive Ouverte (OATAO)
OATAO is an open access repository that collects the work of Toulouse researchers and
makes it freely available over the web where possible.
This is an author-deposited version published in :
http://oatao.univ-toulouse.fr/
Eprints ID : 19735
To link to this article : DOI:10.1007/s11661-018-4508-4
URL : http://dx.doi.org/10.1007/s11661-018-4508-4
To cite this version :
Laffont-Dantras, Lydia and Jday, Rawen and
Lacaze, Jacques An electron microscopy study of graphite growth in
nodular cast irons. (2018) Metallurgical and Materials Transactions
A, vol. 49 (n° 4). pp. 1287-1294. ISSN 1073-5623
Any correspondence concerning this service should be sent to the repository
administrator: [email protected]
An Electron Microscopy Study of Graphite Growth in
Nodular Cast Irons
L. LAFFONT, R. JDAY, and J. LACAZE
Growth of graphite during solidification and high-temperature solid-state transformation has been investigated in samples cut out from a thin-wall casting which solidified partly in the stable (iron–graphite) and partly in the metastable (iron–cementite) systems. Transmission electron microscopy has been used to characterize graphite nodules in as-cast state and in samples having been fully graphitized at various temperatures in the austenite field. Nodules in the as-cast material show a twofold structure characterized by an inner zone where graphite is disoriented and an outer zone where it is well crystallized. In heat-treated samples, graphite nodules consist of well-crystallized sectors radiating from the nucleus. These observations suggest that the disoriented zone appears because of mechanical deformation when the liquid contracts during its solidification in the metastable system. During heat-treatment, the graphite in this zone recrystallizes. In turn, it can be concluded that nodular graphite growth mechanism is the same during solidification and solid-state transformation.
https://doi.org/10.1007/s11661-018-4508-4
I. INTRODUCTION
T
HEgrowth mechanism of graphite in nodular cast irons has led to controversial proposals since these materials were discovered in the mid of the last century. In fact, the nodules are constituted of sectors within which the (0002) graphite planes are roughly perpendic-ular to the radius of the nodule (see for example the review by Lux[1]). Accordingly, the apparent growth direction of the nodules is along the c basal direction of graphite and not along the a prismatic direction as is the case for lamellar graphite microstructure. It is generally accepted that crystallographic defects play an important role in graphite growth[2,3]and the most accepted model for spheroidal growth consists in spiral growth around screw dislocations emanating from the nodule center.[4] A very similar model proposed by Double and Hellawell[3]and Miao et al.[5]involves helicoidal growth. Adjacent sectors are separated between each other by high angle boundaries which have often been associated with twin boundaries[6–8] though some more compli-cated cases have also been observed.[9,10] As described below, alternative models have been recently proposed.There has been a renewed interest in spheroidal growth of graphite these last years that at first sight may appear as adding some confusion. While Qing[8] gives support to the screw dislocation mechanism, Amini and Abbaschian[11] claimed that spheroidal growth results from a roughening of the graphite/liquid interface when Stefanescu et al.[12]think demonstrating that the internal structure of graphite spheroids consists in foliated dendrites. This latter model is in fact not so far from the earlier proposal by Double and Hellawell[13] who suggested a mechanism based on repeated nucleation of graphite layers at the outer surface of the spheroids extending along the prismatic direction. This 2-D nucleation growth model would agree with transmission electron microscopy (TEM) observations that the sec-tors in the graphite spheroids are made of blocks elongated along the prismatic direction.[5,8,14–18] Some indirect support of this model has been gained by comparing the overall growth rate of spheroids with the rate of lateral extension of new graphite layers[19] and this has been recently more formally and quantitatively derived.[20]
One of the most striking things concerning spheroidal growth of graphite is that nodular graphite may be obtained by solid-state graphitization of cast irons fully or partly solidified in the metastable systems where the carbon-rich phase is cementite. It is even more aston-ishing that in such a process, the melt must have been submitted to a spheroidizing treatment for giving nodular graphite through graphitization.[21,22]By solid-state graphitization of carbon steels, He et al.[23,24]and Rounaghi et al.[25] observed the formation of small
L. LAFFONT, R. JDAY, and J. LACAZE are with the CIRIMAT, Universite´ de Toulouse, CNRS / INPT / UPS, ENSIACET, 4 Alle´e Emile Monso, 31030 Toulouse, France. Contact e-mail: lydia. [email protected]
graphite nodules. TEM investigation of these nodules showed their outer structure to be similar to that of graphite nodules in cast irons. No similar TEM inves-tigation has been previously reported on graphite in graphitized nodular cast irons.
This study deals with a thin-wall cast iron that presents a mottled structure in the as-cast state, i.e., having solidified partly in the stable system (graphite is the carbon-rich phase) and partly in the metastable one (cementite is the carbon-rich phase). The aim of this study is to compare the structure of graphite nodules formed by precipitation from the liquid and by solid-state graphitization. We first present TEM results of heat-treated samples which show that nodules are constituted of sectors with the c crystallographic direc-tion of graphite oriented radially. Then, we present graphite nodules formed during rapid solidification which completed in the metastable system. In this case, the nodules present a twofold microstructure which is explained in the discussion by mechanical deformation upon solidification completion in the metastable system.
II. EXPERIMENTAL DETAILS
The spheroidal graphite cast iron investigated is the same alloy as used in previous work.[26] It was spheroidized with magnesium and its final composition consisted mainly in 3.77 wt pct C and 1.9 wt pct Si, balance Fe (TableI). The melt was poured in a thin-wall casting in which a commercial Fe–Si inoculant had been added at a level high enough to ensure very high nodule count after graphitization. Four samples were cut from this casting, the first sample was left as-cast while the
others were fully graphitized by heat-treating at 1123 K (850 °C) for 60 minutes, at 1223 K (950 °C) for 20 min-utes and at 1323 K (1050 °C) for 10 minmin-utes and then cooled in air to room temperature.
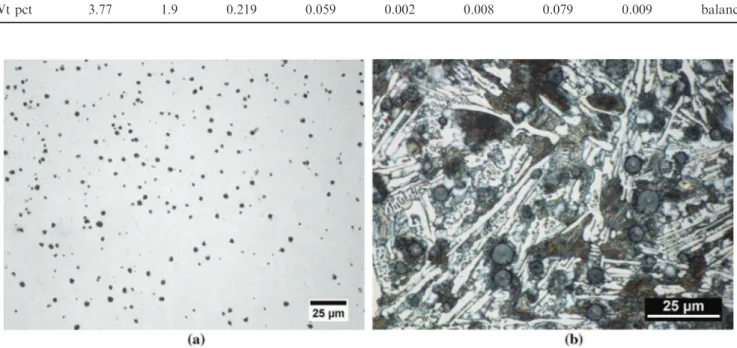
All four samples were then cut to give sections perpendicular to their surface which were first prepared by standard metallographic methods for observation with light microscopy. Figures1(a) and (b) show the as-cast sample before and after etching with Nital 4 pct. In Figure1(a), numerous small nodules are seen which have a maximum diameter of 6 to 7 lm. Figure1(b) shows that most of the as-cast microstructure consists in ledeburite, meaning that graphite precipitation was interrupted when the bulk liquid solidified in the metastable system.
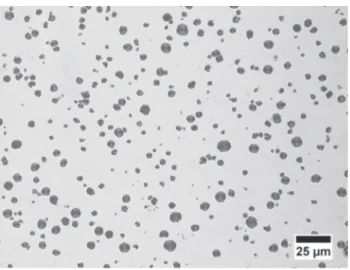
Figure2illustrates the microstructure of the samples after heat-treatment. The nodules are more numerous than in the as-cast state and the largest ones have grown up to a diameter of 9 to 11 lm. All three heat-treated samples were fully graphitized, i.e., no cementite could be detected on the observed metallographic sections.
For transmission electron microscopy (TEM) obser-vations, the four sections were polished down to 70 to 90 lm, and then discs of 3 mm in diameter were stamped, dimpled, and thinned by ion-milling to trans-parency with a low-angle (0 to 10 deg) precision ion-beam polishing system (PIPS). This operation is difficult for spheroidal graphite cast iron because of the considerable difference in the milling rate between graphite nodules and the surrounding matrix. Accord-ingly, one other as-cast TEM specimen was prepared using the focused ion beam-lift out technique in a HELIOS 600i focused ion beam (FIB) scanning electron microscope (SEM). This preparation technique was
Table I. Chemical Composition of the Studied Cast Iron (Weight Percent)
Element C Si Mn P S Mg Cu Al Fe
Wt pct 3.77 1.9 0.219 0.059 0.002 0.008 0.079 0.009 balance
chosen because it enables precision cross-sectioning at pre-defined location. Unlike PIPS which leads to spec-imens with limited electron transparent areas, FIB sectioning facilitates uniform thinning thus producing relatively large specimens for TEM investigation. Imag-ing was performed usImag-ing a JEOL JEM 2100F electron microscope operated at 200 kV. Diffraction patterns were recorded using selected area electron diffraction (SAED) mode with a 250 nm aperture or by Fourier transform of high-resolution TEM (HRTEM) images. During TEM examination, care was taken for minimiz-ing the time durminimiz-ing which the beam was focused on the observed areas to avoid graphite amorphization. This was particularly needed when electron diffraction pat-terns had to be recorded.
III. RESULTS
A. Heat-Treated Samples
Nodules of the samples of heat-treated materials, at 1123 K (850 °C) for 60 minutes, 1223 K (950 °C) for 20 min, and 1323 K (1050 °C) for 10 minutes, respectively, show a microstructure illustrated in Figure3. The presence of sectors emanating from the center and expanding towards the periphery is clearly noticed for all heat-treated samples, and this result was confirmed with all observed nodules. In Figure3(b), a nucleus less than 1 lm in diameter is also seen.
Figure 4(a) is a higher magnification electron micro-scopy image of the bottom left part of the nodule in Figure3(c). The radial structure of the graphite con-sisting in conical sectors is even better seen here. Within the sectors, SAED patterns revealed that the c axes of graphite are oriented radially, i.e., roughly parallel to the spheroid’s radius in each sector. This is illustrated by the SAED pattern superimposed to Figure4(a) which corresponds to the circle in the micrograph. Further, a faceted nucleus could be identified which is delineated with the interrupted line. In Figure4(b), a HRTEM lattice fringe image taken at the interface between the nucleus and graphite (location marked with a square in Figure4(a)) shows relatively straight fringes which are characteristic of a highly graphitic material.
B. As-cast Sample
Figure 5 shows a photomontage of a diametric section of a graphite nodule whose diameter is about 6.5 lm. On the outer part of the nodule, conical sectors radiating from the nodule center are observed which are similar to those seen above on heat-treated samples. A faceted nucleus is also observed at the nodule center. However, between the nucleus and the periphery of the nodule, the graphite structure did not appear well-de-fined. The transition between this inner zone and the well-crystallized outer zone is shown in Figure5 with a dotted line. The inner zone has a thickness of about 1.5 to 2 lm.
Fig. 2—Optical micrograph of the sample heat treated at 1223 K (950 °C) for 20 min.
Fig. 3—Bright field images of graphite nodules of samples heat-treated (a) at 1123 K (850 °C) for 60 min, (b) 1223 K (950 °C) for 20 min, and (c) 1323 K (1050 °C) for 10 min, respectively.
zone (location 3), i.e., as small crystals randomly twisted along the c direction. The HRTEM image from location 4 presents two growth blocks with perfect stack of graphene over about 40 nm (top right and bottom left of the image) separated by a small area of disorientation very much alike previous observation.[27]To summarize, the inner zone thus consists in disordered graphite while the outer zone is well crystallized. It is of particular interest to notice that the bright diffuse ring of the SAED pattern in location 1 (inner zone) appears elongated and not perfectly round suggesting that the graphite in the inner zone has been deformed.
The transition between the inner and outer zones was investigated on a thin foil prepared with FIB technique. Figure6 shows an interface clearly defined by the difference in contrast between the inner zone (left side of the image) which presents a rippled arrangement of (0002) graphene layers and the outer zone (right side of the image) where the graphene layers are straight (0002) planes with few defects which are characteristic of highly graphitic material. The inset presents an enlargement of the boundary zone in the location marked with an interrupted line in the image. On the left side that corresponds to the inner zone, defects in the piling up of graphene are observed which appear very similar to grain boundary defects.
IV. DISCUSSION
Graphite in nodules of the as-cast material presents a twofold crystalline structure: (i) small intricate and disoriented crystals in the inner zone close to the nucleus; and (ii) a more usual piling up of highly crystalline growth blocks arranged in sectors in the outer part of the nodules. The SAED patterns in the inner zone are oblong which indicates that graphite got deformed during the casting process. Similar oblong rings to those reported here may be seen in the work by Hara et al.[28]The most probable cause for this is when the liquid around the graphite nodules solidified in the metastable system as this is related to a contraction of about 4 to 5 pct.[29]Such a contraction leads to graphite nodules being stressed in compression.
A simple elastic and isotropic 3D model was built of a graphite nodule with an outer diameter of 5 lm having a soft center 1 lm in diameter. This soft center may represent the nucleus and/or the nucleus/graphite inter-face. The nodule was strained inwards by 4 pct in volume at its outer surface. Graphite was assumed to have isotropic properties, a Young’s modulus of 10 GPa and a Poisson’s coefficient of 0.25[30] while the center had a Young’s modulus 100 times lower and the same Poisson’s coefficient. Figure7 shows that von Mises stress—which gives an indication of the deviatoric stress level leading to plastic deformation—increases strongly close to the soft center. Ze Liu et al.[31] reported literature values for the shear strength of crystalline graphite varying from 0.2 MPa to 7.0 GPa. Their own experiments on graphite single crystal led to 0.14 GPa which is represented with the horizontal dotted line in Figure7and would lead to a sheared inner zone of 0.2
250 nm
5 nm
nucleus
0002 0004 0002 1010 1120 -(a) (b)Fig. 4—(a) Higher magnification bright field image seen in Figure3(c) with SAED pattern (in inset) corresponding to the open circle; (b) HRTEM image corresponding to the square in image (a) and showing the interface between the nucleus and graphite.
The difference in the graphite structure in the inner and outer zones is illustrated with the SAED patterns (labeled 1 and 2) and the HRTEM images (labeled 3 and 4) recorded at the corresponding locations marked in the micrograph. The SAED pattern in location 1 shows diffuse rings which reflections which are in good agreement with one of the reported hexagonal compact graphite structures (JCPDS 065-6212). The SAED pattern in location 2 presents well-defined spots repre-senting (0002) reflections aligned roughly parallel to the nodule’s radius. HRTEM lattice fringe images show that the graphene layers are distorted and rippled in the inner
is an artefact and its observation cannot be considered for assuming the growth mechanism of graphite in cast irons differs in early and late stages of spheroids development. Furthermore, as clearly stated by Hara et al.,[28] this disoriented graphite is not amorphous as sometimes suggested.[32]
From the above discussion, the growth mechanism of graphite during the stage corresponding to the forma-tion of the inner zone cannot be settled. However, previous studies showed graphite forming sectors right at the nucleus surface.[5,14–16]It is thus tempting to claim that the growth mechanism of nodular graphite from the
0002 0004 0006
2
4
3
5 nm 5 nmmatrix
0.5 µm outer zone 3 2 inner zone 1 41
0002 0004 -0006 -0002 1010 1120-Fig. 5—Bright field TEM photomontage of a graphite nodule of the as-cast sample; SAED patterns corresponding to the open circles numbered 1 and 2 in the image; HRTEM lattice fringe images corresponding to the squares numbered 3 and 4 in the image.
lm in thickness. As seen with the interrupted line, an inner zone of 1 lm in thickness would be obtained for a graphite shear strength of 14 MPa which seems reason-able for polycrystalline graphite as is the case of nodules in cast irons.
This simple calculation thus confirms the possibility for metastable solidification to induce significant defor-mation to the inner part of the graphite nodules. This analysis is also supported by the fact that the plasmon energy of p and p+r has been found identical in the outer and inner zones of the investigated nodule as described in appendix. Accordingly, the disoriented zone
the microcrystalline disoriented inner zone resulting from the casting process has recrystallized during heat-treatment. This is not really surprising as disorder is associated with higher free energy that heat-treatment helps relaxing. As a matter of fact, it is known that pyrolysis carbon gets more and more structured with heat-treatment at higher and higher temperatures,[33] with rearrangement of carbon atoms starting at 1173 K to 1273 K (900 ° to 1000 °C) and full crystallization proceeding above 2273 K (2000 °C).
There remain two questions that the present study did not answer to and which are under study. The first one relates to the role of the austenite envelop that forms around graphite nodules during the stable eutectic transformation as this phase has quite a high capability for plastic deformation. It would thus be of interest to cast samples at an intermediate cooling rate, low enough so that nodules would be enveloped with austenite but high enough for solidification to complete in the metastable system. The absence of an inner zone with microcrystalline structure in such a case would be a further indication that there was no change in the graphite growth process during solidification from the liquid. The second question deals with kinetics of graphite recrystallization during solid-state treatment. A quantitative study of this kinetics could help deciding if such recrystallization could take place during solidi-fication provided the cooling rate is low enough.
V. CONCLUSION
This study presents the microstructure of graphite nodules in a cast iron that had solidified partly in the stable system and partly in the metastable one. Nodules have been observed in both the as-cast state and after solid-state graphitization of the material. The results reveal that nodules in as-cast material show a twofold structure consisting of a well-crystallized outer zone and a distorted and disoriented inner zone. During heat-treatment, the graphite in the inner zone recrystal-lized and showed well-crystalrecrystal-lized sectors radiating outwards from the nucleus. It thus appears that the formation of this inner zone in the as-cast material resulted from a mechanical deformation when the liquid contracted during metastable solidification. These results highlight that the growth mechanism of spher-oidal graphite could be the same when nodules precip-itate directly from the liquid during solidification or precipitate by cementite decomposition during solid-state heat-treatment in the austenitic field. They also show the capability for graphite to recrystallize during heat-treatment of mottled structures.
ACKNOWLEDGMENT
We are pleased to acknowledge D. Poquillon for
calculations performed with CASTEM software
(Figure7). FIB preparation was performed by C. Josse
5 nm
Fig. 6—HRTEM image at the interface between inner (left part of the image) and outer (right part of the image) zones delimited by a dotted line; in inset enlarged view corresponding to the dashed square in the image.
Fig. 7—Evolution of the von Mises stress in a graphite nodule strained inwards by 4 vol pct at its outer surface. The center is a material 100 times softer than graphite.
liquid was by piling up of growth blocks in sectors starting right on the nucleus, and that this is the mechanical deformation due to the final solidification in the metastable system which induced a change in the crystalline structure of the inner part of the as-cast nodules.
After full solid-state graphitization, all the observed graphite nodules presented the usual structure consisting of sectors emanating from the nucleus in which graphite blocks are piled up on each other. This implies first that
at the UMS-Raimond Castaing service in Toulouse who is warmly thanked.
APPENDIX
The EELS study was performed using a JEOL ARM 200F equipped with a Schottky FEG, a Cs-corrector of the probe and a Gatan Imaging filter (GIF) QUAN-TUM spectrometer. This TEM was operated at 200 kV with an energy resolution of 0.1 eV per channel, giving an EELS zero loss peak energy resolution of around 0.6 eV. Low-loss spectra were collected at the outer and inner zones of the nodule of the as-cast sample in TEM-diffraction mode with a probe size of 100 nm. With a convergence angle of 29.6 mrd and a 2.5-mm spectrometer entrance aperture, the camera length of 30 cm gave a scattering angle of 3 mrd with a collection angle of 29.75 mrd. For each acquired spectrum, deter-mination of peak positions was achieved by taking the first derivative of the spectrum. The acquisition of the low-loss spectra followed the same procedure as previ-ously described.[34,35]
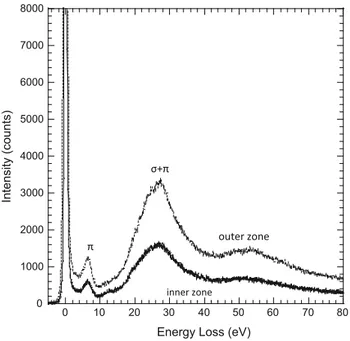
FigureA1 presents two representative low-loss spec-tra without Fourier-log deconvolution collected from the outer and inner zones of the nodule seen in Figure5
with the zero energy loss position corrected. In either zone, the characteristic plasmon energy related to the excitation of p and p + r are defined at the same peak energy positions of 6.5 and 26.70 eV, respectively. The plasmon spectra collected from the outer zone are symmetrical whilst those collected from the inner zone present an asymmetry, as a result of a significant increase in intensity on the lower energy side of the plasmon peak. This asymmetry may arise from inter-band transitions, or possibly from the presence of
magnesium oxide within the nodule. As a matter of fact, the plasmon energy of MgO is at 22.6 eV and a contribution to asymmetry may arise from MgO in the graphite with a higher concentration in the inner than in the outer zone. However, magnesium oxide may be detected at the inner zone but no significant signal of EELS Mg–K core–edge spectrum was obtained, pre-sumably due the magnesium concentration was below the core-loss detection limit of Mg using EELS (1 to 2 at. pct). The same asymmetric EELS spectra have been previously reported[24]and have been suggested to be due to the presence of iron.
REFERENCES
1. B. Lux: AFS Cast Metals Res. J., 1972, vol. 8, pp. 25–39. 2. I. Minkoff and B. Lux: in The Metallurgy of Cast Iron, B. Lux, I.
Minkoff, and F. Mollard, eds., Georgi Publishing Company, St. Saphorin, 1975, pp. 473–91.
3. D.D. Double and A. Hellawell: Acta Metal., 1974, vol. 22, pp. 481–87.
4. M. Hillert and Y. Lindblom: J. Iron Steel Inst., 1954, vol. 148, pp. 388–90.
5. B. Miao, D.O. Northwood, W. Bian, K. Fang, and M.H. Fan: J. Mater. Sci., 1994, vol. 29, pp. 225–61.
6. I. Minkoff: The Physical Metallurgy of Cast Iron, 1st ed., Wiley, Chichester, 1983, pp. 102–33.
7. G. Faivre: Adv. Mater. Res., 1997, vols. 4–5, pp. 17–30. 8. J. Qing, V.L. Richards, and D.C. Van Aken: Carbon, 2017,
vol. 116, pp. 456–69.
9. J. Lacaze, K. Theuwissen, L. Laffont, and M. Ve´ron: IOP Conf. Ser. Mater. Sci. Eng., 2016, vol. 117, p. 012024.
10. PhD dissertation, Missouri S&T, 2016.http://scholarsmine.mst. edu/doctoral_dissertations/2489/, accessed November 26, 2016. 11. S. Amini and R. Abbaschian: Carbon, 2013, vol. 51, pp. 110–23. 12. D.M. Stefanescu, G. Alonso, P. Larranaga, E. De la Fuente, and
R. Suarez: Acta Mater., 2016, vol. 107, pp. 102–26.
13. D.D. Double and A. Hellawell: Acta Metal. Mater., 1995, vol. 43, pp. 2435–42.
14. K. Theuwissen, M.C. Lafont, L. Laffont, B. Viguier, and J. Lacaze: Trans. Indian Inst. Met., 2012, vol. 65, pp. 627–31. 15. K. Theuwissen, J. Lacaze, M. Veron, and L. Laffont: Mater.
Charact., 2014, vol. 95, pp. 187–91.
16. K. Theuwissen, J. Lacaze, and L. Laffont: Carbon, 2016, vol. 96, pp. 1120–28.
17. J.P. Monchoux, C. Verdu, G. Thollet, R. Fouge`res, and A. Reynaud: Acta Mater., 2001, vol. 49, pp. 4355–62.
18. D. Li, R. Tan, J. Gao, B. Wei, Z. Fan, Q. Huang, and K. He: Carbon, 2017, vol. 111, pp. 428–38.
19. R. Ghergu, L. Magnusson A˚berg, and J. Lacaze: Mater. Sci. Forum, 2014, vols. 790–791, pp. 435–40.
20. J. Lacaze, J. Bourdie, and M.J. Castro-Roman: Acta Mater., 2017, vol. 134, pp. 230–35.
21. J. Fargues and J.C. Margerie: Fonderie, 1979, vol. 390, pp. 205–21. 22. G.S. Jayaraman, R.D. Maier, and J.F. Wallace: AFS Trans., 1979,
vol. 87, p. 299.
23. K. He, A. Brown, R. Brydson, and D. Edmonds: J. Mater. Sci., 2006, vol. 16, pp. 5235–41.
24. K. He, H.R. Daniels, A. Brown, R. Brydson, and D.V. Edmonds: Acta Mater., 2007, vol. 55, pp. 2919–27.
25. S.A. Rounaghi, P. Shayestech, and A.R. Kiani-Rashid: Inter Foundry Res, 2010, vol. 62, pp. 2–7.
26. R. Jday, O. Marsan, J. Bourdie, L. Laffont, F. Bruneseaux, and J. Lacaze: Trans. Indian Inst. Met., 2015, vol. 68, pp. 1071–74. 27. B. Miao, K. Fang, W. Bian, and G. Liu: Acta Metal. Mater., 1990,
vol. 38, pp. 2167–74.
28. T. Hara, T. Kitagawa, K. Kuroki, S. Saikawa, K. Terayama, S. Ikeno, and K. Matsuda: Mater. Trans., 2014, vol. 55, pp. 1500–05. 29. E. Roy: Cast Iron Technology, Butterworth and Co., Ltd.,
Brisbane, 1988. 0 1000 2000 3000 4000 5000 6000 7000 8000 0 10 20 30 40 50 60 70 80
Energy Loss (eV)
Intensity (counts)
outer zone π
inner zone σ+π
Fig. A1—Low-loss spectra composed of the p and r + p plasmon peaks collected at the outer and inner zones of the graphite nodule shown in Fig.5.
30. T. Andriollo and J. Hastel: Mech. Mater., 2016, vol. 96, pp. 138–50. 31. Z. Liu, J. Yang, J.Z. Liu, Y. Yang, and Q. Zheng: Acta. Mech.
Sin., 2012, vol. 28, pp. 978–82.
32. D.M. Stefanescu, G. Alonso, P. Larran˜aga, E. De la Fuente, and R. Suarez: Int. J. Metalcasting, 2012, https://doi.org/10.1007/ s40962-017-0204-1.
33. E. Morinbou, T. Kenji, I. Susumu, K. Kiyoharu, S. Minoru, and W.K. Harold: Phys. Chem. Solids, 1993, vol. 54, pp. 1841–48. 34. L. Laffont, M. Monthioux, and V. Serin: Carbon, 2002, vol. 40,
pp. 767–80.
35. H.R. Daniels, A. Brown, A. Scott, T. Nichells, B. Rand, and R. Brydson: Philos. Mag., 2003, vol. 87, pp. 4073–92.