Science Arts & Métiers (SAM)
is an open access repository that collects the work of Arts et Métiers Institute of Technology researchers and makes it freely available over the web where possible.
This is an author-deposited version published in: https://sam.ensam.eu Handle ID: .http://hdl.handle.net/10985/10049
To cite this version :
Habiba BOUGHERARA, Ihab EL SAWI, Zouheir FAWAZ, Fodil MERAGHNI - Investigation and modeling of the fatigue damage in natural fiber composites - 2015
Any correspondence concerning this service should be sent to the repository Administrator : archiveouverte@ensam.eu
Science Arts & Métiers (SAM)
is an open access repository that collects the work of Arts et Métiers ParisTech researchers and makes it freely available over the web where possible.
This is an author-deposited version published in: http://sam.ensam.eu Handle ID: .http://hdl.handle.net/null
To cite this version :
Habiba BOUGHERARA, Ihab EL SAWI, Zouheir FAWAZ, Fodil MERAGHNI - Investigation and modeling of the fatigue damage in natural fiber composites - 2015
Any correspondence concerning this service should be sent to the repository Administrator : archiveouverte@ensam.eu
INVESTIGATION AND MODELING OF THE FATIGUE DAMAGE IN
NATURAL FIBER COMPOSITES
Habiba Bougherara1, Ihab El Sawi1, Zouheir Fawaz2, Fodil Meraghni3
1 Department of Mechanical and Industrial Engineering, Ryerson University, Toronto, ON,
M5B2K3, Canada.
2 Department of Aerospace Engineering, Ryerson University, Toronto, ON, M5B2K3, Canada.
3
LEM3 – UMRCNRS 7239, ARTS ET METIERS ParisTech, Centre de METZ, France Keywords: Thermodynamic-based damage model, Natural fiber composites, Damage evolution.
Abstract
The main objective of this preliminary investigation is to identify and characterize the damage
evolution of angle ply ([±45]16) flax-reinforced epoxy composites using an energy-based damage
model combined with Scanning Electron Microscopy (SEM) observations. The damage model’s parameters for the flax-reinforced epoxy composite were determined from quasi-static and fatigue tests. The preliminary results showed that the energy-based damage model is able predict accurately the damage rate in both longitudinal and transverse directions for loads. The mechanism of damage initiation in the flax/epoxy composites and the damage evolution, during each test, were monitored using SEM. A direct correlation between the microstructure of the flax-reinforced epoxy composites and the damage was obtained.
Introduction
Natural fibers such hemp, jute, and flax have attracted the attention of many researchers because of their potential to substitute synthetic fibers [1–4]. Since, the use of natural fiber composites in structural applications is fairly new, knowing the mechanical behavior of such materials, in particular, the fatigue life and damage accumulation is crucial in designing new natural fiber-based composite structures with high performances.
Unlike most engineering materials which exhibit a safe stress level called fatigue limit (or endurance limit) below which failure does not occur, fiber-reinforced polymer composites (FRPC) do not typically have such limit. Instead, they undergo a damage accumulation due to matrix cracking, delamination, interface fiber/matrix degradation, fiber breakage, etc. This damage accumulation phenomenon takes place during the entire material’s life leading eventually to the progressive failure of the composite even at low applied stresses. The aim of this study is, therefore, to investigate and model the fatigue damage of flax fiber reinforced composites using thermodynamic-based damage model.
Materials and Methods
Flax/epoxy prepreg was purchased from LINEO, Belgium. The product type is a unidirectional (UD) flax fiber treated by a patented sizing and drying process (US Patent No. 8080288) and impregnated with partially cured epoxy resin system (Huntsman LY5150). The flax/epoxy
prepreg has an area density of 180 g/m2 with an epoxy content of 50 % per weight. Flax/epoxy
laminate plates were manufactured using 16 layers of 300 mm X 300 mm sheets with ply [±45]16
orientation and. The material was placed on a plate in a sealed vacuum bagging set-up and cured in an autoclave at 150°C for 2h under 4 bar pressure while a 0.7 bar vacuum was maintained during the entire cure cycle. The tested specimens were 25 mm width, 250 length and 3 mm thickness.
Tension-tension fatigue tests were conducted on a servo-hydraulic MTS test machine equipped with a 100 kN load-cell capacity. Strain measurements were obtained using an extensometer with a 25 mm gage length, placed at the center of all specimens. Fatigue experiments were conducted in accordance with the ASTM standard D3479 at room temperature and under load control with a minimum to maximum stress ratio of 0.1 and a cyclic frequency of 5Hz. The fatigue limit was assumed to be reached for all tests that did not produce fatigue failure after 6 million cycles.
Fatigue damage model formulation
A fatigue damage model is developed through a phenomenological approach in the framework of thermodynamics. Based on the Ladevèze and Le Dantec work [1], the proposed model takes into account the damage stages characterizing the fatigue damage in natural fiber reinforced polymer matrix composites. Indeed, in such materials, the fatigue damage kinetic occurs according to three stages [2]: i) damage initiation corresponding to an important stiffness reduction during the early stage of damage evolution, namely the first thousands of cycles. ii) Coalescence and propagation of micro-cracks. This second stage is characterized by a behaviour accommodation and a relative steady damage evolution reduction. iii) Macroscopic cracks propagation, damage localization up to the final material failure. According to the continuum damage mechanics, the damage is introduced as an internal state variable coupled to elastic behaviour. The proposed damage model has been formulated through five damage variables [3-4] but in the present paper,
only the formulation for in-plane damage involving three variables: d11, d22 and d12 is considered.
Assuming a thin structure (in-plane stress) where s33=0, made of an orthotropic material, elastic
moduli of the damaged material are then expressed as follows:
(
)
(
)
(
)
0 11 11 11 0 22 22 22 0 12 12 12 1 1 1 E E d E E d G G d = − = − = − (1)E11 (resp. E22) is the Young’s modulus in the longitudinal (resp. transverse) direction. G12 is the
in-plane shear modulus. dij are the damage variables associated to the corresponding moduli. The
superscript 0 indicates initial values measured when dij=0.
For a damaged material, the elastic strain energy is dependent on the state variables dij. Then, the
0 0 11 11 11 11 21 22 11 11 11 21 22 12 21 0 0 0 2 22 22 22 22 12 11 22 22 22 12 11 12 12 12 12 21 1 1 (1 ) 2 1 1 1 (1 ) (1 ) 2 1 d W E d E E d E G d ε ε ν ε ε ε ν ε ν ν ε ε ν ε ε ε ν ε γ ν ν + − + − ⎡ ⎤ = ⎣ − + + + ⎦ − ⎡ ⎤ + ⎣ − + + + ⎦+ − − (2)
Where (<A>+) and (<A>-) stand for the positive and negative parts of A, respectively.
The damage affects E11 when ε11+ν ε21 22 is positive and E22 when ε22+ν ε12 11 is positive. For instance, when the composite is subjected to a longitudinal compressive loading, transverse cracks do not initiate damage and thus they don’t have any effects on the damage evolution of the composite.
The dual thermodynamic variables Yij associated with the damage variables dij are deduced from
the elastic strain energy Wd of the damaged material as follows:
Y11= !!Wd !d11 =1 2 1 1!!12!21 E110 !11 !11+"21!22 + " # $ % & ' Y22= !!Wd !d22 =1 2 1 1!!12!21 E220 !22 !22+"12!11 + " # $ % & ' Y12= !!Wd !d12 = 1 2G12 0 !122 (3)
In the present paper, the damage rate describing the damage kinetic with respect to the cycle number and is formulated as a sum of two components:
! d11=!( d11) !( N ) = "11#11 1+#11 Y11
( )
#11$1 + %11( )
Y11 e$ &(11N)(
)
(4) ! d22=!( d22) !( N ) = "22#22 1+#22( )
Y22 #22$1 + %22( )
Y22 e$ &(22N)(
)
(5) ! d12=!( d12) !( N ) = "12#12 1+#12( )
Y12 #12$1 + %12( )
Y12 e$ &( 12N)(
)
(6)The first contribution, scaled by (Yij)βij-1 in equations (4) to (6), is derived from the Norton power
law that describes the dissipation potential. The second component is introduced to describe the
rapid stiffness reduction occurring during the cyclic loading. The state variables dij(N) are
obtained by numerical integration of the damage rates, with the initial conditions dij(N=0)=dqsij.
Where dqs stands for the initial damage induced during the first loading ramp prior to the cyclic
t 0 5 10 15 20 25 30 35 40 45 50 0 0.5 1 1.5 2 2.5 3 3.5 4 4.5 5 1/f σmax σmin σ R=σmin / σmax Static preloading ramp Cyclic loading S
The developed fatigue damage model requires 12 parameters to be identified namely, four parameters per damage variable. In this work, the model is developed for tension-tension fatigue loading and hence 4 parameters have to be identified.
Fig. 1. Load history obtained from a force controlled fatigue test. Note that quasi-static
pre-loading ramp (prior to the point S) gives rise to an initial damage representing the quasi-static
damage (denoted by dqs).
Model damage parameters identification procedure
An identification method involving homogeneous tensile fatigue tests have been used to determine the longitudinal damage parameters. The goal is to identify the parameters involved in
the damage evolution, for the longitudinal direction (α11, β11, λ11 and δ11 governing the damage
d11). For this purpose, load control tension-tension fatigue tests on composite specimens have
been performed in longitudinal direction [2]. These fatigue tests have been carried-out at three
stress levels: σmax =65% σUTS, σmax =70% σUTS and σmax =80% σUTS. The applied stress ratio
R=σmin/σmax remains constant for the different configuration (R=0.1) and the frequency was fixed
up to 5Hz.
The identification procedure relies on a cost function S(P) that has been built as an objective function representing, in the least squares sense, the difference between experimental and computed damage values. It has been minimized using the gradient-based Levenberg-Marquart (LM) algorithm [5-7] which can be written as follows:
( )
( )
(
)
2 1 2 1 a exp num i i i a exp i i d P d S P d = = ⎡ − ⎤ ⎣ ⎦ =∑
∑
(7)Where a is the number of experimental data. exp
i
d denotes the experimental damage values
determined using the dynamic modulus reduction curve (Fig. 3) : exp 1 0
i i
d = −E ( N ) / E . dinumare
the computed damage values predicted by the developed model. P is the unknown parameter vector that contains the model parameters (α11, β11, λ11, δ11).
The minimisation of the cost function consists of an iterative procedure. At each step, a new solution increment ΔP is computed using the LM algorithm and the solution vector P is then re-estimated (P becomes P +ΔP) and the cost function S is re-evaluated. The iterative procedure is stopped once two consecutive values of the cost function satisfy the relationship below (namely, when the cost function becomes stationary [8-9]).
(
)
( )
105S P P S P −
+ Δ − ≤
The damage parameters (α11, β11, λ11, δ11) were identified using experimental data obtained from
the fatigue test corresponding to σmax =70% σUTS and are summarized in Table 1.
Table 1. Damage model parameters identified from experimental fatigue tests at σmax =70% σUTS.
Parameters α11 β11 λ11 δ11
[±45]4s Flax epoxy composite 2.51E-3 5.6 3.95E-3 2.21E-2
Results and discussion
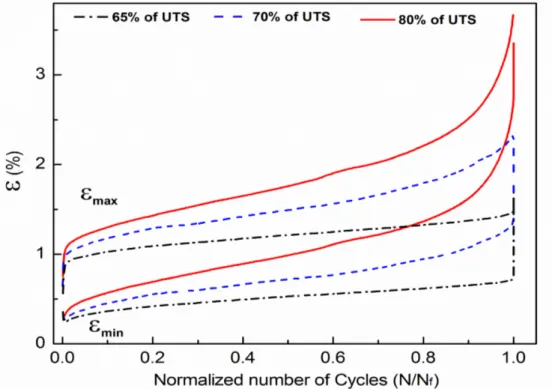
The maximum and minimum strains for [±45]4S angle ply laminates are presented in Fig. 2. As
can be seen, the strain increases rapidly in the early part of the test, and then it increases with a constant slope followed by an acceleration of the strain before failure. The analysis of the SEM images shows a very good concordance between the evolution of the cracks inside the composite and the increase of the strain (see Fig. 5).
Fig. 2. Mean and maximum strain versus the normalized number of cycles for angle ply laminates
The normalized dynamic modulus (E*/E0) was determined for [±45]4S angle ply composite laminates at different applied stress levels by calculating the slope of the linear part of the strain
vs. stress curve at each cycle. The normalized dynamic modulus for [±45]4S laminates are plotted
against the normalized number of cycle (Cycle N / total cycles to failure Nf) and presented in
Fig. 3. The normalized dynamic modulus was found to decrease with number of cycles until
failure according to three stages. In stage 1, rapid stiffness degradation was observed during the first thousands of cycles, followed by (stage 2) a progressive decrease of the dynamic modulus
during almost the entire life of the laminate (more than 80% N/Nf). In the third stage, accelerated
stiffness reduction leading to the total material failure was observed.
Fig. 3. Normalized dynamic modulus (E*/E0) versus the normalized number of cycles for angle ply laminates at different loading conditions.
The S-N curve and the high cyclic fatigue strength (HCFS) of [±45]4S angle ply flax/epoxy
composite laminates were determined using stepwise loading fatigue tests. The stress (in terms of % of the ultimate tensile strength (UTS) as a function of the number of cycles to failure is shown in Fig. 4. The HCFS (or endurance limit) of angle ply composite laminates varies between 57% and 59% of UTS. A comparable value determined using infrared thermography
was reported previously [2]. The failure of the [±45]4S composite laminates occurred at 85% of
Fig. 4. S-N curve showing HCFS for [±45]4S laminates
SEM observations at 80% of UTS for [±45]4S angle ply composite laminate distinguished three
main fatigue micro-damage mechanisms (Fig. 5). At the beginning of cycling (i.e., 1/3 N/Nf), the
micro-cracks initiated inside the bundle of flax fibers bonded together by pectin, then these
micro-cracks nucleate inside the bundles between fibers. With the increased loading (2/3 N/Nf),
the cracks continue to grow slightly and propagate inside the bundle (from one end to the other) without further propagating in the matrix rich area. At the total failure of the laminate the micro-cracks appear to have further grown in the bundles with subsequent propagation in the matrix and the number of cracks (or density of crack) is considerable.
Fig. 5. SEM images for [±45]4S angle ply laminates at 80% UTS load at (a) the beginning of
cycling (1/3 of Nf) and b) just before failure
For the fatigue damage model proposed, the set of the damage parameters identified through the
inverse procedure from experimental fatigue tests performed at σmax =70% σUTS were included
into the fatigue damage model to predict the damage evolution for different applied stress levels
of σmax=65% σUTS and σmax =80% σUTS. The comparison between experimental data used for the
identification strategy and the computed damage curves are presented on Fig.6. One can note that a good correlation between experimental and computed damage evolutions is obtained for
both stress levels notably for the fatigue test at σmax=65% σUTS. This demonstrates that the
proposed model is thus able to take into account the damage evolution of angle ply [±45]4s flax
fiber-reinforced polymer laminates under cyclic loading. However, it is worth noting that for
fatigue tests at σmax =80% σUTS and for a number of cycles up to 70% of Nf, the model predictions
do not fit the experimental damage curve. This is mainly due to the damage localization phenomenon occurring once macroscopic cracks propagate till the final failure of the composite material. In fact, SEM observations (Fig. 5) showed that for high-applied stress level (up to
80% σUTS) and high fatigue life (up to 70% of Nf), a significant increase of the crack density was
observed in the composite specimens which in turn may lead to a dramatic damage accumulation and a rapid reduction in the composite’ stiffness leading to the total failure of the composite laminate.
Fig. 6. Comparison between experimental and computed damage evolution for tension-tension
fatigue tests at different loading levels. Predicted damage curves agree well with experimental results as long as the damage remains diffuse. No damage localization phenomenon occurs up to 70% of fatigue life.
The evolution of the longitudinal damage rate versus the normalized number of cycles is plotted in Fig.7. Because the damage rate values for 80% load of UTS are 10 times higher than those for 65% and 70% load of UTS, two different scales were used for a better presentation of the damage rate. As can be seen, the damage rates increased slightly with a constant slope for loads below or equal 70% of UTS and it increased drastically for high loads up to 80% of UTS. As it was mentioned before, this can be explained by the fact that the damage remains diffuse for low and and moderate loads leading to a steady stable damage rate. However, for high loads and
high fatigue life (up to 70% of N/Nf), the damage and the damage rate are more pronounced due
to the coalescence of the cracks.
Fig. 7.Damagerateevolutionasafunctionofthenormalizednumberofcycles(N/Nf)
Conclusion
In this investigation, we have demonstrated that the thermodynamic-based damage model can
capture the damage evolution and its rate in [±45]4S angle ply composite laminates as long as the
damage remains diffuse. Based on the fatigue tests and SEM observations, the damage in flax/epoxy laminates initiates in a form of micro-cracks inside the fiber bundles between fiber-fiber interfaces suggesting that the bonding resin is the weakest part in the flax/epoxy composite. These micro-cracks propagate through the interface between the elementary fibers within the bundles during cyclic loading leading to the formation of macroscopic cracks and the progressive failure of the flax composite.
Reference
1. Ladevèze P., Le Dantec E., Damage modelling of the elementary ply for laminated composites, Composites Science and Technology; Vol. 43 (1992); pp.257-67.
2. El Sawi I., Fawaz Z., Zitoune R. and Bougherara H., An investigation of the damage mechanisms and fatigue life diagrams of flax fiber-reinforced polymer laminates Journal of Materials Science, Vol. 49 (2014); pp. 2338–2346.
3. Nouri H., Meraghni F. and Lory P., Fatigue damage model for injection-molded short glass fibre reinforced thermoplastics; International Journal of Fatigue Vol. 31 (2009); pp.934-942. 4. Nouri H, Czarnota C, Meraghni F. Experimental parameters identification of fatigue damage
model for short glass fiber reinforced thermoplastics GFRP. Design and modeling of mechanical systems. Lecture notes in mechanical engineering. Berlin, Heidelberg: Springer Berlin Heidelberg; 2013. pp. 523–30.
5. Mahnken, R. and Stein, E. Parameter identification for viscoplastic models based on analytical derivatives of a least-squares functional and stability investigations, International Journal of Plasticity, Vol. 12(1996); pp.451-479.
6. Marquardt, D.W., An algorithm for least-squares estimation of nonlinear parameters. Journal of the Society for Industrial and Applied Mathematics Vol. 11-2 (1963); pp. 431-441.
7. Levenberg, K., A method for the solution of certain Non-Linear problem in least squares. The Quarterly of Applied Mathematics, Vol. 2 (1944); pp. 164-168.
8. Meraghni, F., Nouri, H., Bourgeois, N., Czarnota, C. and Lory, P., Parameters identification of fatigue damage model for short glass fiber reinforced polyamide (PA6-GF30) using digital image correlation. Procedia Engineering, Vol. 10 (2011); pp. 2110-2116.
9. Meraghni F., Chemisky Y., Piotrowski B., EchchorfI R., Bourgeois N., Patoor E. Parameter identification of a thermodynamic model for superelastic shape memory alloys using analytical calculation of the sensitivity matrix. European Journal of Mechanics A/Solids Vol. 5, (2014), pp. 226-23.


![Fig. 4. S-N curve showing HCFS for [±45] 4S laminates](https://thumb-eu.123doks.com/thumbv2/123doknet/7414871.218539/9.918.205.749.84.512/fig-s-n-curve-showing-hcfs-s-laminates.webp)


