SOFTWARE TRACING COMPARISON USING DATA MINING TECHNIQUES
ISNALDO FRANCISCO DE MELO JUNIOR
DÉPARTEMENT DE GÉNIE INFORMATIQUE ET GÉNIE LOGICIEL ÉCOLE POLYTECHNIQUE DE MONTRÉAL
MÉMOIRE PRÉSENTÉ EN VUE DE L’OBTENTION DU DIPLÔME DE MAÎTRISE ÈS SCIENCES APPLIQUÉES
(GÉNIE INFORMATIQUE) AOÛT 2017
c
ÉCOLE POLYTECHNIQUE DE MONTRÉAL
Ce mémoire intitulé:
SOFTWARE TRACING COMPARISON USING DATA MINING TECHNIQUES
présenté par: DE MELO JUNIOR Isnaldo Francisco
en vue de l’obtention du diplôme de: Maîtrise ès sciences appliquées a été dûment accepté par le jury d’examen constitué de:
M. GAGNON Michel, Ph. D., président
M. DAGENAIS Michel, Ph. D., membre et directeur de recherche M. ALOISE Daniel, Doctorat, membre
DEDICATION
to God. to Jesus. to my Mother.
"Maria, Maria É o som, é a cor, é o suor É a dose mais forte e lenta De uma gente que ri Quando deve chorar E não vive, apenas aguenta" Milton Nascimento
"Maria, Maria It is the sound, the color, and the sweat The slowest and strongest dosage Of the ones that laugh When they should cry They do not live, endure instead
A chi bene crede, Dio provvede. To the ones that really believe, God will provide. Italian Proverb.
ACKNOWLEDGEMENTS
I would like to thank all those who have supported me during my graduate studies, especially Professor Michel Dagenais, who gave me his support and advice for this research.
I acknowledge all my committee members: Professor Michel Gagnon and Professor Daniel Aloise to evaluate my research contributions.
Also, I would like to thank my colleagues at the DORSAL laboratory, for their valuable comments on my development. They have helped making my journey possible with their precious comments and considerations.
Special thanks to Gabriel A., Leticia R, and uncle Nacib Asseff, for their tremendous support during my studies and help in the several challenges faced.
I also would like to praise the Ecole Polytechnique de Montreal and the department of Computer and Software Engineering for giving me the opportunity of studying and working here.
Last but not least, I would like to acknowledge my mother, Maria Pereira de Assis, for her imperative support throughout my journey. Infinitude.
RÉSUMÉ
La performance est devenue une question cruciale sur le développement, le test et la main-tenance des logiciels. Pour répondre à cette préoccupation, les développeurs et les testeurs utilisent plusieurs outils pour améliorer les performances ou suivre les bogues liés à la per-formance.
L’utilisation de méthodologies comparatives telles que Flame Graphs fournit un moyen formel de vérifier les causes des régressions et des problèmes de performance. L’outil de comparai-son fournit des informations pour l’analyse qui peuvent être utilisées pour les améliorer par un mécanisme de profilage profond, comparant habituellement une donnée normale avec un profil anormal.
D’autre part, le mécanisme de traçage est un mécanisme de tendance visant à enregistrer des événements dans le système et à réduire les frais généraux de son utilisation. Le registre de cette information peut être utilisé pour fournir aux développeurs des données pour l’analyse de performance. Cependant, la quantité de données fournies et les connaissances requises à comprendre peuvent constituer un défi pour les méthodes et les outils d’analyse actuels. La combinaison des deux méthodologies, un mécanisme comparatif de profilage et un système de traçabilité peu élevé peut permettre d’évaluer les causes des problèmes répondant également à des exigences de performance strictes en même temps. La prochaine étape consiste à utiliser ces données pour développer des méthodes d’analyse des causes profondes et d’identification des goulets d’étranglement.
L’objectif de ce recherche est d’automatiser le processus d’analyse des traces et d’identifier au-tomatiquement les différences entre les groupes d’exécutions. La solution présentée souligne les différences dans les groupes présentant une cause possible de cette différence, l’utilisateur peut alors bénéficier de cette revendication pour améliorer les exécutions.
Nous présentons une série de techniques automatisées qui peuvent être utilisées pour trouver les causes profondes des variations de performance et nécessitant des interférences mineures ou non humaines. L’approche principale est capable d’indiquer la performance en utilisant une méthodologie de regroupement comparative sur les exécutions et a été appliquée sur des cas d’utilisation réelle. La solution proposée a été mise en œuvre sur un cadre d’analyse pour aider les développeurs à résoudre des problèmes similaires avec un outil différentiel de flamme.
À notre connaissance, il s’agit de la première tentative de corréler les mécanismes de re-groupement automatique avec l’analyse des causes racines à l’aide des données de suivi. Dans ce projet, la plupart des données utilisées pour les évaluations et les expériences ont
été effectuées dans le système d’exploitation Linux et ont été menées à l’aide de Linux Trace Toolkit Next Generation (LTTng) qui est un outil très flexible avec de faibles coûts généraux.
ABSTRACT
Performance has become a crucial matter in software development, testing and maintenance. To address this concern, developers and testers use several tools to improve the performance or track performance related bugs.
The use of comparative methodologies such as Flame Graphs provides a formal way to ver-ify causes of regressions and performance issues. The comparison tool provides information for analysis that can be used to improve the study by a deep profiling mechanism, usually comparing normal with abnormal profiling data.
On the other hand, Tracing is a popular mechanism, targeting to record events in the system and to reduce the overhead associated with its utilization. The record of this information can be used to supply developers with data for performance analysis. However, the amount of data provided, and the required knowledge to understand it, may present a challenge for the current analysis methods and tools.
Combining both methodologies, a comparative mechanism for profiling and a low overhead trace system, can enable the easier evaluation of issues and underlying causes, also meeting stringent performance requirements at the same time. The next step is to use this data to develop methods for root cause analysis and bottleneck identification.
The objective of this research project is to automate the process of trace analysis and au-tomatic identification of differences among groups of executions. The presented solution highlights differences in the groups, presenting a possible cause for any difference. The user can then benefit from this claim to improve the executions.
We present a series of automated techniques that can be used to find the root causes of per-formance variations, while requiring small or no human intervention. The main approach is capable to identify the performance difference cause using a comparative grouping method-ology on the executions, and was applied to real use cases. The proposed solution was implemented on an analysis framework to help developers with similar problems, together with a differential flame graph tool.
To our knowledge, this is the first attempt to correlate automatic grouping mechanisms with root cause analysis using tracing data. In this project, most of the data used for evaluations and experiments were done with the Linux Operating System and were conducted using the Linux Trace Toolkit Next Generation (LTTng), which is a very flexible tool with low overhead.
TABLE OF CONTENTS
DEDICATION . . . iii
ACKNOWLEDGEMENTS . . . iv
RÉSUMÉ . . . v
ABSTRACT . . . vii
TABLE OF CONTENTS . . . viii
LIST OF TABLES . . . xii
LIST OF FIGURES . . . xiii
LIST OF ACRONYMS AND ABBREVIATIONS . . . xiv
CHAPTER 1 INTRODUCTION . . . 1
1.1 Challenges in tracing analysis . . . 1
1.2 Elements that impact performance . . . 2
1.3 Objectives of the research . . . 2
1.4 Specific Problem . . . 3
1.5 Assumptions . . . 3
1.6 Proposed Solution . . . 4
1.7 Solution result . . . 4
1.8 Use of the solution . . . 5
1.9 Basic Definitions . . . 5 1.9.1 Anomaly . . . 5 1.9.2 Execution . . . 6 1.9.3 Profile . . . 6 1.9.4 Debug . . . 6 1.9.5 Instrumentation . . . 6 1.9.6 Tracing . . . 7 1.9.7 Events . . . 7 1.9.8 Metrics . . . 7
1.9.10 Cluster Analysis . . . 8
1.10 Outline of the research . . . 8
CHAPTER 2 LITERATURE REVIEW . . . 9
2.1 Static analysis and dynamic analysis . . . 9
2.2 Profilers . . . 10
2.3 Debuggers . . . 11
2.4 Tracing . . . 11
2.5 Tracepoints . . . 12
2.6 Tracing tools . . . 12
2.7 Challenges in tracing analysis . . . 16
2.8 Performance Metrics . . . 17
2.9 Performance Anomalies . . . 17
2.10 Trace analysis . . . 18
2.10.1 Manual Analysis methods . . . 18
2.10.2 Automatic Analysis methods . . . 20
2.11 Methods for analysis . . . 21
2.11.1 Statistical methods . . . 21
2.11.2 Data analysis techniques . . . 22
2.12 Trace visualization tools . . . 24
2.12.1 Gantt Diagrams . . . 25
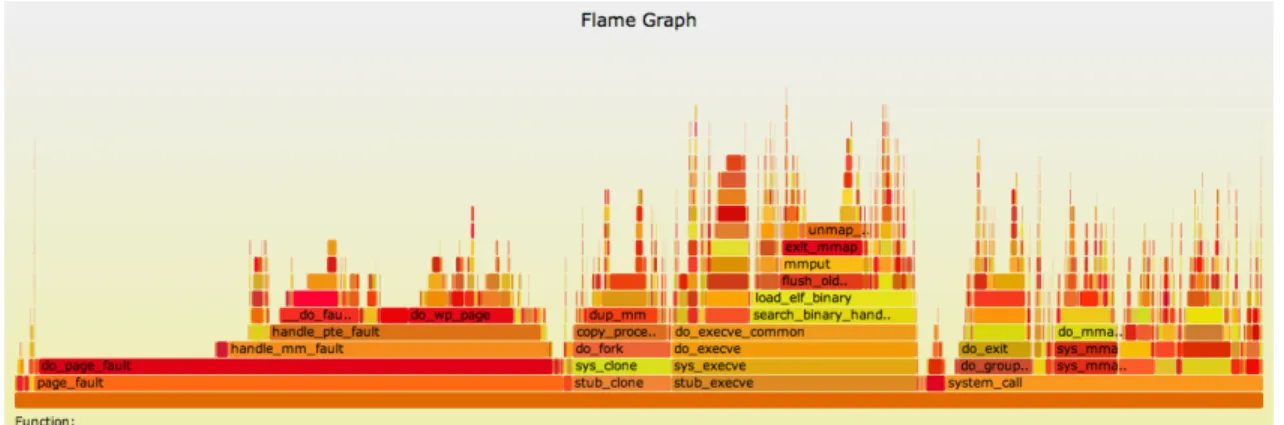
2.12.2 Flame Graphs . . . 26
2.12.3 Graphs . . . 27
2.13 Trace Correlation . . . 28
2.14 Trace Comparison . . . 28
2.15 Root cause analysis and detection . . . 29
2.16 Regressions Tests . . . 30
2.17 Dynamic Data Structures . . . 31
2.18 Auto Grouping mechanism . . . 33
2.19 Conclusion of the Literature Review . . . 34
2.20 Summary of the tools . . . 34
CHAPTER 3 METHODOLOGY . . . 36
3.1 Problem Definition . . . 36
3.2 Research assumptions . . . 36
3.3 Research Questions . . . 36
3.5 Solution Design . . . 37
3.6 Approach . . . 37
3.6.1 Data collection tools . . . 38
3.6.2 Pre-processing . . . 38
3.6.3 Data analysis methods . . . 39
3.6.4 Testing Framework . . . 39
3.7 Solution Application . . . 40
3.8 Co-authored articles . . . 40
3.9 Authored articles . . . 40
CHAPTER 4 ARTICLE 1: PERFORMANCE ANALYSIS USING AUTOMATIC GROUP-ING . . . 42 4.1 Abstract . . . 42 4.2 Introduction . . . 42 4.3 Related Work . . . 44 4.4 Motivation . . . 46 4.5 Solution . . . 47 4.5.1 Pre-analysis Phase . . . 48 4.5.2 Data Structure . . . 48
4.5.3 Data Structure Construction . . . 49
4.5.4 Classification Strategies . . . 50
4.5.5 Automatic Clustering through heuristic Evaluation . . . 52
4.5.6 Association among the Groups . . . 53
4.5.7 Accuracy of the model . . . 53
4.6 Solution Implementation . . . 54
4.7 Benchmarks . . . 56
4.8 Illustrative Example . . . 57
4.9 Case Studies . . . 57
4.9.1 Regression Comparison . . . 57
4.9.2 Page Faults Interference . . . 59
4.9.3 Cache Optimization in Server Application . . . 60
4.9.4 OpenCV . . . 62
4.10 Discussion . . . 65
4.11 Threats to Validity . . . 66
4.12 Future Work . . . 66
4.14 Acknowledgement . . . 68
CHAPTER 5 GENERAL DISCUSSION . . . 69
5.1 Methods comparison . . . 69
5.1.1 Clustering methods . . . 69
5.1.2 Classification strategies . . . 71
5.2 Results discussion . . . 71
5.3 Metrics collision . . . 72
5.4 Auto clustering discussion . . . 73
5.5 Performance Counters . . . 74
5.6 Data structure evaluation . . . 74
5.7 Usage . . . 74
5.8 Visualization Tools . . . 75
CHAPTER 6 CONCLUSION . . . 76
6.1 Summary of the work . . . 76
6.2 Objective attainment . . . 76
6.3 Contributions . . . 76
6.4 Limitations of the solution . . . 77
6.5 Future Work . . . 77
REFERENCES . . . 79
LIST OF TABLES
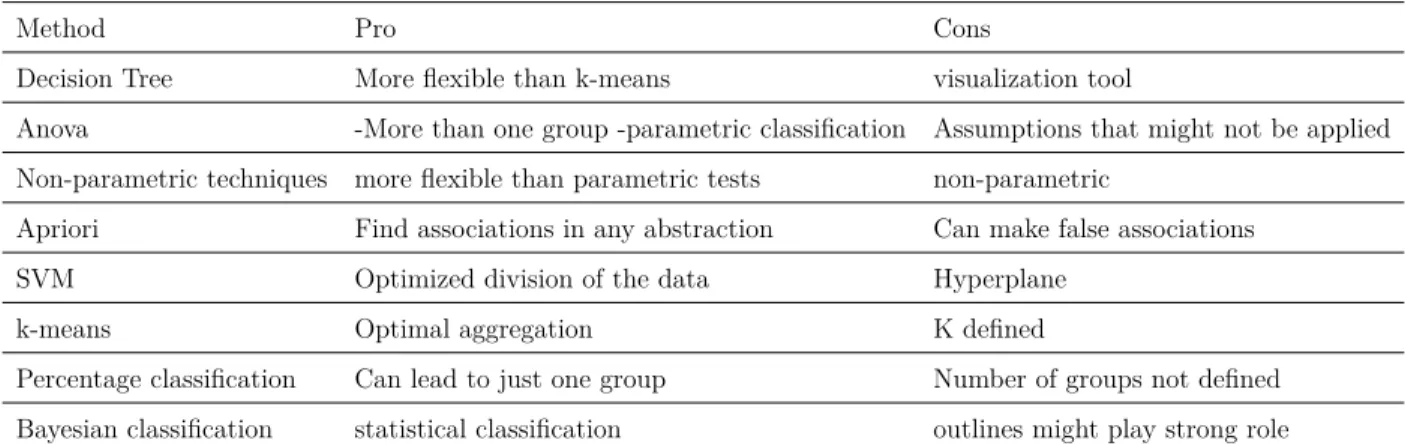
Table 2.1 Techniques of data analysis applied for performance evaluation . . . 24
Table 2.2 Evaluation of each technique data analysis . . . 24
Table 2.3 Comparing tools for performance analysis . . . 35
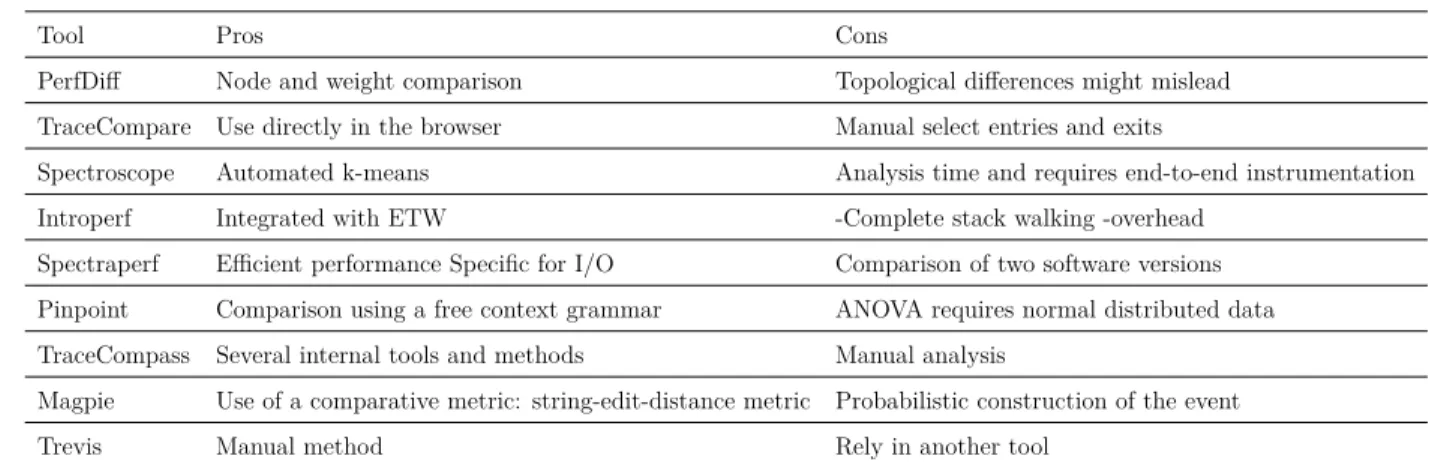
Table 2.4 Pros and cons of each tool . . . 35
Table 3.1 Auxiliary Structure . . . 38
Table 4.1 Association of groups through Apriori algorithm . . . 54
Table 4.2 Grouping results relating the cache misses with the slow executions groups . . . 59
Table 4.3 Correlation among metrics . . . 63
Table 5.1 Metric Association . . . 73
LIST OF FIGURES
Figure 2.1 TraceCompass . . . 25
Figure 2.2 Flame Graph . . . 26
Figure 2.3 Example of Radial view in Trevis [Source [2]] . . . 27
Figure 2.4 Classification of our solution according to [114] . . . 31
Figure 3.1 Process Diagram . . . 38
Figure 4.1 Dynamic Call Graph vs Enhanced Calling Context Tree . . . 49
Figure 4.2 Enhanced Calling Context . . . 50
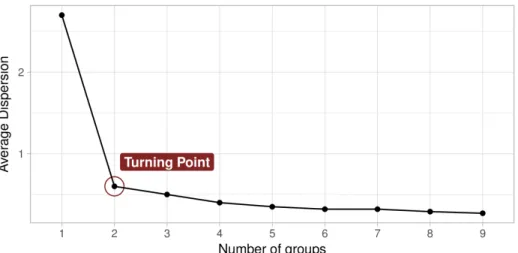
Figure 4.3 Elbow method: SSE Comparison . . . 52
Figure 4.4 Automated clustering of the executions into 2 groups . . . 53
Figure 4.5 CCT View in TraceCompass . . . 55
Figure 4.6 RGG Differential Flame Graph Diagram . . . 55
Figure 4.7 Counter Metrics for Inline and Regular function calls . . . 57
Figure 4.8 Distribution of Inline vs Regular functions using String and Integer as return types . . . 58
Figure 4.9 Comparing executions of the Open program . . . 59
Figure 4.10 Overhead introduced by I/O for caching on each 100 of requests, The white bars are the request response time and the dark bars represent the PHP compilation time . . . 61
Figure 4.11 Difference on the groups . . . 62
Figure 4.12 OpticalFlow Performance Regressions . . . 62
Figure 4.13 Optical Flow Example . . . 64
Figure 4.14 Case study Regression - showing significantly differences in the groups of runs in terms of metrics. . . 65
Figure 5.1 Support Vector Scenarios . . . 70
Figure 5.2 Percentage Classification Scenarios . . . 71
LIST OF ACRONYMS AND ABBREVIATIONS
IETF Internet Engineering Task Force OSI Open Systems Interconnection
CG Call Graph
ANOVA Analysis of Variance CCT Calling Context Tree CPU Central Processing Unit CTF Common Trace Format
ECCT Enhanced Calling Context Tree ETW Event Tracing for Windows ELF Executable and Linkable Format LTTng Linux Trace Toolkit Next Generation SVM Support Vector Machine
FSM Finite State Machine IDS Intrusion Detection System SDG System Dependence Graph
PCFG Probabilistic Context Free Grammar DFG Differential Flame Graph
SLOs Service Level Objectives DCA Directed Acyclic Graphs
ANTLR ANother Tool for Language Recognition ETW Event Tracing Windows
ML Machine Learning
OAP Aspect-Oriented Programming DTW Dynamic-Time Warping algorithm SCFG Stochastic Context Free Grammar EDT Enhanced Dynamic Tree
CCRC Calling Context Tree Ring Charts
PARCS Performance-Aware Revision Control Support BCEL Byte Code Engineering Library
ICFG Interprocedural Control Flow Graph RGG Red Green Gray Differential
CHAPTER 1 INTRODUCTION
Tracing, profiling and debugging are essential tools for software development and performance evaluation. Those tools currently face challenges related to many-core and cloud based systems, because of the enormous amount of data to be analyzed. It is expected that with the rapidly increasing scale and complexity of these systems, we will soon exceed the limits of human capability in terms of quantity of data or time to evaluate it.
In this context, there is an increasing demand for automation and reduction of analysis time. This tendency creates an interesting opportunity for developing automated analyses and methods. Accordingly, this graduate research explores several automated mechanisms for performance analysis through tracing and profiling techniques.
This document presents the state of the art in terms of analysis tools related to tracing and profiling, by improving current tools and mechanisms. It proposes data mining techniques to explore and solve problems without the requirement of very specific knowledge of underlying processes of the system, thus reducing the analysis time of the data.
1.1 Challenges in tracing analysis
The first challenge in tracing analysis is to mine meaningful information from the tracing data. A possible way to solve this issue is to group or cluster the tracing data or to add a level of abstraction, to explore and measure its behaviour. Using clustering, the challenge becomes the classification of the data without supervision, and how to efficiently apply this technique to measure the causes of the performance issues.
The second main challenge is identifying with certainty the root cause for a specific perfor-mance issue. This problem is related to the fact that, considering clusters that delimit differ-ent executions, even with clear properties differdiffer-entiating them, these differdiffer-entiating properties are not necessarily the underlying cause for the performance difference. This challenge can be summarized as: association does not mean causation. Thus, even if a performance metric (such as cache misses or page-faults) is capable of explaining all the differences between the groups, it is not necessarily the cause of this difference.
In summary, these challenges may constitute a real barrier for performance evaluation and diagnosis. They have been partially solved with the current solutions and, despite the success of tracing techniques, there are still opportunities for further enhancements in terms of data analysis.
1.2 Elements that impact performance
Several elements compose the performance of an application, especially in the current pro-gramming languages like C and C++. The use of prefetching mechanisms and compiler optimization might considerably impact the software performance. Out-of-order executions can impact the performance as well.
The use of parallelism architectures significantly improved the overall performance of com-puters, and consequently software applications. For example, the Skylake and Kaby Lake architectures bring hyper-threading, large L3 caches, and four or more physical cores. How-ever, this performance improvement is not linear, since it will follow the Amdahl’s law of parallelism.
The limitation in the number of cores and their communication capabilities, as well as other hardware limitations that processor manufacturers are facing, inexorably is calling for im-provements in software algorithms and related features, as explained by [125]. Better algo-rithms and data structures will be required especially in large industrial applications. Tools such as profilers and debuggers can be used to improve small parts of a software application or find bugs, respectively.
At the same time, an application is not executed in isolation on a system. The operating system may have a strong impact on the execution efficiency and cannot be neglected. Con-sequently, performance tools such as profilers have a limited analysis capability in the overall context of an application, and the use of tracing is normally required to account for interac-tions with the operating system. Therefore, as a consequence of the software requirements, the context of utilization of an application and the amount of resources (and features) that might impact the software performance, detailed and efficient performance analysis methods will be required.
In summary, this work combines the current profiling and tracing tools to target these specific elements of performance evaluation.
1.3 Objectives of the research
The main objective of this work is to reduce the need for human intervention in the anal-ysis of the system performance. The methodology to fulfill this objective is a comparative methodology to segregate the data in clusters and later to compare the fast and the slow executions.
The collection of the data is done using tracing and profiling techniques, combined with data mining, heuristics and statistics tools. The developed methods were able to find real
associ-ations in data with metrics and consequently indicate root causes of performance issues. This work focuses on the Linux operating system and its tools, such as LTTng and Perf counters. Nonetheless, the heuristic approach could be applied to any system that is able to describe the behaviour of a system using metrics.
More specifically, the objectives can be summarized as follows:
1. Reducing or avoiding the requirement of human intervention in tracing data analysis 2. Improving the current methods to find root causes using metrics
3. Developing an optimized solution for the proposed approach
1.4 Specific Problem
As specific problem, we want to compare several executions and uncover the main reason for any anomaly, i.e. find the specific root cause of software anomaly using different metrics such as performance counters. Thus, several runs of a program are executed while the behavior of each run is recorded. If those executions present substantial differences, the comparison can generate information about the underlying location or cause, and provide hints for later improvement.
1.5 Assumptions
There are two main assumptions in this project:
1. There are groups of similar executions, and thus the groupings can help uncover the causes for differences
2. Only the properties within the groups explain the differences
The first assumption is taken from the work of [28], the methods studied in this research aimed to find groups, which can be associated to software behaviors. The second assumption, the properties, imply that performance metrics can explain the anomalies in the system. Otherwise, it is anyhow not really possible to take in consideration hidden factors that influence the behavior of the system.
1.6 Proposed Solution
Aiming the objectives stated above, this research explored several data mining and sta-tistical methods to mine information collected with profiling approaches. Focusing on the low-overhead, we used a tracing approach for the user-space applications. Later, the data is abstracted in a data structures, ECCT or EDT, which combine profiling data with perfor-mance metrics in its nodes, using a sampling technique.
The next step is to apply the data mining approaches to mine data, basically to segregate the similar nodes of the tree and compare them. A comparative approach to the groups can be seen as similar to using statistical means or the Apriori approach.
The comparison of the groups will give the better and worst groups and the indication of the cause of the differences between the groups. This indication can be used as a hint to the need for improving some inner algorithm within the application, or to change a system parameter for instance a priority level in case of a scheduling interference problem.
The solution can be extended to consider trace correlation and other trace abstractions. Also, the use of other data mining techniques can reduce the amount of time requested for the analysis, although the assumptions will continue to be the same.
We follow a similar pattern as TraceCompare, which requires manually selecting one group for each metric, by applying automatic grouping techniques for each metric separately. Con-sequently, we applied a bi-dimensional analysis (e.g. function id versus a specific metric) instead of multi-dimensional, which would be the next step and would fully benefit from data mining methods.
1.7 Solution result
This research, i.e. the root analysis investigation, aims to find metrics, such as instruction count, page-faults, cache misses, that indicate the possible cause of a performance issue. The analysis tool will not indicate an hypothesis, in fact it will produce an estimation that the metric is the cause of the performance difference. The next step is left to the user, which can make a claim stating that the metric is or is not partially responsible for the performance issue. The result of the proposed solution will not be an hypothesis, as defined by [11]. Rather, it will be an evaluation, which considered only the metrics already there. Those metrics come from the tracing and profiling tools and rely on those tools to provide accurate data about the application. The clustering or grouping process does not produce more information that what is available.
main statements:
(i) The profiling/tracing is able to measure the system with precision (e.g. minimal overhead) (ii) The system behavior can be represented with the selected metrics (e.g. a task does not use resources that cannot be measured with the metrics)
1.8 Use of the solution
The dissertation brings a compilation of the research focusing on several aspects of data mining, considering many tools such as machine learning and statistical evaluation. The application of the methods requires static or dynamic instrumentation, as well as performance data.
The proposed solution, a grouping mechanism to track root cause analysis, can be used in any context where the runs can be separated in executions, with associated performance counters measurements. Scenarios like this can be found in C/C++ userspace applications, but also in web application, where the server can be instrumented to record requests and their performance counters.
The mining algorithms can then be applied to cluster the anomalies, or isolate abnormal executions, and compare them using profiling techniques. The result of this classification can be used in fuzzy groups, i.e. not just two totally fast and totally slow performance groups, and this can bring more information for the analysis in general.
The proposed RGG Differential Flame Graph can reduce the ambiguity for equal performance functions and is suitable for fast and slow comparison. Finally, an heuristic evaluation can be used, combined with other clustering or grouping tools such as k-means, to reduce the need for human intervention. Specifically, in terms of k-means algorithm, its use gives the optimal number of k for the clustering algorithm to work.
The solution can be applied directly in real applications. This tool may be used in regressions tests, where unit tests, profiling tools and debuggers can not reveal the causes for performance deviations. Further details will be provided in the the article. To help in the understanding of the solution, we will present some definitions intrinsically related to the research, in the following section.
1.9 Basic Definitions
1.9.1 Anomaly
Anomalies can be simplified as discrepancies in the expected distribution, or as a point or group of data points lying outside an expected normal region, as outlined in [23].
However, this research focuses on a specific kind of anomalies, collective anomalies, but may also consider point anomalies. According to the definition of anomaly in [16] it is related to a group of discrepancies in terms of standard behaviour. The collective discrepancies may indicate a series of conditions related to the observed software.
1.9.2 Execution
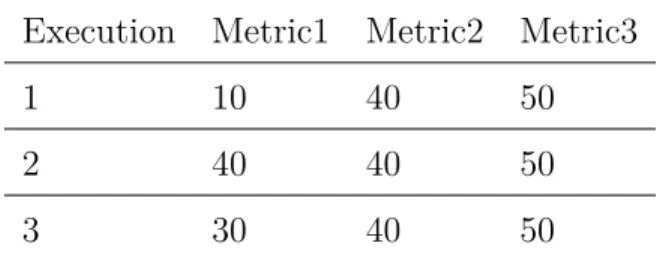
Execution is any run of a program that can be traced, and the performance data that can be used to measure its behaviour. Executions can be grouped so that they can be compared systematically using several techniques. Inside an execution, several performance parameters can be present. In this research, we focus on comparison methods for groups of executions, which can be compared using several statistical techniques. An execution can be formally defined as a collection of finite metrics in the Natural numbers (M1, M2, .., Mn).
1.9.3 Profile
Profiling is the dynamic analysis of a program. Broadly, there are two main types of profilers: the ones that count the number of invocations and the ones that display the a time measure-ment about the statemeasure-ments and routines. An example of profiler is gprof, which counts the running time of routines [56].
The profiling mechanisms can be used to analyze in depth the core of an application or the system, specifically the stack frames of the application.
1.9.4 Debug
Software debugging is the general process of finding and resolving software issues. There are several strategies for debugging such as isolating the problem and verifying the assumptions. Many tools can be used to debug. A well known debugger is GDB, the Gnu Debugger, which can debug several languages for example Ada, C, C++, Objective-C and Pascal.
1.9.5 Instrumentation
Instrumentation can be defined as a technique for inserting trace statements at some locations within the code. Instrumentation can be done dynamically and statically. The first, dynamic instrumentation, offers the possibility of changing the code instrumentation during execution time. Static instrumentation is the process of inserting instrumentation directly in the source
code [56]. In LTTng, probes are inserted in the kernel code, then the kernel is compiled, and the system is rebooted with an instrumented version [132].
Instrumentation can be simplified as the process of inserting extra code in the application to measure its behaviour. Instrumentation can be performed at various stages: in the source code, at compile time, post link time, or at run time.
There are two main possibilities for dynamic instrumentation of code: probe-based and jit-based. This first one, probe-based, is used by Dyninst in [99], Vulcan from [35], and [33]. The second instrumentation approach is jit-based, such as in Valgrind [95], Strata [113], DynamoRIO [130], Diota [82], and Pin in [80].
1.9.6 Tracing
The concept of tracing can be defined as a very fast system-wide fined grained logging mech-anism. Unlike logging, which deals with high level records about the system, tracing records the low-level events of the system. This record can then be used for other analysis mecha-nism, such as sequence matching, trace abstraction and visualization tools.
The understanding of a complex multicore system it not trivial. By browsing a list of events, for example, the trace files are analyzed using a program that processes the traces. Those tools will generate graphical or textual reports, for example about several resources of the system, including: process status, amount of data read or written, latencies and Interrup-tions.
1.9.7 Events
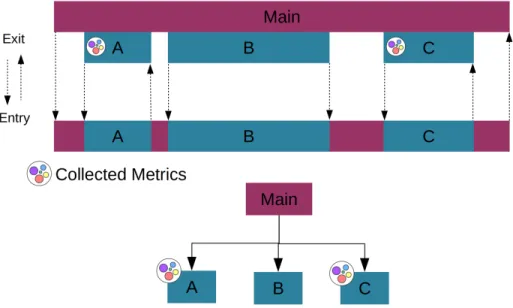
Events here are defined as a record containing: a timestamp, a type and some arbitrary payload. They can also be used to highlight the entries and exits of functions in a software application and be combined with performance metrics. They can be used to measure the current state of an application [52].
1.9.8 Metrics
The concept of metric here is the hardware or software performance runtime information and can be used to gather several aspects of the system behavior [52]. The term metric used in this work is mostly related to hardware and software metrics, typically collected using Perf. The information monitored is a current metric of the system, and it can be recorded in the nodes of a data structure (i.e. in the nodes of the ECCT or EDT) using sampling techniques.
1.9.9 Root Cause Analysis
The term Root Cause Analysis in this research is restricted to the analysis of causes for delays in executions, i.e. specific reasons for delays in executions. This identification of performance degradation causes might use several methods, including statistical analysis, [20].
1.9.10 Cluster Analysis
Cluster analysis can be defined as the process of subdividing the data in similar subsets, requiring a distance (similarity) metric computation method. In [72], a statistical analysis is performed for server analysis. In this research we aim to create clusters, which are later used to compare the performance of the executions in terms of metrics. The groups can be described as sorted or unsorted collections of executions.
1.10 Outline of the research
In Chapter 2, the Literature Review is presented, which describes the main aspects of this research. Detection and diagnosis tools are surveyed, with details. Moreover, different meth-ods for data mining are discussed, with a compilation of their pros and cons and where they are typically used.
The next chapter, Chapter 3, Methodology, presents the hypothesis, assumptions and details about the methods applied.
Later, Chapter 4 contains the Article «Performance Analysis Using Automatic Grouping». This article presents an automated solution, which includes data collection using tracing mechanisms, and data mining methods to compare groups of executions. The proposed ap-proach is used for real software applications in C/C++. The article was submitted to the Journal Software: Practice and Experience.
Chapter 5 is the General Discussion and Complementary Results, discussing details of the results and methods. A comparative approach is described. Finally, Chapter 6 is the Con-clusion, which includes a summary of the work, suggestions about the method and its speci-ficities. It also discusses limitations and possible future work.
CHAPTER 2 LITERATURE REVIEW
Performance is an important and challenging aspect of the development of software and web applications. Some of the challenging aspects lie in distributed and many core systems, which increase the computational power and the complexity of those systems. In this matter, com-plementary tools such as profilers and tracers, need to be used in order to minimize their influence in real systems when measuring their behavior. Those tools and methodologies are used for performance analysis with different aims.
This chapter provides insight on tools and methods in terms of collecting and analyzing per-formance data. It also describes techniques for comparing traces, and manual and automated analysis of tracing. Finally, the required knowledge to understand in depth our proposed so-lution is presented in this chapter.
Following this, useful techniques and tools for tracing will be presented in Sections 2.1 through 2.6. Then, analysis methods are presented, classified as automated and manual. Later, the current challenges in tracing analysis, and the associated dynamic data structures, will be presented. Finally, the proposed solution is introduced.
Overall this part aims to present the tools with critical judgment about the current data mining techniques and how they apply to this research.
2.1 Static analysis and dynamic analysis
There are two generic and complementary kind of tools to investigate software issues: static analysis and dynamic analysis, as discussed later in more details. Each of these tools have strengths and weaknesses.
The first kind of analysis, static analysis, presents tools that use source code and documen-tation for their evaluation. Those methods include source code analysis tools [104] and other tools such as [63] and [71].
There are several ways to statically analyse code, according to [5]. The two main character-istics of static evaluation are the nature and the depth of the analysis. Source code analysis tools include several tools such as Semantic Diff, Better Code Hub and FindBugs.
The second tool Better Code Hub, [63], does a complete analysis of several aspects of the source code of applications, focusing on quality measurements and code metrics. The tool also uses definitions of guidelines for code maintenance, such as writing small units of code and doing automated tests. Although not scanning the code itself, but the bytecode, another tool is FindBugs, [118], which does a search for bug patterns. It requires compiled class files
to find the bugs from patterns, and it creates a scale for the possible bugs occurences, from one to four, where one is the worst. The reported false positive rate is about 50 percent [123]. This tool also has several configurable settings. FindBugs does not find all bugs, since context sensitive bugs and security bugs, which involve the dynamic behavior of software, are not tracked.
Some tools use pattern languages to describe bugs, as PMD [120]. PMD uses a set of prede-fined rules in classes. Examples are Double Checked Locking pattern and Unconditional If statements.
Static analysis, however, is limited to the code and consequently is not able to reproduce exactly the behaviour of complex and multi-threaded systems. The alternative is dynamic analysis, that basically operates by executing a program and observing (and recording) the execution. The analysis of this runtime data can be used for performance evaluation, for example, but also for software testing. Examples of dynamic analysis tools are debuggers, profiler and tracers.
2.2 Profilers
The first kind of tools, Profilers, allows to verify where the program spent its time and which function called which other function (call hierarchy) while it was executing. This information can be used to identify the faster and slower parts of the code and improve the performance of the application. An example of profiler is a call graph profiler that shows the call durations. Gprof is a profiler from GNU Compiler toolchain. Gprof was originally proposed to help the user to evaluate alternative implementations of abstractions.
Gprof presents a call graph of the application, which represents the caller-callee relationship, also showing the number of times that each function was called. The implementation in gprof issues a call to the mcount function upon each function entry. This function is responsible for creating a table using the stack frame of the application. Another tool called OProfile, is a set of monitoring tools related to profiling. It was implemented using a script called opcontrol and a daemon called oprofiled, and is able to collect information for all parts of the system: kernel, shared libraries and binaries [119]. This tool uses a mechanism called differential profiles that is able to compare profiles by percentage and has a declared overhead impact of between 1% to 8%.
However, profilers add a non-negligible amount of overhead to the system, because of the requirements of the code that need to be instrumented. The process to analyse the data is separate from running the program itself, and is performed afterwards. The distribution
of the function durations helps in identifying the contribution of each function to the total execution time, but does not necessarily reveal infrequent performance problems, such as occasional latency constraints violations.
2.3 Debuggers
The second kind of tools, debuggers, enables source code analysis during the execution and aid in understand program execution. This is achieved by dynamically adding breakpoints or tracepoints points at arbitrary locations in the code, such as when the program crashes. One example is GDB, the GNU Debugger. It supports several languages, such as C and C++. GDB starts as a separate server process and executes the user commands. There are three kinds of breakpoints in GDB: breakpoints, watchpoints and catchpoints, all of them involving stopping the normal execution of the program [121]. The process of debugging is to watch the behavior of those breakpoints, analyzing concomitantly the source code of the application.
Debuggers, however, increases considerably the overhead of an application, because it needs to stop the execution of the application when a certain condition occurs. This kind of analysis requires the addition of breakpoints in the code. Also, since they present a snapshot of the application execution, they often cannot find complex component interactions issues [122]. Finally, GDB is primarily designed for fixing bugs rather than tuning performance.
2.4 Tracing
Among the current dynamic analysis tools, tracing is a technique that incurs lower overhead, and consequently can be used to measure with accuracy several properties of the application, such as its performance. Unlike logging, which deals with high level records of the system, tracing records the low-level events of the system. This record can then be used by other analysis mechanism [25].
Tracing can be classified based on two main aspects: its functional aspect and its target domain. The first aspect, the functional, states that tracing instrumentation can be inserted statically or dynamically. The first, static tracing, requires source code modification and recompilation of the target binary/kernel. This is unlike dynamic tracing, which inserts the tracepoints directly in the running process or binary.
applications. The first domain, userspace, concerns applications executed in userspace, i.e. the portion of memory in which a user executes its processes. In this domain, the system calls can be recorded.
The later domain, kernel space, concerns the system core, the kernel. In this domain, several tools, such as LTTng, already benefit from predefined tracepoints in the kernel code.
2.5 Tracepoints
Tracing involves the addition of tracepoints in the program to measure its behaviour. Each tracepoint is associated with an event and can be used to record the behavior of the system, without the need to create new tracepoints in the source code.
In this way, there are two types of tracepoints: static tracepoints and dynamic tracepoints, [26].
The first type, dynamic tracepoints, do not have any impact when not activated. Linux has had dynamic trace functionality for a long time in the form of probes, kprobes, jprobes, and kretprobes. By using probes, it is possible to dynamically enable new tracepoints in the ker-nel, and consequently collect debugging and performance information non-disruptively [136]. Kprobes, specifically, provide a kernel API for placing probes at kernel instructions and they can be exploited directly via a kernel module, or via systemtap which provides a high level scripting language. Kprobes basically is a set of handlers to be placed at specific instruction addresses [55], where a post-handler and a pre-handler is defined. The handlers can be used for multiple probes. The process is the defined as follows: when the instruction is executed, the pre-handlers are executed before the execution, while the post-handlers are executed right after the execution of the instruction. Also, it is possible to use GNU debugger (GDB) tracepoints to insert dynamic tracepoints in the system [116].
The second type, static tracepoints, use the already present static tracepoints in the Linux mainline code for collecting data. There are several ways to use the static tracepoints, via commands or in-kernel modules. Usually, static tracepoints are faster than dynamic trace-points [52].
2.6 Tracing tools
In kernel space, as described above, the main available tools are the following: LTTng, Perf, eBPF and Ftrace.
Dagenais as a tracer to extract information from the Linux kernel, user space libraries and from programs by running a recompiled instrumented version of the kernel. It was created with the objective of minimizing the impact of the instrumentation in the kernel,[27]. The LTTng main components are the daemons, the session and the ring buffer. The session daemon is responsible for interfacing with the sessions and the overall component control, while the second, the consumer daemon, writes the data to CTF traces. The session is the communication mechanism between the user and the session daemon, enabling multi-ple records at the same time. Finally, LTTng uses configurable circular buffers, which have configurable features for recording the kernel events and can be tuned according to the user needs. The ring buffers are associated with a channel.
LTTng provides three main modes for trace recording: normal, snapshot and live mode [36]. The first mode is the normal mode, i.e. reading and writing in the ring buffer, by the session and consumer daemons. The second mode is the record of a snapshot of the trace, periodi-cally saved in the buffer and sent to the (possibly remote) reading system through the relay daemon. The third, the live recorder mode, is where a system viewer can be used to analyze the information as it is generated. Also, LTTng is currently able to trace Java and Python applications using similar techniques. The tracing data generated by LTTng is output as Common Trace Format (CTF). This format can then be read using Babeltrace or parsed via scripting languages, such as python bindings, [36].
The following tool, Perf tools, or perf, is a mainline Linux utility that was developed to mea-sure several software and hardware metrics on the CPU. It is a profiler tool for Linux 2.6+ based systems that abstracts away CPU hardware differences in Linux performance mea-surements and presents a simple command-line interface. Perf is based on the perf events interface exported by recent versions of the Linux kernel. This research uses the perf tool for the construction of the dynamic data structures to measure the system behavior.
The functionality of Perf was subsequently extended to interface with the macro TRACE_EVENT() and therefore access the Linux kernel trace points. It is possible to use it to generate statistics on the number of times a tracepoint is executed, for example, or to analyze the number of events that a processor will have recorded during a time period. It can be used to record profiles on per-thread, per-process and per-cpu basis using a sampling approach.
A new tool that evolved recently is eBPF, the enhanced Berkeley Packet Filter [75]. It is being integrated in the Linux mainline and allows several filtering packages but also cus-tom analysis filters to be achieved efficiently, [59]. EBPF can be used for computing, with low-overhead, latency histograms and heatmaps that can be used in detailed performance analysis and through visualization tools. This tool is extremely versatile and can be used to create programs, eBPF programs, which can be attached to kprobes with low-overhead and
populate the eBPF maps, as explained in [60].
Finally, Ftrace is well known mainline tool for Linux tracing. It was designed to find the speci-ficities of the operations inside the kernel. It can be used for debugging or analysing latencies and performance issues that take place in kernel space. Ftrace uses the TRACE_EVENT() macro, [69].
Although Ftrace is typically considered the function tracer, it is indeed a framework of sev-eral tracing utilities on the kernel side. For example, it can be used for latency tracing, to examine what occurs between interrupts disabling and enabling, for analyzing preemptions and for other analyses. This tracer is used to dynamically trace functions in the kernel, to help debugging kernel detailed operation.
Another tracer, SystemTap, allows tracing in kernel space, as well as in user space, through the use of dynamic instrumentation, i.e. uprobes and Kprobes. SystemTap relies on a script-ing language, that provides flexibility to the user, and comes with an interactive GUI. To run those scripts, once written, they are compiled into a module and loaded into the kernel. Although this tool offers a great flexibility, it is not suitable for the collection of a large number of events, because it carries a larger overhead than LTTng.
From the userspace side, the following tools can be used:
The first tool, LTTng-UST, is the counterpart of LTTng (kernel) but for user-space. For this purpose, the tool can be used statically in the code, by inserting tracepoints or by the use of instrumentation mechanisms during the compilation phase. Compiler inserted instrumen-tation, and manual tracepoint insertion, both have drawbacks. Manual tracepoint insertion in the source code demands time and might not be done in all the functions. Compiler in-serted tracepoints are limited to specific generic locations, such as functions entries and exits, and the indiscriminate insertion in every function might cause an excessively high overhead. LTTng-UST provides a simple way to introduce tracepoints through the compiler. The GNU Compiler flag finstrument-functions add a call to specific trace functions at each function entry and exit, similar to a profiling mechanism, and the trace functions are added to the binary using the LD_PRELOAD dynamic linking mechanism.
In terms of runtime efficiency, LTTng-UST has a mechanism to avoid returning to the kernel, separating the traced process from the consumer daemon. The traced application is respon-sible for writing the events into the shared memory ring buffers, which are subsequently read by the consumer daemon. The consumer daemon is specific for user-space tracing since it is a different process than for kernel tracing. The application directly writes the events in memory using lockless operations and consequently does not pass through the kernel of the operating system.
daemon, and then change to a another buffer to continue recording the events. Then, the consumer daemon will save to disk (or to the network) the shared memory buffer content, releasing it for reuse. This reduces the communication between the consumer daemon and the traced application.
Another tool for user-space, Perf, can be used directly with user-space code, where code to read the performance counters is added directly in the code through the use of a library in the source code. In this approach, the performance counters can be recorded using a sam-pling approach, where the increment for a specific metric from the beginning to the end of a code section execution can be computed and recorded. This tools is extremely flexible and is able to measure many system metrics, both software and hardware, including instructions executed, page-faults, cache-misses and so on.
Another user-space tool, uftrace, developed by [77] can also be used to trace and analyze execution of programs written in C/C++. It was heavily inspired by the ftrace framework of the Linux kernel (especially function graph tracer) and supports user-space programs. It supports various kinds of commands and filters to help in the analysis of program executions and performance analysis.
Uftrace is also able to trace kernel functions, requiring root privileges and by enabling the CONFIGFUNCTION_GRAPH_TRACER=y option in the kernel.
Finally, SystemTap can be used as well for user-space tracing through DynInst. For tracing in user-space it uses a DynInst mutator [99], which can be activated through stap, the Sys-temTap command line tool. The SysSys-temTap GUI can be used to edit the scripts. It is also possible to access tracepoints defined for DTrace. The traces produced by SystemTap are in plain text.
In terms of performance, however, it can be slower than solutions which use static tracing, for example LTTng, especially in multi-threaded environments. Apart from kernel and user-space Linux tools, there are other tracing tools highlighted below:
The Google Chromium browser, which is highly popular throughout the world, has a tracing feature. The browser provides a method to trace its application and analyse its performance, using an embedded tracing system, [54]. This is a complete solution at the application level, containing tracing and analysis tools, which is platform-independent.
The tracing mechanism is split in two: trace recording and trace consumers. Telemetry is a tool that can be used to trace and analyse this application, i.e. produce the traces while the Chrome DevTools application is a way to consume it [19].
The advantage of this technique is portability, since it works independently of the operating system or version. However, the portability of this system, due to its Java Script interface, is also the source of some limitations, notably a size limitation for the tracing data. Indeed,
the Chromium traces have a limited size, covering up to a few seconds and containing only a small number of events. Moreover, the sampling rate in Chromium may also cause issues for the analysis of its data, as described in other work [1].
Although related to cloud tracing, end-to-end tracing tools have been developed for quite some time. This technique basically enables the tracing of a request from the client-side to the backend, as defined in [126]. End-to-end tracing tools have been widely adopted by several companies as summarized in [81]. Among those end-to-end tracers, a useful tool is X-trace, [43], which is a diagnosis tool based on tracing and works through metadata insertion, aiming to target all nodes within a networked application. The main purpose of this tool is to reconstruct the task tree of a distributed task, encompassing all sub-operations making up the initial task, that is the set of network operations associated with the observed task. This is achieved by adding metadata in the application. This information is disseminated through the nodes of the application to measure it. X-trace covers several scenarios of application, such as web servers tracing. This tool is important to highlight, considering the several di-agnosis mechanisms that require end-to-end instrumentation, such as Spectroscope.
2.7 Challenges in tracing analysis
The use of tracing for performance analysis can be extremely efficient, in terms of collect-ing and analyscollect-ing data. However, there are some challenges regardcollect-ing three main aspects: the size of the trace, the complexity of the data and the data analysis. Those aspects are discussed below: The first challenge is related to the the amount of data generated by trac-ing. This comes from the fact that tracing can record events at low-level and, consequently, many events are generated at kernel level, [52]. This amount of data cannot be easily used, compared, or analysed, even with pattern finding or comparison mechanisms. Some aspects of pattern matching can be improved upon, as emphasized by [92].
The second challenge related to the analysis of tracing data is the inherent complexity of the data [52]. Since the data covers many aspects of the system, the number of events may re-quire that several techniques be applied, to mine the information from the enormous amount of data. The frequency of occurrences of some events in a system also plays a role in this challenge. For instance, an important event may happen only once in a thousand times or more, and consequently some techniques such as pattern mining might not be adequate in such situations.
The last challenge resides in the difficulty to analyze the cases, since a deep understanding of the underlying mechanisms of the system and applications are necessary. For some
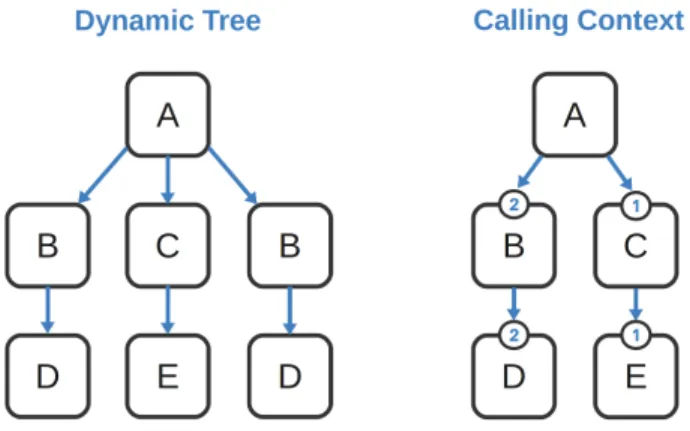
perfor-mance issues, the root cause of the problem is unknown, and profiling all the application may not be trivial. Tracing can be used, but the main point in this issue is to find the meaningful associations between a singular and specific cause in the trace data with the source code modification that triggered it. For this challenge, a high level data structure, such as a call graph or calling context, combined with performance data, might be used [31].
2.8 Performance Metrics
Hardware and Software performance metrics can indicate key information to describe the state of a system [57]. Two examples of metrics are latency and throughput. The first can be used to describe the response time of an application, that is the time for any operation to complete such as a database request. The second metric, throughput, is the rate of work performed, for example the number of web requests served per unit of time.
System resources can be measured through hardware and software metrics, and the per-formance of the application that uses those resources can be measured indirectly. System resources might include physical components such as the CPU, memory, disk, caches and network, but also virtual components such network connections, sockets, locks, file handles or descriptors [57].
From this detailed information about the system, such as process scheduling and memory management, it is possible to abstract and control several behavioral aspects of an appli-cation, as well as of the system. Several utilities like top, ps and htop, can display such information live, from the system, and may be used by system administrators to measure the system behavior.
In terms of tracing techniques, performance metrics can be recorded using a special recording mechanism that writes the performance metrics using perf_events directly in the system. In this case, the metrics must be defined a priori, to be enabled in the tracing environment. Besides recording by this approach, it is also possible to use the system dump to record the metrics of the system as they are recorded.
Through the utilization of the approaches described above, it is possible to solve performance issues by correlating events with the performance metrics, or even with the system state.
2.9 Performance Anomalies
There are several classifications for software anomalies. One distinguishes three kinds [16], others consider four kinds of anomalies [67]. The anomalies can be punctual anomalies, col-lective anomalies and contextual anomalies.
The first kind of anomalies, punctual anomalies, represent an outline point in the expected values of an application. This definition is broad and might consider a statistical metric such as the distance from the average. For example, one standard deviation or more from the average may be considered an anomaly. Those kinds of anomalies might be the spikes in one application that might not affect more than one execution, but the impact on this single application may be considerable.
The second kind, collective anomalies, are anomalies that occur not just once but in groups, i.e. a group of outliers that, as a group, impact the application. According to the definition of [67], a special group of those anomalies occurs at a regular time interval, and consequently follow a pattern.
Finally the last kind of anomalies are those that occur because of the context of the appli-cation, called contextual anomalies. Those anomalies can be system problems, for example IO-bound or CPU-bound situations. Contextual anomalies are related intrinsically with the infrastructure of the application.
2.10 Trace analysis
There are different techniques to analyse trace data, the two possibilities are detailed below.
2.10.1 Manual Analysis methods
There are mainly three ways to analyze trace data, as explained below: The first, using sequence detection, which includes pattern matching techniques, was used in several ways in different contexts. Most of the aforementioned tools use this technique to detect repeated contiguous sequences of trace events, and to generate abstract and compound events [18]. [78], and [86] use pattern matching techniques to generate abstract events from the LTTng kernel trace events. Pattern matching can also be used in intrusion detection systems [65]. Some language features are used for matching in OCaml as described in [131]. For example, STATL models in [34] use signatures in the form of state machines, while in [22], signatures are expressed as colored petri nets (CPNs), and directed acyclic graphs (DCA) are used to extract security specifications. [7] presents an approach for malware detection using the abstraction of program traces. They detect malwares by comparing abstract events to ref-erence malicious behaviors. Although not related to tracing, in [45], a behavioral diagnosis technique is used, based on an algorithmic approximation matching approach, which is a NP-complete problem; it is somewhat similar to what was achieved by Matni. In addition, a similar approach was explored by [44], analysing blocked processes on multi-core systems. This work was implemented in the former LTTV tool as the Delay Analyzer.
However, most of the techniques explained above use pattern-matching and have defined their patterns over trace events. They did not consider using the modeled system state information. As will be presented later, our work is different as, unlike many of the previous techniques, it considers the system state information and provides a generic abstraction framework. Our proposed method converts raw events to platform-dependent semantic events, extracts the system state value, and sends them as inputs to the pattern-matching algorithms.
In [39] the concept of trace abstraction aims to reduce the trace size, and the complexity of the data, especially for large data processing. In this same work, three data driven approaches for abstraction are presented: metric-driven, stateful data-driven and a structure-based. More-over, they were used in [40] and [41]. While the first deals with kernel event generation, using a semantic approach rather than a low-level representation for modeling a state, the second paper deals with statistics in large trace files, using a statistics database of several metrics parameterised through a granularity degree.
Moreover, in this article, a metric-driven approach is explored, it is able to provide statistical data, demonstrating the issues related to this approach: first, the difficulty of efficiently com-puting the system metrics statistics without having to reread the trace events. The second is to find a way to support large traces. Although the use of those metrics can be difficult, this has been achieved in [85].
The approach of using an automata-based comparison, was proposed by [86], and aims to create a FSM that simulates the behavior of the system. In this work a pattern mechanism is applied and a list of problematic patterns is searched for using the State Machine Compiler language, SMC, for the description of problematic behavior. Once the state machine is built, the potentially huge amount of trace data is subsequently processed through it, to find the patterns and explore the false-true implications. In this article, the patterns focus on security evaluation and testing procedures.
The work of [132] introduces a declarative pattern specification language to find pattern-matching in kernel trace analysis. In this work, trace abstraction is explored to compact the information in the traces, summarizing the important data. For the specification of the language they used ANTLR.
However, the pattern matching technique, as explained above, is a limited manual analysis with linear comparison performance. Another problem is the false-true problems that might arise upon finding patterns in the traces.
Trace summarization is another possibility to analyse trace data, highlighting key aspects of large traces. The work of [66] proposed an approach for extracting summaries from large traces, relying on the removal of implementation details. The concept of trace summary is related to highlighting the main aspects of a trace, where the input to the method is a large
trace, and the summary will contain only the relevant aspects of it. This can later be used to represent the system using UML notation.
The methodology was applied in Weka [100] and was able to represent realistic aspects of this objected oriented library. The aspects for summarization are based on an empirical study, using a qualitative evaluation of the QNX software.
However, the problem with this technique, though, is the need to predefine the main aspects that need to be summarized in a trace. In this work, the key aspects of the summarization were compiled using a questionnaire.
Another methodology that can be used to compare traces is the analysis of the critical path of a task. In fact, a specific task within the trace is analysed, following its dependencies through the multiple related threads executions.
The critical path of an algorithm is a methodology to analyse the tasks that rely on multiple threads. For those problems, [50] proposed an algorithm that is able to find all the threads that contribute to the total time of an execution.
This algorithm efficiently retrieves all execution segments that contribute to the latency of a task. Using some event properties (the sched_wakeup) of the Linux kernel, it is possible to identify the multiple threads related to the specific task. However, this tool does not relate this information to user-space functions, which makes it difficult to use for studying application code. Furthermore, the interactive view is able to show only one execution at a time. For comparing groups of executions, this is fairly restrictive.
2.10.2 Automatic Analysis methods
For automatic analyses, there are several mechanisms. One of these techniques is the possi-bility to use machine learning and data mining techniques.
Spectroscope is another tool that uses statistics and high level abstraction to automate the analysis process, focusing on end-to-end tracing, as presented in [106] and [112]. This tool was designed to find changes in behaviour, not to find specific anomalies, and was used to find problems in two versions (or periods) of Google’s Ursa Minor distributed software. Specifically for this software, five problems were described. It uses Startdust as end-to-end tracer. This adds some overhead on Ursa Minor performance, depending on the operation. In its methodology, Spectroscope uses the Perl language and MATLAB statistical compar-isons of normal and problematic periods. It used the DOT utility for plotting data, as often done in other similar tools.
The statistical test used is the Kolmogorov-Smirnov, a non-parametric test for mutation identification that compares the shapes and distribution of mathematical functions and uses
a ranking system for mutation identification. Spectroscope uses the normalized discounted cumulative gain (NDCG). For the performance evaluation, which has a range from 0.0 to 1.0. The Kolmogorov-Smirnov test is similar to the KW test, since both are non parametrics tests used for comparison evaluation.
2.11 Methods for analysis
We can divide the analysis techniques into two main categories: statistical analysis and data mining techniques. In terms of performance analysis, the use of machine learning and data mining techniques were already investigated in some interesting work.
2.11.1 Statistical methods
From the statistical point of view, several possibilities of parametric and nonparametric tests can be used such as the Confidence Interval, ANOVA and Kruskal Wallis tests. The first method, Confidence Interval, is a comparison of samples considering a percentage of toler-ance. This can be seen as similar to a t-student test. This method transforms a relative value estimate into a scope of qualities that are thought to be acceptable for the population. The length of a confidence interval relies on its Standard Error(SE), which in turn depends upon two metrics: the sample estimate and the standard deviation.
In co-authored work, [1], we did an analysis on the confidence interval of several Chromium releases data to find significant performance regressions. The technique was able to find specific regressions in versions (version-specific data). This technique can be applied to more uses cases and can be extended to include other techniques, such as clustering the data in a preparatory phase.
The second method, ANOVA, can be defined as a way to determine whether there is any statistically significant difference among means of groups being compared. This technique is used in several areas of knowledge and has different approaches, including the MANOVA and Multi ANOVA.
Finally, the third method is Kruskall Wallis, which is also called ANOVA by rank. It com-pares medians instead of means as ANOVA. This method is a non-parametric method to compare groups, although it does not take in consideration most of the assumptions of the ANOVA method. In performance analysis, ANOVA was used to compare executions in [49]. In this work, the comparison of executions of Java garbage collection was studied, which has problems related to its different behaviour patterns. This problem is related in many aspects
to the JIT-process that influences the performance of the garbage collector. Although it is an empirical study, this work also focuses on the discussion of non-rigorous statistical deduc-tions, which can occur in the analysis of similar problems.
Nonetheless, in our experiments, part of the executions did not generate a normal data distri-bution, and consequently required the application of a parametric method, such as ANOVA, for its analysis. This is a major drawback, that real data might face, and a reason for apply-ing other methods such as Kruskal Wallis, which we explored in [88].
In [90], they used the Pinpoint tool to build runtime paths of applications, and to manage failures for large distributed systems. The tracing is done in the distributed black-box com-ponents service until completion, and is able to discover structural anomalies comparing the probabilistic context free grammar, PCFG, of the requests.The comparison mechanism uses ANOVA and other non-parametric comparison algorithms. The construction of those paths allows the comparison with normal and abnormal paths. It is interesting to highlight in this work that the solution is a combination of three parts, and tracing is just one part of it. Consequently, the solution could be used using other tracing schemes.
In terms of profiling-based comparisons, the work of [96] proposes a statistical approach for detecting performance regressions using control techniques. The approach works by building a linear equation which estimates the number of performance counter samples. The statisti-cal approach is used to compare the predicted and the real counter values using Spearman correlation, and the Shapiro-Wilk test is used for the evaluation. The Shapiro-Wilk test is an hypothesis test that assumes as null-hypothesis that the population is normally distributed, as defined in [42].
2.11.2 Data analysis techniques
From the data mining aspect, which is about solving problems using the analysis of data already saved [133], several techniques can be used to find regressions and improve perfor-mance. Machine learning may be used to cluster and classify the data. The tools for this purpose include clustering techniques, decision algorithms and bayesian networks.
A common task in machine learning is to cluster the data, also called cluster analysis. It can be defined as separating the data in groups that might not be labeled. Support Vector Machine (SVM) is one algorithm used for this kind of task. In clustering algorithms, the output will be in the form of a diagram of clusters of data.
The first technique, SVM, is a classification tool in data mining algorithms, used to classify the data using hyperplanes. This algorithm requires a learning phase and might be applied to more than one dimension in terms of classification. Another technique is the hierarchical
![Figure 2.1 is a sample view of the TraceCompass, [22]. This examples shows the Control Flow view, specifically for Python 3 profiling data.](https://thumb-eu.123doks.com/thumbv2/123doknet/2328303.31020/40.918.146.775.441.775/figure-sample-tracecompass-examples-control-specifically-python-profiling.webp)
![Figure 2.3 Example of Radial view in Trevis [Source [2]]](https://thumb-eu.123doks.com/thumbv2/123doknet/2328303.31020/42.918.243.643.707.1011/figure-example-radial-view-trevis-source.webp)
![Figure 2.4 Classification of our solution according to [114]](https://thumb-eu.123doks.com/thumbv2/123doknet/2328303.31020/46.918.291.636.378.650/figure-classification-solution-according.webp)