HAL Id: hal-02354409
https://hal.archives-ouvertes.fr/hal-02354409
Submitted on 11 Jan 2021
HAL is a multi-disciplinary open access
archive for the deposit and dissemination of
sci-entific research documents, whether they are
pub-lished or not. The documents may come from
teaching and research institutions in France or
abroad, or from public or private research centers.
L’archive ouverte pluridisciplinaire HAL, est
destinée au dépôt et à la diffusion de documents
scientifiques de niveau recherche, publiés ou non,
émanant des établissements d’enseignement et de
recherche français ou étrangers, des laboratoires
publics ou privés.
Sources and sinks of ozone in savanna and forest areas
during EXPRESSO: Airborne turbulent flux
measurements
B. Cros, C. Delon, C. Affre, T. Marion, A. Druilhet, P. Perros, A. Lopez
To cite this version:
B. Cros, C. Delon, C. Affre, T. Marion, A. Druilhet, et al.. Sources and sinks of ozone in
sa-vanna and forest areas during EXPRESSO: Airborne turbulent flux measurements. Journal of
Geo-physical Research: Atmospheres, American GeoGeo-physical Union, 2000, 105 (D24), pp.29347-29358.
�10.1029/2000JD900451�. �hal-02354409�
JOURNAL OF GEOPHYSICAL RESEARCH, VOL. 105, NO. D24, PAGES 29,347-29,358, DECEMBER 27, 2000
Sources and sinks of ozone in savanna and forest areas during
EXPRESSO:
Airborne
turbulent
flux measurements
B. Cros,
• C. Delon,
1 C. Affre,
1 T. Marion,
2 A. Druilhet,
1 P.E.
Perros,
2 and
A. Lopez
I
Abstract. An airborne
study
of ozone
concentrations
and fluxes
in the lower layers
of the
atmosphere
was conducted
over
the Central
African
Republic
(CAR) and
northern
Congo
in
November/December 1996, within the framework of the Experiment of Regional Sources andSinks
of Oxidants
(EXPRESSO).
The first 4 km of the atmosphere
above
savanna,
rain
forest, and the transitional area between them, were investigated with the French research aircraft Avion de Recherche Atmosph•rique et de T•l•d•tection (ARAT). Turbulent fluxesand deposition
velocities
of ozone
were determined
using
the Eddy Correlation
(EC) method.
A specific methodology was developed to obtain accurate airborne turbulent fluxmeasurements. This methodology is linked to the turbulence stationarity. The average values
of ozone
fluxes
and ozone
deposition
velocities
in the Atmospheric
Boundary
Layer (ABL)
increase appreciably from savanna to forest. Near the ground, the ozone fluxes range between-0.115 +/-0.073 ppbv
m/s above
savanna
and-0.350 +/- 0.115 ppbv m/s above
forest;
for the
deposition,
the ranges
are 0.0042 +/- 0.0018 m/s and 0.015 +/- 0.004 m/s. A simple
empirical
relationship between deposition velocity and Leaf Area Index (LAI) is proposed, giving an estimation of the deposition velocity for a whole latitudinal band. Vertical inputs of ozone to the ABL are estimated according to entrainment fluxes. The role of advection is neglected for horizontal transport of ozone in the ABL. The photochemical ozone production is deduced from the photo-stationary state deviation, and compared to the net ozone increase in the ABL duhng the flights performed above the forest. A tentative ozone budget based on the aircraft measurements is proposed in the ABL of the rain forest. Around noon, the photochemical production dominates with a net production of about 10 ppbv/h.1. Introduction
Previous measurements in the African tropics through remote sensing and in situ observations [Fishman et al., 1986; Cros et al., 1988; Marenco et al., 1990; Lacaux et al., 1996] have shown high emissions of trace gases from biomass burning. These emissions involve a widespread pollution of the troposphere [Fishman et al., 1991 ], and one of the most dramatic features of this pollution is the seasonal enhancement of tropospheric ozone on the West Coast of southern Africa [Fishman et al., 1990]. The recent Transport and Atmospheric Chemistry Near the Equator-Atlantic (TRACE-A) experiment [Fishman et al., 1996] has shown that the presence of fires in southern Africa was not sufficient to generate the ozone maximum observed in the upper troposphere. The ozone accumulation in this zone could result from a combination of complex mechanisms of atmospheric chemistry and meteorological processes. The yearly amounts of biomass burnt in the northern African tropics are similar to those of the southern African tropics [Lefeivre, 1993].
XLaboratoire d'A•rologie, Unit• Mixte de Recherche 5560, Centre National de la Recherche Scientifique/Universit• Paul Sabatier, Observatoire Midi Pyrenees, Toulouse, France.
2Laboratoire Interuniversitaire des Syst•mes Atmosph•riques, Unit• Mixte de Recherche 7583, Centre National de la Recherche Scientifique/Universit• Paris 12, Cr•teil, France.
Copyright 2000 by the American Geophysical Union. Paper number 2000JD900451.
0148-0227/00/2000JD900451 $09.00
However, the atmospheric consequences of biomass burning, particularly for tropospheric ozone, seem to be appreciably different between northern and southern African tropics as shown by satellite data from the Total Ozone Mapping Spectrometer (TOMS) [Fishman et al., 1992]. In addition, Dynamique et Chimie de l'Atmosphrre en For•t Equatoriale (DECAFE) experiments have shown that effluents from northern African savanna fires can reach the equatorial rain forest (or tropical rain forest) and react with biogenic compounds emitted by this forest [Andreae et al., 1992; Cachier and Ducret, 1991]. The specific chemistry involved under these conditions has a decisive effect on the evolution of the majority of the emitted compounds.
One of the primary goals of EXPRESSO [Delmas et al., 1999] was to better quantify the exchange fluxes of reactive trace gases between the biosphere and the atmosphere in the northern African tropics, and to analyze the horizontal interactions at the transition between savanna and rain forest. The question addressed in this paper is whether the rain forest and the savanna act as net sources or sinks of oxidants such as 03, and how these sources/sinks may be quantified over the whole investigated region. This study is also a first step in the evaluation of the regional influence of these sources and
sinks.
Biosphere-atmosphere exchanges are governed by surface fluxes of energy and trace compounds. Temporal evolution of such fluxes may be monitored from fixed point measurements, but their spatial variability at regional scale require airborne measurements.
At the top of the ABL, exchanges with the upper layer determine the impact of emissions on regional atmospheric
29,348 CROS ET AL.: SOURCES AND SINKS OF OZONE IN SAVANNA AND FOREST AREAS chemistry. Measurements of ozone fluxes near the surface
help to understand the mechanisms for surface removal of ozone and eventually to identify the potential for biological effects on ozone deposition. During the EXPRESSO campaign a tentative budget of ozone in the ABL was established from the determination of ozone fluxes, both near the ground and near the top of the ABL. Because of measurement and logistic difficulties, very little quantitative information is available on the exchange rates within the
interior of the ABLs of the studied area.
In this paper, our interest is focussed on deposition, input and formation of ozone in the ABL above savanna, rain forest, and transitional areas during the EXPRESSO campaign, which took place in November/December 1996 in Central Afhcan Republic (CAR) and northern Congo. (_-)zone
flux measurements were conducted onboard the Fokker 27
ARAT, equipped for Eddy Correlation (EC) measurements of thermodynamic parameters (heat, water and momentum) and ozone concentrations. First, the deposition velocity Va is estimated over the forest, and an empirical relationship between Va and the Leaf Area Index (LAI) is proposed. Second, a tentative ozone budget in the ABL of the rain forest is proposed. To this end, vertical contributions are estimated from entrainment fluxes, and photochemical ozone production is deduced from the photo-stationary state.
2. The Experimental Area
2.1. Meteorological Characteristics
The climate in northem Africa is regulated by the Intertropical Convergence Zone (ITCZ), a zone of low pressures between converging winds from opposite hemispheres: the dry northeasterly continental trade wind, the so-called Harmattan flow, and the moist monsoon originating in the South Atlantic Ocean. The ITCZ extends over large
areas of rain forest. This zone, sometimes ill-defined, can be
detected by wind profiles, dew point, and temperature discontinuities in the first kilometers of the atmosphere. Its latitudinal position is linked to the apparent motion of the
Sun, and its ground trace moves from about 20øN in July, to
its most southerly position about 4ø-5øN in December. Its seasonal shift determines the rain pattems and involves the altemation between wet and dry (i.e., burning or fire) seasons. In the EXPRESSO area (southern CAR and northem Congo) the dry season lasts from November to March (ground trace of ITCZ: from 4 ø to 8øN), and the wet season lasts from April to October (ground trace of the ITCZ: from 8 ø to 20øN). Figure
1 shows the evolution of rainfall patterns throughout the year (data taken in 1992-1993). The field campaign lasted from
November 21 to December 2, at the transition between wet
and dry seasons, which involved a strong instability of the layers of the lower troposphere. During EXPRESSO the monsoon dominated the flow in the ABL which rarely exceeded 1000 m in thickness. However, during short periods, (November 29 and 30) the monsoon flow gave way to the Harmattan flow in the ABL because of the proximity of the ITCZ at this period of transition. During daytime the monsoon layer can be assimilated to the mixed layer (or ABL), limited at the top by a strong temperature inversion and a humidity gradient. During the first week of the campaign, the ground
trace of the ITCZ was located around 7ø-8øN, and moved southward to 5øN at the end of the campaign. As a consequence, meteorological features in the savanna and the forest during the campaign became complicated by the proximity of the ITCZ.
2.2. Fire Distribution
Pyrogenic emissions in the northem African tropics occur mainly in the savanna zone, between 5 ø and 15øN. Generally, the fire period (corresponding to the dry season) begins in early November, peaks in January, and ends in February/March [Cahoon et al., 1992]. This scenario depends on climatic conditions and may undergo important year to year variations. During this period the wide band of fires sweeps across savanna zones from the south of the Sahara desert to the borders of the equatorial rain forest. Between the Sahara desert and the rain forest several climatic domains exist, def'med by distinct patterns: annual rainfall, relative
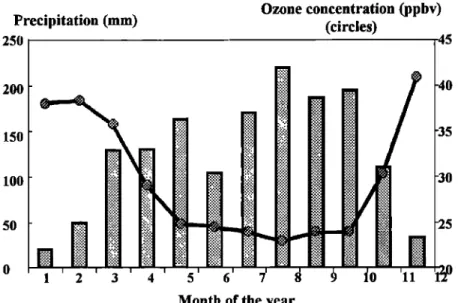
Precipitation (mm) 250 200 150 100 50 0 1 2 3 Ozone concentration (ppbv) (circles) 40 5 30 5
•
1•0 11 ;1•
0
Month of the year
Figure 1. Evolution of surface ozone concentration with rainfall regime in Bangui (CAR). Each point (circle)
represents
the monthly
mean
value
of daily
maximum
surface
ozone
mixing
ratio
measured
during
1992
and
CROS ET AL.' SOURCES AND SINKS OF OZONE IN SAVANNA AND FOREST AREAS 29,349
7000
--Dry
season
I
Ozone profiles during wet and dry seasons ---Wet season
6OOO 5000 ,--, E•, 4000 • 3000 2000 lOOO 20•04/94
20/12/93
0 10 30 40 50 60 70 80 90 100 Ozone concentration (ppbv)Figure 2. Typical vertical ozone profiles (0-5000 m) over Bangui (CAR) during the wet season (April 1994) and the dry season (December 1993). ()zone data were recorded between 1100 and 1400 LIT.
humidity, average temperature, and relative length of the seasons. These patterns are laid out in parallel latitudinal belts [Leroux, 1980]. The associated climatic conditions determine the temporal and spatial evolution of savanna fires. In the northern African tropics the fire front may be considered as a wide strip moving from the Sahel to the Equatorial forest during the dry season (between November and February) as shown by Grdgoire et al. [ 1999]. In the EXPRESSO zone (1.3
106
km
2) the number
of daily detected
fires varied
between
1200 and 3760 for the period November 19 to 28. These fires were mainly located in the north CAR near the borders of
Sudan and Chad. Some of them were located very close to tile forest zone, and their influence on the chemical coinposition of the atmosphere was quite important.
2.3. Seasonal and Vertical Ozone Distributions
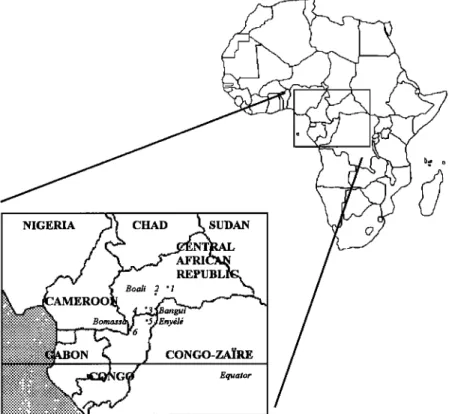
To choose the best period for an important field experiment in CAR, preliminary studies were conducted in Bangui (4øN, 18øE). Surface ozone measurements were performed between January 1992 and December 1993 using UV absorption instrumentation, and 16 ozone sondes were launched between December 1993 and April 1994. Figure 1 gives the evolution
NIGER
ß
i::••,..::::...•..
AM
E
RO
O
•
Equator
Figure 3. Map of central Africa showing the area investigated and the studied sites (1, 2, woodland savanna;
29,350 CROS ET AL.' SOURCES AND SINKS OF OZONE 1N SAVANNA AND FOREST AREAS
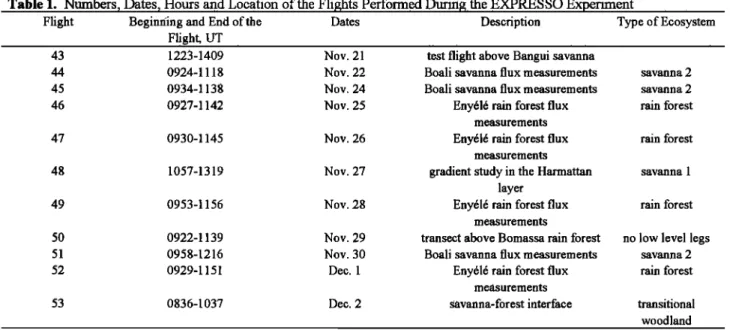
Table 1., Numbers, Dates• Hour san, d Locatio n of the Flights Performed During. the EXPRESSO,Experirnent
Flight Beginning and End of the Dates Description Type of Ecosystem
F!!ght, UT ...
test
flight
above
Bangui
savanna
43 1223-1409 Nov. 21
44 0924-1118 Nov. 22 Boali savanna flux measurements savanna 2
45 0934-1138 Nov. 24 Boali savanna flux measurements savanna 2
46 0927-1142 Nov. 25 Eny616 rain forest flux rain forest
measurements
47 0930-1145 Nov. 26 Eny616 rain forest flux rain tbrest measurements
48 1057-1319 Nov. 27 gradient study in the Harmattan savanna 1 layer
49 0953-1156 Nov. 28 Eny616 rain torest flux rain forest
measurements
50 0922-1139 Nov. 29 transect above Bomassa rain forest no low level legs
51 0958-1216 Nov. 30 Boali savanna flux measurements savanna 2
52 0929-1151 Dec. 1 Eny616 rain tbrest flux rain forest
measurements
53 0836-1037 Dec. 2 savanna-forest interface transitional
woodland
of monthly mean values of daily maximum surface ozone mixing ratio, calculated from the 2-year measurement period (1992-1993). There is a strong increase in surface ozone during the dry season: the mixing ratio reaches 22 ppbv in October (end of the wet season), and 41 ppbv in December. November can be defmed as a transition period between the two seasons, during which the rainfall decreases strongly in Bangui (from 190 mm in October to 25 mm in December). The EXPRESSO campaign was conducted at this exact period of the year. In rain forest zones, south of the ITCZ, the alternation of seasons is far less marked in rainfall patterns than in savanna zones. The strong seasonal cycle of surface ozone in Bangui shown in Figure 1 has also been observed in other sites of tropical Aftfica influenced by biomass bm•ing.
Our data were recorded at the beginning of the dry season, when the ozone increases considerably. During this season in the Harmattan layer (HL, layer where the Harmattan flow blows), ozone mixing ratios, obtained from ozone soundings, are typically 70-80 ppbv, with maximum values up to 95 ppbv (Figure 2). The rate of ozone production increases from the wet to the dry season [Cros et al., 1996]. The ozone increase in Dobson Units (DU) is about 35% in the HL (from 1.5 to 4 km), and about 12% in the ABL beneath.
2.4. Sampling Area for EXPRESSO (November- December 1996)
Airborne flux measurements of ozone at different levels and vertical ozone profiles were conducted along a 500 km
transect, from the savanna of CAR to the tropical forest of the Congo. The direction of this transect is approximately the direction of the Harmattan wind, which transports the biomass burning effluents in the lower troposphere. To facilitate the airbome flux measurements, the different measurement areas were selected on the basis of the homogeneity of the ecosystems: woodland savannas, savanna-forest transition, secondary, and primary forests. Six areas located between 2ø10'N and 5ø50'N were investigated during the EXPRESSO campaign, as shown in Figure 3. The ARAT flew 11 missions (flights 43 to 53, Table i) from its ground base in Bangui (CAR), during the twelve operational days. The flights were carried out over the savanna near Boali and Sibut (sites 1 and 2), over the transitional area near M'BaYki and Ngotto (sites 3 and 4), and over the rain forest near Bomassa and Enyele (sites 5 and 6). The coordinates are given in Table 2. The flight plans were designed to study surface fluxes above the canopy of these different vegetal covers, and fluxes at the top of the boundary layer.
2t. Ozone Turbulent Fluxes and Deposition
Velocities
3.1. Measurement Techniques
Vertical fluxes of ozone ((I)) were measured in the
atmospheric surface and boundary layers by the EC method. The EC method is based on the computation of covariances of the fluctuations of the vertical wind component (W') and the
Table 2. Coordinates and Names of the Different Types of Ecosystems
Name of the Site Coordinates, deg Type of Ecosystem
Bangui 4.22øN, 18ø35E
Boali 4ø48N, 18ø07E savanna 1
Sibut 5ø44N, 19ø05E savanna 2
M'Bai'ki 3ø53N, 18ø00E transitional woodland
Ngotto 4ø08N, 17ø15E secondary forest
Bomassa 2ø13N, 16ø23E primary rain tbrest
Eny616 2ø49N, 18ø06E primary rain forest
CROS ET AL.' SOURCES AND SINKS OF OZONE IN SAVANNA AND FOREST AREAS 29,351 ozone concentration (O3') [Weseley et al., 1982]. The ozone
flux is given by
ß =
W'O;
=
1.•.j•
W'(t)O}
(t)dt
(1)
The primed symbols denote the fluctuations of the corresponding variables, and overbars refer to averages over successive time interval. The averaging rime of flux measurements is about 5 min and corresponds to a path length of 50-60 km, with an aircraft speed around 100 m/s. This method requires the use of fast-response sensors. The OSG2
chemiluminescent sensor was used for ozone measurements, and is described by G•nsten et al. [1992] and Gansten and Heinrich [1996]. This sensor has a response time faster than 0.1s and a detection threshold of 50 pptv. Its calibration was checked by comparison with a more slowly responding ozone sensor, a commercial UV absorption instrument (Thermo- Electron model 49), submitted to pressure and temperature controls. This last analyzer was also used for ambient ozone
measurements.
Aircrat•-based measurements of ozone fluxes by the EC method [Lenschow et al., 1981; Affre et al., 1999a] involve the following: (1) simultaneous measurements of ozone and wind fluctuations, (2) assessment of ozone flux accuracy, and (3) calibration of ozone fluctuations. To minimize the flow
distortion, wind fluctuation sensors are located on the nose boom of the aircraft, far from the OSG2 ozone sensor (located in the cabin). As a consequence, ozone measurements are delayed compared with wind fluemarion measurements, and the time lag must be estimated to correct its effects.
We evaluate this time lag by studying the lagged correlation between temporal series of ozone fluctuations measured with the ozone sensor in the cabin, and humidity fluctuations measured with the <<Lyman Or,>> hygrometer on the boom, near the wind sensor. Ozone and humidity fluctuations are strongly anticorrelated in the lower
troposphere of this region (Figure 4a). The process explaining
the anticorrelation can be described as follows: dry deposition processes over a dense vegetation typically involve a downward flux of ozone molecules in the ABL. At ground level the evapo-transpiration provides an upward flux of humidity, and at the top of the ABL exchanges with the drier and enriched ozone upper layer intensify the downward ozone fluxes, and increase the anticorrelation. The absolute value of the correlation coefficient between ozone and humidity fluctuations (Figure 4b) is maximum when the measurements are performed in the same air parcel. The position of this maximum gives a good estimation of the time lag between ozone and humidity measurements. This value is constant and
1 m 0 ,•-2 0 -3 "- -4 •:-5
Temporal evolution of ozone and water vapor Water vapor ... Ozone 0 2o 4o 6o 8o 100 120 Time {s) 140 160 7 -3 t 80 200
b Delayed correlation between ozone and water vapor
0,2 •. _•J '\ \ r \ / 0,1 0 -0,1 -0,2 -0,3 -0,4 -0,5 -0,6 -0,7 -0,8 -3 -2 -1 0 1 2 3 Time (s)
Figure 4. (a) Temporal series (one point every 1/16 s) of ozone (measured in the vein) and water vapor (measured in the boom); (b) Correlation function between ozone and water vapor measurements.
29,352 CROS ET AL.' SOURCES AND SINKS OF OZONE IN SAVANNA AND FOREST AREAS
0.2
• o.1
ii
• 0.2
Comparison between f(T) and its regression line
0 0.5 1 1.5 2 2.5 3 3.5
Time (m_in)
Figure
5. Correlation
coefficient
between
f(T) (sensible
heat
flux,
in W/m
2, divided
by 1100)
and
its
regression
line.
ot
= 0.378
is the
slope
of the
regression
line.
The
shaded
areas
correspond
to c•a = 0.0427,
standard
deviation
between
f(T)
and
its regression
line.
•c•Rm
= 12%
gives
the
accuracy
of the
flux
calculation.
equal to 0.4 s for all flights, at each level, when the altitude and the velocity of the plane (100 m/s) are constant. •lae absolute mean value of the correlation coefficient between
ozone and humidity measurements during the campaign is
0.82, with a standard deviation of 0.14.
A Teflon tube (1/4 inch) allowed the sampled air to be
driven from the boom to the 03 sensor located in the cabin,
and created an attenuation of high frequencies in the air
vertical velocity. The result is an underestimation of ozone
fluxes,
assessed
by comparing
water
vapor
fluxes
on the
aircraft boom and in the inlet tube. This comparison gave a underestimation less than 12%. The theoretical explanation ofthe comparison
between
water
vapor
fluxes
is not the purpose
of this paper, and is given elsewhere by Affre et al. [1999a].The major
attenuation,
(around
12%)
having
an effect
on the
ozone flux is due to its attenuation in the vein. The attenuation
due to the time constant of the OSG2 (0. l s) can be considered
as minor, and is not taken into account.
The comparison of the mean ozone concentrations [O3]ref and [O31osa2, obtained with the slow (i.e., reference) and the fast ozone sensors, respectively, gives a calibration coefficient
C, defined by
[O3]ref '- C X [O31oSG2. t2)
This coefficient gives the ozone flux 60 in a useful unit
(ppbv m/s). C may vary from flight to flight, and may
introduce an error of 1-5% in the flux measurement, depending on the flight. Turbulent vertical ozone fluxes are
calculated with the EC method, according to equation (1). In calculating the flux by (1), one must make an assumption of
stationarity. The function f(T) can be defined as follows:
f(T)=
I• W'(t)O;(t)dt
(3)
The evolution of fiT) determines the accuracy of the flux. ½ is well-determined when the derivative of f(T) does not depend on the integration time T (i.e., the calculation is accurate only if the turbulence is stationary). The clos er the
turbulence is to stationarity, the more linear is f(T), and the more accurate is the flux. This can be quantified by the correlation coefficient between f(T) and the linear regression
line to f(T), that is the closest line to f(T) in the sense of linear
regression. When the transfers are stationary, f(T) is linear
and coincides with its linear regression line. When turbulent transfers are not stationary, f(T) is nonlinear, the linear regression line differs from f(T), and the evaluation of the flux is less accurate [Affre et al., 1996].
The standard deviation between f(T) and its linear
regression
line
is called
cr•o.
Affre
et al. [1999a,
1999b]
use
the ratio between cr•o and a (the slope of the regression line), a good criterion of the stationarity of transfers. •r•c,/a is large (close to 100%) when the transfers are nonstationary. This
criterion, expressed in percent, gives an estimate of errors in the flux calculation (Figure 5 and Table 3).
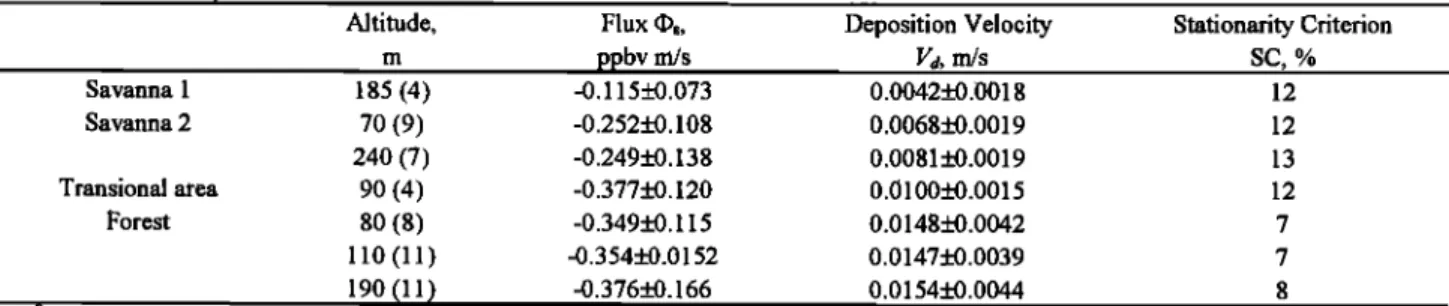
Table 3. Fluxes and Deposition Velocities of Ozone in the Surface Layer Over Different Sites Representing Savannas,
Transitional Area, and Rain Forest in Central Africa a
Altitude, Flux •s, Deposition Velocity Stationarity Criterion
m ppbv m/s Vd, m/s SC, % Savanna 1 185 (4) -0.115_+0.073 0.0042_+0.0018 12 Savanna 2 70 (9) -0.252_+0.108 0.0068_+0.0019 12 240 (7) -0.249_+0.138 0.0081_+0.0019 13 Transional area 90 (4) -0.377_+0.120 0.0100_+0.0015 12 Forest 80 (8) -0.349_+0.115 0.0148_+0.0042 7 110 (11) -0.354_+0.0152 0.0147_+0.0039 7 190 (11) -0.376__+0.166 0.0154__+0.0044
CROS ET AL.' SOURCES AND SINKS OF OZONE IN SAVANNA AND FOREST AREAS 29,353
Finally, density corrections for air temperature fluctuations must be added to flux measurements of ozone as a result of the fact that density is not a conserved quantity. Heat and water vapor transfers induce a mean vertical mass flux, which is not taken into account in eddy correlation calculations. This correction, first applied by Webb et al. [ 1980] on water vapor and CO2 measurements, can be expressed for ozone by the equation:
(I)(O3)corr-'
(I)(O3)ra
w q-
0.85[O3]ppbv
(0.649
lif o •E
+ 3.358
10
-6
H)
(4)
where
$[ is the
latent
heat
of vaporization,
and
where/•E
and
H are the latent and sensible heat fluxes, respectively (in W
m'2). This correction
is generally
weak (around
4% in
average).
3.2. Deposition Velocity
The ozone deposition velocity can be written as follows ß
V d: -- (I)
(O
3
)/X (O
3
)
(5)
where x(%)is the corresponding ozone mixing ratio. By
convention, a downward flux is negative, so that Va is positive for deposition.
During the campaign the deposition velocity • was deduced (for some flights) from EC measurements and from the mean ozone concentration. Va is calculated from the fast-
response ozone sensor assuming that ozone concentrations
were accurate and that the time lag has been corrected:
The transect investigated by the flights covers woodland savannas to rain (also called primary) forest. Savanna 1, in the northern part of the EXPRESSO area, is covered by woodland savanna. Savanna 2, around Boali, west of Bangui, is also covered with woodland savanna but with h•gher grass and tree densities than in savanna 1. The primary forest •s located near Enyele, 200 km south of Bangui, and at Bomassa, 350 km southwest of Bangre, both in Congo. Between Bangui and the
they give similar results.
Generally,
the
turbulent
fianctions
are
more
stationary
over
forest
than
over
savanna
because
the
ground
coverage
is more
homogeneous, and the fire perturbations weaker. The criterion
6Fcr•o,
defmed
at the
end
of part
3.1, is lower
over
forest
(7-
8%) than
over
savanna
(12-13%),
indicating
a more
precise
flux measurement over forest.
Although
ozone
flux xneasurements
over
African
tropical
savanna areas are scarce, several studies have been conducted
over rain forest. Cros et al. [ 1992a] estimated ozone fluxes in
the
mixed
layer
from
tethered
balloon
measurements,
using
a
gradient method. Similar values of ozone fluxes were
observed
in the northern
Congo near the forest area
investigated
during
EXPRESSO.
The average
flux during
EXPRESSO
was
-0.32
+/- 0.11
ppbv
m/s
in the
morning.
In
the
central
Amazon
forest,
vertical
fluxes
of O3
measured
by
Fan et al. [1990]
at the top of the canopy
were
about-0.115
ppbv rn/s in average, a factor of 2 lower than our values.Corresponding
deposition
velocities
(1.8 cm/s)
were
slightly
higher than ours, but allow the conclusion that the forest
investigated
during
EXPRESSO
is close
to the equatorial
forest of the American continent. Indeed, Table 3 indicates a
surface
ozone
flux of- 0.115 ppbv
ms
-• over
savamm
1, and
quasi-constant
ozone
flux in the lowest
layer
of savanna
2 (-
0.252
ppbv
ms
4 at 70 m and
-0.249
ppbv
ms
-• at 240
m). We
found also -0.376 ppbv ms -•' over rain forest at 190m. These
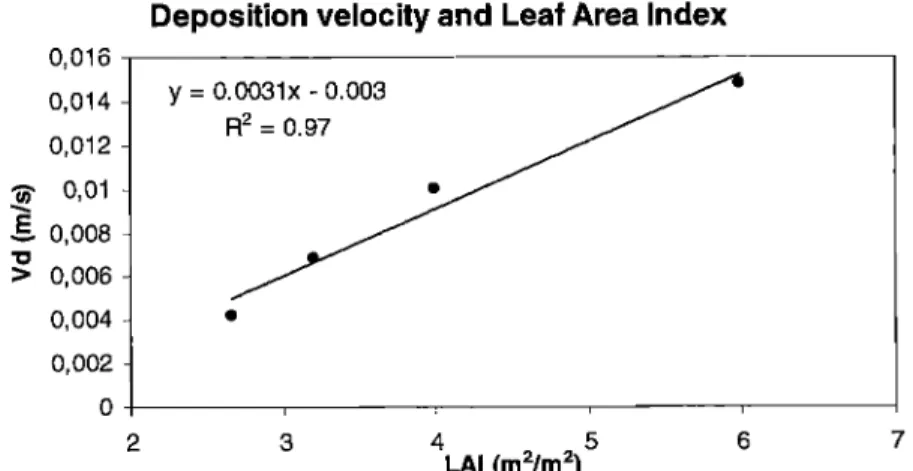
results show that the ozone surface flux increases in absolute value from savanna (north of the EXPRESS() zone) to rain forest (south of the zone), with values ranging from -0.115 ppbv m/s to -0.35 ppbv m/s. The decrease of the deposition velocity Fa with latitude is regular, with values ranging from 0.4 cm/s for northern savanna to 1.5 cm/s for rain forest. They can be compared to values found over a coniferous forested area in Southwest of France (around 0.5 cm/s during the day [Carrara, 1998]), due to the turbulence intensity and to surface reactions (the principal component is the stomata opening), depending on biomass density, and therefore on LAI.
To better understand the evolution of V• with the landcover, we compared I• to the Leaf Area Index (LAI) of each site. The LAI (ratio of the total leaf area to the area of
primary forest, the a•rcraft flew over a transitional zone of the ground) was measured in central Africa during degraded (or secondary) forest and small savanna. Table 3 EXPRESSO by Klinger et al. [1998] during 1995 and 1996 summarizes the surface fluxes and deposition velocities based along an 800 km transect from grassland savanna to primary
on EC measurements in the lower part of the ABL over these forest. It appears, as shown in Figure 6, that there is a linear
sites. Forest sites are not distinguished on Table 3 because relation between Fd and LAI given by the following relation:
0,016 0,014 0,012 0,01 0,008 o, 006 0,004 0,002 0
Deposition velocity and Leaf Area Index
y = 0.0031x
- 0.003
R 2 = 0.97
2 3 4 5 6 7
LAI (m2/m 2)
29,354 CROS ET AL.' SOURCES AND SINKS OF OZONE IN SAVANNA AND FOREST AREAS
Vd
= 3xlO
'3 (L/d-l)
(7)
where
Va
is in m s
4 and
LAI in m
2 of leaf
per
m
2 of ground.
To show that in our case, surface reactions are the essential
cause for the spatial variability of ozone deposition, we use the following defmition for Va. In terms of resistances,
1
= (8)
ra +rb + r,
where r• is the aerodynamic resistance, rb is the laminar
sublayer resistance, and rc is the surface resistance. According
to Cieslik and Labatut [ 1997],
ZM
ra= • dz
(9)
z0'+d KH(Z)
where Ku(z) is the vertical turbulent diffusion coefficient for scalars, z is the height, Zo is the roughness length, zM is the
height of measurements, and d the displacement height. The
parameters Zo and KH have been calculated during EXPRESSO by Delon et al. [2000]. They are 10m (z0) and
21.9+8.7
m2/s
(KH)
above
forest,
5m (z0)
and
25.8+_7.8
m2/s
(KH) above savanna, respectively. These values were calculated for all low level legs performed under 150m, and averaged over similar ecosystem. Two values only are available for KH and Zo ß one for the savanna (including savanna 1, 2, and transitional woodland), one for the forest (including secondary and primary forest).
The parameter d is taken into account only above forest,
which is typically composed of a continuous 35m canopy,
with emergent trees reaching 60m, and consequently, d=35m.
Above savanna, d=0.
As KH has been averaged, equation (9) simplifies, giving ra = 7 s/m above savanna 1 (zM= 185m), 5.8 s/m above savanna 2 (zu = 155m in average), 3.4 s/m above transitional
woodlands (zu = 90m), and 3.7 s/m above forest (zu = 127m in average).
The calculation of rb for rough ecosystems is taken from Lagouarde et al. [1993]:
3 Sc 2/•
rb
=
ku,
(pr)
(10)
where k=0.4 is the Von Karman constant, u. is the friction
velocity (0.355 m/s above forest, 0.376 m/s above savanna during EXPRESSO [Delon et al., 2000]), Sc=1.07 is the Schmidt number for ozone, and Pr=0.72 is the Prandtl
number. This leads to large values of rb, 25.9 s/m above
savanna and 27.5 s/m above forest.
The resistance rc can be deduced from equation (8), and we found rc = 205 s/m over savanna 1 (Va = 0.0042 m/s), rc = 101 s/m over savanna 2 (Va = 0.0075 m/s in average), rc = 71 s/m over transitional woodlands (Va = 0.0100 m/s), and rc- 35 s/m over forest (Va = 0.0150 m/s in average).
These results allow the conclusion that the evolution of the
deposition velocity mainly depends of surface resistance r•, (including explicit dependence of LAI), and that the aerodynamic resistance ra does not significantly influence the deposition velocity over the forest.
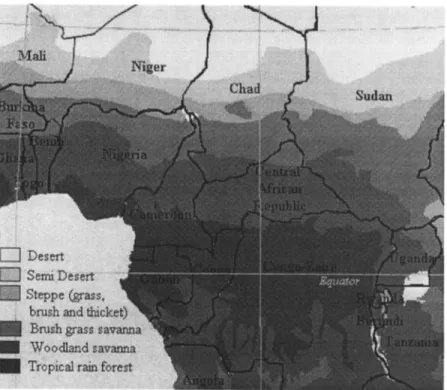
These results suggest that Va could be extrapolated over a whole latitudinal band, since the vegetation in Africa is distributed uniformly in latitude (Figure 7). In other words, the estimation of the LAI at a given point could give an order of magnitude of Va, across the African continent. Of course, this is only valid when the aerodynamic resistance is low, and in the case of homogeneous surfaces on the same latitudinal band. Furthermore, the forest LAI does not vary throughout the year, whereas it decreases in the savanna at the height of fire season. We can assume that relation 7 is valid from April to December, and that it can be applied only in those
individual cases.
CROS ET AL.: SOURCES AND SINKS OF OZONE IN SAVANNA AND FOREST AREAS 29,355
4. Ozone Budget in the ABL Over Tropical
Rain Forest
To analyze the ABL ozone budget over the tropical rain forest of the EXPRESSO area, a slab model proposed by Lenschow et al. [1981] is used. In this model the ozone rate of
change
with time 0•½ais
balanced
by mean
horizontal
advection
•[•0•, vertical
flux
divergence
•(w'o;)/•z,
and
photochemical production P(O3) and/or loss L(O3) of ozonewithin the same volume:
0t 0x
Because of flight constraints, the vertical profiles used for the estimation of ozone change were not performed over the same location. However, this is not a critical point for reactive compounds such as ozone, since the Congo rain forest basin over which it was measured is a homogeneous area. Above the forest the time derivative was estimated in the lowest part of the ABL from mean values of ozone mixing ratios. The lowest part of the ABL is generally well-mixed and does not show high ozone variations, compared with the HL above. If we take the example of flight 50, where the ozone increase was particularly easy to calculate, we can estimate the vertical flux divergence without difficulty. In the HL a net ozone production of 19 ppbv/h was estimated from the two profiles, the time difference between the two profiles being half an hour (Figure 8). A regular increase of [03] is also found on the leg performed between the two profiles of flight 50 (the leg was performed in the HL). This ozone increase corresponds to an ozone production of about 10.5 ppbv/h in the HL, far lower than the 19 ppbv/h calculated from the profiles. The difference is attributed to advection, which plays an important role in the HL.
In the ABL the problem is different, and advection can be neglected. CO •s used as a reference to evaluate the influence
of the advection in the ABL because it can be considered as
an inert tracer on the time scales and space scales of the campaign. Figure 9 shows that there is no CO increase from the beginning to the end of a leg performed in the ABL (750
m). The low CO variation allows the conclusion that CO is not advected from the north in this layer. If we assume a similar origin for CO and ozone precursors, we can say that the impact of horizontal advection is negligible on the ozone temporal variation in the ABL. Moreover, the ozone increase calculated on the leg is 9.2 ppbv/h, compared with 9.96 ppbv/h from the profiles performed before and after this leg. This adds support to the assumption that advection is negligible for ozone production in the ABL.
The vertical flux divergence can be approximated by the
difference between the flux across the top of the ABL ( and the surface flux (6Os), divided by the ABL thickness Z•.
Advection is neglected, and the net rate of ozone change in
the ABL over the forest becomes:
0k]
&=
P(O3)-L(O3)-(CI)H•
z i--
CI)s) (12)
The vertical ozone flux at the top of the ABL 6b• results
from entrainment of air from the HL into the ABL, and is given by
\
where
V, is the entrainment
velocity
and A[O3]
is the ozone
mixing ratio change across the top of the ABL. The lifetime of ozone, which is around 2 days, allows the assumption that V, is independent of chemical species, and that it can be calculated from the vertical transport of water vapor across the top of the ABL:
Ve_
W'q.•"
Aq_ L•E
pLAq(13)
where
LE
=pLW'q'
is the latent
heat
flux (W/m2),
,O is the air
density, L is the latent heat of water vaporization, q' is the
water
vapor
mixing
ratio fluctuation,
and Aq is the jump of
water vapor mixing ratio between layers situated just below and just above the top of the ABL. The water vapor mixing
ratio (measured on the boom of the aircraft) is first calculated
at each level, then Aq is evaluated across the top of the ABL [Delon et al., 2000]•
The values of V, and corresponding •9• are given in Table
4. During the dry season over rain forest, the input of ozone from the HL around noon is higher than the ozone deposition,
Ozone profiles during flight 50 (29/11/96)
3000 2500
• 2000
'o 15001000
••••.•
•,•:•:::•'" , ... Profile 10
",
...•Z
,
,
,
0 20 40 60 80 100 Ozone (ppbv)Fibre 8. Ve•ical profiles of ozone obtained on November 29, 1996 (flight 50), just before •e Bomassa forest •rofile 1) and over the Bomassa forest •rofile 2).
29,356 CROS ET AL.' SOURCES AND SINKS OF OZONE IN SAVANNA AND FOREST AREAS Temporal series of ozone and CO concentrations
(flight 50, leg in the ABL)
350 65 ... Ozone 60 300 _ 55 50•, > 250 "" O 40 0 200 35 ¸ 15o 30 25 100 .... 20 11:03:50 11:11:02 11-18:14 11:25:26 11:32:38 Time (h)
Figure 9. Evolution of [CO] (ppbv) and [03] (ppbv) at a constant altitude in the ABL between profiles 1 and profiles 2 of flight 50. Grey and black lines give the linear regression of temporal evolutions of ozone and CO concentrations, respectively.
on average -0.648 ppbv m/s compared with -0.3 50 ppbv m/s, corresponding to a net ozone downward vertical transport of about 1.2 ppbv/h in the ABL (the ABL thickness above forest is 925m in average). Over savanna, entrainment and surface fluxes are lower and the net vertical transport is only 0.5 ppbv/h.
Average net 03 production P'(O3) = {P(O3) - L(O3)} can be compared to that calculated from the photo-stationary state (PSS) of NOx and ozone:
P'(O3) = JNO2 .[NO2] - k [NO].[O31. (14) The photolysis rate JNO2 and the NO2 and NO concentrations were measured on board during each flight [Marion et al., 2000]. The kinetic constant used for the
reaction
NO + 03 was
k = 1.8x10
'12
exp(-1370/T)
[Atkinson
et
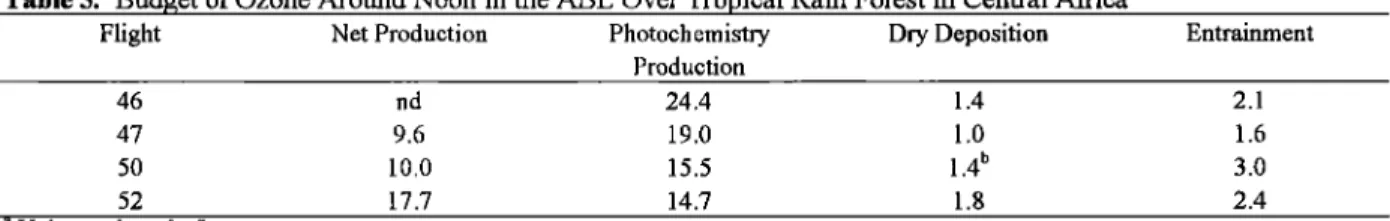
aL, 1992]. As an example, P'(O3) calculated for flight 50 is 15.5 q-2.8 ppbv/h (Table 5).
03 production rates from PSS are higher than the values obtained from the net production (Table 5), possibly because of high values of [NO2] and high [NO2]/[NO] ratios [Marion et aL, 2000] . NO2 could be formed from oxidation of NO by peroxy radicals, abundant in the tropical lower troposphere [Hough, 1991]. Nonetheless, the PSS is likely to overpredict the 03 production since it represents the total NO to NO2 conversion, including different reactions from NO + 03 --> NO2 + 02 [Kramp and Volz-Thomas, 1997]. However, a
quasi-balanced ozone budget can be found in some cases. Flight 52 for example, (performed above forest on December 1, 1996) is a good illustration of nearly steady state conditions (Table 5)•
The ozone budget is also strongly influenced by photochemistry processes, remaining the most important mechanism for ozone production over the tropical forest during the fire period.
Indeed, high concentrations of NOx (1.4 to 2.2 ppbv) were observed in the forest ABL (Marion et al., 2000) during EXPRESSO (Figure 10, flight 50 is an example of high NO concentrations), and can be compared to values found in a nearby site during the DECAFE experiment in February 1988 (1.6 to 2 ppbv) [Cros et al., 1992b].
Quite urnform NOx (= NO+NO2) levels in the ABL characterize homogeneous NO,, sources, and NOx/NOy ratios
close
to
unity
indicate
that
NO,,
sources
are
close,
where
+N•
is the reactive odd nitrogen given by NOy = NOx (nitrogen products of atmospheric oxidation). In the HL, the
NOx/NOy ratio falls to 0.5 and NOx concentrations are lower,
characteristic of a photochemically older air mass. Nitrogen compounds in the ABL are for the most part emitted from soils and/or developed in the ABL, and downward transport from the HL is small. Accordingly, the high ozone production observed above the forest around noon (Figure 8) cannot be accounted for vertical transport alone but must be
Table 4. Entrainment Velocity Ve between HL and ABL, and Corresponding Ozone Flux cI)nL at the Top of the ABL
(i.e., at Zi) a
Flight
Zone
Zi, m
A[O3],
Ve
,
(I)nL
ppbv cm/s ppbv m/s ppbv m/s 46 F 800 36 -2.07 -0.745 -0.342 47 F 900 47 -0.88 -0.414 -0.262 50 F 1000 31 -2.47 -0.766 nd 52 F 1000 28 -2.38 -0.666 -0.508
Average
925
-1.95
-0.648
-0.350
b
48 S1 1060 1060 -1.56 -0.250 -0.115(l)s is the flux at the surface. F stands for rain forest, and Sl is savanna 1. Here, nd is non determined. Averaged for all flights over forest.
CROS ET AL.' SOURCES AND SINKS OF OZONE IN SAVANNA AND FOREST AREAS 29,357
3OOO
NOx profiles (flight 50)
...•.•
Profile
•1
2500 •.• Profile 10000
••
""•'•
,
500 700 900 11 O0 1300 1500 1700 1900 21 O0 2300 2500 NOx (pptv)Figure 10. Ozone (ppbv) and NOx (pptv) profiles for profile 2 of flight 50.
2000
1500
significantly influenced by photochemical production from biogenic precursors, which may accumulate during the night and in the early morning [Cros et at, 1992a; Marion, 1998] and/or from fire effluents. Thus ozone profiles suggest that photochemical production and vertical transport are largely stronger than deposition and other ozone sinks. However, high levels of primary combustion products (CO, condensation nuclei, NOx) found in the forest ABL indicate a contamination by combustion products [Delon et al., 2000].
This contamination decreases the ozone content in the forest
ABL only if sources (fires) are close enough, since the ozone will be destroyed in reaction with strong and fresh concentrations of NOx. The forest ABL may be contaminated by fires in the geographical transition zone, where the Harmattan flow competes with the Monsoon flow near the ground (transition between wet and dry seasons in the Northern Hemisphere). Moreover, scarce forest fires were detected by satellites during the campaign [Gr•goire et al.,
1999].
High concentrations of ozone precursors suggest in part that photochemistry is the most important process for the
ozone formation in the forest ABL. The contribution of
entrainment processes at the top of the ABL, involving inlets of enriched ozone air masses in the ABL, is also consequent.
5. Summary and Conclusions
The EXPRESSO campaign took place in central Africa in November and December 1996 at the beginning of the dry season. Meteorological features of the studied zone were influenced by the proximity of the ITCZ, located at 5ø-6øN at the end of the campaign. The chemical composition of the
atmosphere was influenced by biomass burning, occurring mainly in the north of the EXPRESSO zone. Turbulent ozone fluxes were measured over savanna and rain forest with an aircraft designed to study turbulent processes in the first 4 km of the atmosphere. Deposition velocities were deduced from surface ozone fluxes. They increase from the savanna to the forest: ozone fluxes range from -0.12 to -0.38 ppbv m/s, and deposition velocities range from 0.4 to 1.5 cm/s. Around noon (time of the measurements) we observe a positive gradient
between savanna and forest surface fluxes, and an
approximately 1.inear relation between deposition velocity and LAI. This relation highlights the role of vegetation cover and surface resistance. For a known LAI a latitudinally constant structure of Vd was suggested by this linear relation, assuming that the vegetation is distributed in linear bands on the African continent and that ra is small.
Ozone deposition was largely dominated by transport from above as indicated by high entrainment fluxes at the top of the ABL. The contribution of advection in the HL and in the ABL is estimated from aircraft legs and profiles, which show that the role of advection is negligible in the ozone budget. NO emission rates were measured in the experimental zone by Serra et al. [1994], and indicate that the forest is an 03 sink. Indeed, tropical forest soils could provide large inputs of odd nitrogen species to the atmosphere, which may be important for global atmospheric chemistry [Kaplan et al., 1988]. Above the EXPRESSO rain forest, around noon, ozone is produced through photochemical reactions, involving fresh precursors coming from forest soils and sometimes from nearby fires. High concentrations of ozone precursors in the ABL give an explanation to the /hct that the photochemical production over the canopy is the dominant contribution to the ozone budget in the forest ABL.
Table 5. Budget of Ozone Around Noon in the ABL Over Tropical Rain Forest in Central Africa a
Flight Net Production Photochemistry Dry Deposition Entrainment
Production
46 nd 24.4 1.4 2.1
47 9.6 19.0 1.0 1.6
50 10.0 15.5 1.4 b 3.0
52 17.7 14.7 1.8 2.4
Units are in ppbv/ho
29,358 CROS ET AL.: SOURCES AND SINKS OF OZONE IN SAVANNA AND FOREST AREAS
Acknowledgments. We thank the gouvernments of the Congo and CAR for the permission to conduct our investigation. We gratefully
acknowledge the scientific and technical crew of the research aircraft
ARAT. This research was supported by the Centre National de la
Recherche Scientifique.
References
AlOe, (3., A. Carrata, J. Fortran, A. Druilhet, and A. Lopez, On
turbulent flux of trace constituents measurements in the surface
layer, Part I, Tests on vertical velocity stationarity, Phys. Che•
Earth, 5-6, 357-360, 1996.
Affre, C., A. Carrara, F. Lefebre, A. Druilhet, J. Fontan, and A.
Lopez, Aircraft measurement of ozone turbulent flux in the atmospheric boundary layer, Atmos. Environ., 33, 1561-1574,
1999a.
Affre, C., A. Lopez, A. Carrara, A. Druilhet, and J. Fontan, The
analysis of energy and ozone flux data from the LANDES 94 experiment, Atmos. Environ., 34, 803-821, 1999b.
Andreae, M.O., A. Chapuis, B. Cros, J. Fontan, G. Helas, C. Justice, Y.J. Kaufman, A. Minga, and D. Nganga, Ozone and Aitken nuclei over equatorial Africa: Airborne observations during DECAFE 88, J. Geephys. Res., 97, 6137-6148, 1992.
Atkinson, R., D.L. Baulch, R.A. Cox, R.F. Hampson Jr., J. A. Kerr, and J. Tree, Evaluated kinetic and photochemical data for atmospheric chemistry: Supplement IV, J. Phys. Chem., Ref.
Data, 21, 1125-1568, 1992.
Cachier, H., and J. Ducret, Particulate carbon traces biomass burning influence in rains of Equatorial Africa, Nature, 352, 228-230,
1991.
Cahoon, D.R., Jr., B.J. Stocks, J.S. Levine• W.R. Coffer III, and K.P. O'Neill, Seasonal distribution of fires, Nature, 359, 813-815,
1992.
Carrara, A., Quantification et param•trisation des flux d'ozone /• l'interface v•g•tation atmosph/:re : Application /tun couvert
forestier de r•sineux, Ph.D. thesis, Univ. Paul Sabatier, Toulouse, France, 1998.
Cieslilc, S., and A. Labatut, Ozone and heat fluxes over a
Mediterranean pseudosteppe, Atmos. Environ., 31, 177-184, 1997. Cros, B., R. Delmas, D. Nganga, and B. Clairac, Seasonal trends of ozone in equatorial Africa: Experimental evidence of photochemical formation, J. Geephys. Res., 93, 8355-8366, 1988. Cros, B., J. Fontan, A. Minga, G. Helas, D. Nganga, R. Delmas, A.
Chapuis, B. Benech, A. Druilhet, and M.O. Andreae, Vertical
profiles of ozone between 0 and 400 m in and above the African equatorial forest, J. Geephys. Res., 97, 12,877-12887, 1992a.
Cros, B., D. Nganga, A. Minga, J. Fishman, and V. Brackett,
Distribution of tropospheric ozone at Brazzaville, Congo, determined from ozonesonde measurements, J. Geephys. Res., 97,
12,869-12,875, 1992b.
Cros, B., A. Brou, D. Orange, M. Dimbele, and J.P. Lacaux, Tropospheric ozone on both sides of the equator of Africa, in Biomass Burning and Global Change, edited by J.S. Levine, pp. 327-332, MIT Press, Cambridge, Mass., 1996.
Delmas R., et al., Experiment for Regional Sources and Sinks of Oxidants (EXPRESSO): An overview, J. Geephys. Res., 104,
30,609-30,624, 1999.
Delon, C., A. Druilhet, R. Delmas, and P. Durand, Dynamic and thermodynamic structure of the lower troposphere above rain forest and wet savanna during the EXPRESSO campaign, J. Geephys. Res., 105, 14,823-14,840, 2000.
Fan, S. M., S.C. Wofsy, P.S. Backwin, D.J. Jacob, and D.R. Fitzarrald, Atmosphere-biosphere exchange of CO2 and 03 in the central Amazon forest, J. Geephys. Res., 95, 16,851-16,864, 1990.
Fishman, J., P. Minnis, and H.G. Reichle Jr., The use of satellite data
to study tropospheric ozone in the tropics, J. Geephys. Res., 91,
14,451-14,465, 1986.
Fishman, J., C. E. Watson, J.C. Larsen, and J.A. Logan, Distribution of tropospheric ozone determined from satellite data. J. Geephys.
Res., 95, 3599-3617, 1990.
Fishman, J., K. Fakhruzzaman, B. Cros, and D. Nganga, Identification of widespread pollution in the southern hemisphere deduced from satellite analyses, Science, 252, 1693-1696, 1991.
Fishman, J., V. G. Brackett, and K. Fakhruzzaman, Distribution of
tropospheric ozone in the tropics from satellite and ozone measurements, J. Atmos. Terr. Phys., 54, 589-597, 1992.
Fishman, J., V.G. Brackett, E.V. Browell, and W. B. Grant,
Tropospheric ozone derived from TOMS/SBUV measurements during TRACE-A, J. Geephys. Res., 101, 24,069-24,082, 1996. Gr•goire, J.M., and S. Pinnoclc, Satellite monitoring of vegetation
fires for EXPRESSO: Outline of activity and relative importance of the study area in the global picture of biomass burning, J. Geephys. Res. 104, 30,691-30,700, 1999.
G•insten,
H., and G. Heinrich,
On line measurementS"
of ozone
surface fluxes, part I, Methodology and instrumentation, Atmos. Environ., 30, 897-909, 1996.
G•nsten, H., G. Heinrich, R.W.H. Schmidt, and U. Schurath, A novel
ozone sensor for direct eddy flux measurements. J. Atmos. Chem,
14, 73-84, 1992.
Hough, A.M., Development of a global tropospheric model: Mod•l chemistry, J. Geephys. Res., 96, 7325-7362, 1991. .i-
Kaplan, W.A., S.C. Wofsy, M. Keller, and J.M. Da Costa, Emission of NO and deposition of 03 in a tropical forest system, J. Geephys. Res., 93, 1389-1395, 1988.
Klinger, L.F., J. Greenberg, A. Guenther, G. Tyndall, P. Zimmerman, M. M'Bangui, J.M. Motsambot•, and D. Kenfack, Patterns in volatile organic compound emissions along a savanna-rain forest gradient in central Africa, J. Geephys. Res., 103, 1443-1454,
1998.
Kramp, F., and A. Volz-Thomas, On the budget of OH radicals and ozone in an urban plume from the decay of C5-C8 hydrocarbons
and NO•, d. Atmos. Chem, 28, 263-282, 1997.
Lacaux, J.P., R. Delmas, C. Jambe• and T.A.J. Kuhlbusch, NOx
emissions from African savanna fires, d. Geephys. Res., 101,
23,585 -23,595, 1996.
Lagouarde, J.P., Y. Brunet, and R.G.B. Andrr, A simple PBL approach for estimating actuel evapotranspiration from TIR data over a pine forest canopy, paper presented at the Workshop on Thermal Remote Sensing of the Energy and Water Balance Over Vegetation in Cunjunction With Other Sensors, Penn State Univ./CEMAGREF/CRPE, La Londe Les Maures, France, Sept.
20-23, 1993.
Lefeivre, B., Etude exprrimentale et par mod61isation des caractrristiques physiques et chimiques des prrcipitations collectres en for•t 6quatoriale africaine, PhD thesis, 206 pp.,
Univ. Paul Sabatier, Toulouse, France, 1993.
Lenschow, D. H., R. Pearson, and B.B. Stankov, Estimating the ozone budget in the boundary layer by use of aircraft measurements of ozone eddy flux and mean concentration, d. Geephys. Res., 86, 7291-7297, 1981.
Leroux, M., Le climat de l'Afrique tropicale, PhD thesis, 1427 pp., Univ. De Dakar, Dakar, Srnrgal, 1980.
Marion, T., Mesures arroportres des oxydes d'azote: Application/t l'rtude des processus de production dans l'atmosph•re tropicale, Ph.D. thesis, Univ. Paris X!I, Crrteil, France, 1998.
Marion, T., P.E. Perres, R. Losno, and F. Steiner, Ozone production efficiency in savanna and forested areas during the EXPRESSO experiment, J. Atmos. Chem., in press, 2000.
Marenco, A., J.C. Medale, and S. Prieur, Study of tropospheric ozone in the tropical belt (Africa, America) from STRATOZ and TROPOZ campaigns, Atmos. Environ., Part A, 24, 2823-2834,
1990.
Serga, D., R. Delmas, C. Jambert, and L. Labroue, Emissions of
nitrogen oxides from equatorial rain forest in central Africa: Origin and regulation of NO emissions from soils, Tellus, Ser. B,
46, 243-254, 1994.
Webb, E. K., G.I. Pearman, and R. Leuning. Correction of flux measurements for density effects due to heat and vapor transfer,
Q. d. R.. Meteorel. Sec., 106, 85-100, 1980.
Weseley, M.L., J.A. Eastman, D.H. Stedman, and E.D. Yalvae, An eddy-covelation measurement of NO2 flux to vegetation and comparison to 03 flux, Atmos. Environ., 16, 815-820, 1982.
C. Afire, B. Cros (corresponding author), C. Delon, A. Druilhet, and A. Lopez, Laboratoire d'Arrologie, Unit6 Mixte de Recherche 5560, Centre National de la Recherche Scientifique/Universit6 Paul Sabatier, Observatoire Midi Pyrrnres, 14 av. E. Belin, 31400 Toulouse, France. (crobL•aero.obs-mip.fr)
T. Marion
and
P.E.
Perres,
Laboratoire
Interunive•sitaire
des
Syst•mes Atmosphrriques, Unit6 Mixte de Recherche 7583, Centre National de la Recherche Scientifique/Universit6 Paris 12, 61 av. du Grnrral de Gaulle, 94010 Crrteil Cedex, France.
(Received April 11, 2000; revised July 13, 2000; accepted July 20, 2000.)