Comparison of vocal loading parameters in kindergarten and
elementary school teachers
Running head: Vocal loading in teachers
Angélique Remacle1, Dominique Morsomme1, Camille Finck2 1
Department of Psychology: Cognition and Behavior, University of Liège, Belgium 2ENT Department, CHU of Liège and Faculty of Psychology, University of Mons, Belgium
Correspondence: Angélique Remacle, Université de Liège, Département de Psychologie: Cognition et Comportement, Unité Logopédie de la Voix, Rue de l'Aunaie, 30 (B38), 4000 Liège, Belgium. Tel: +32 (0)4/366 58 62. E-mail: Angelique.Remacle@ulg.ac.be
ABSTRACT
Purpose: Although a global picture exists of teachers’ voice demands in general, few studies have compared specific groups of teachers to determine whether some are more at risk than others. This study compared vocal loading of kindergarten and elementary school teachers; professional and non-professional vocal load was determined for both groups.
Method: Twelve kindergarten and twenty elementary school female teachers without voice problems were monitored during one workweek using the Ambulatory Phonation Monitor. Vocal loading parameters analyzed were F0, SPL, time dose, distance dose and cycle dose. Results: Comparisons between the groups showed significantly higher cycle dose and distance dose for kindergarten teachers than for elementary school teachers, in both professional and non-professional environments. Professional and non-professional voice use comparisons showed significant differences for all parameters, indicating that vocal load was higher in the professional environment for both groups.
Conclusions: The higher vocal doses measured in kindergarten teachers suggest that particular attention should be paid to this specific group of teachers. Although non-professional vocal load is lower than non-professional vocal load, it is important to take both into account because of their cumulative effects.
KEY WORDS: voice dosimetry – voice accumulation – ambulatory monitoring – voice assessment – vocal load – occupational voice – ambulatory phonation monitor
INTRODUCTION
Vocal load is the amount of work accomplished by the laryngeal mechanism over time (Morrow & Connor, 2011a), which is thought to be mostly determined by the duration, intensity and frequency of vocalizations. Based on a comparison between vocal fold vibrations and hand-transmitted vibrations in industry, vocal load is likely to contribute to the development of vocal fold damage because of the potentially harmful exposure of tissue to repeated vibrations (Svec, Popolo, & Titze, 2003; Titze, Svec, & Popolo, 2003). For quantifying voice use in daily life, the best adapted tools are voice dosimeters or voice accumulators. Such devices have been developed and tested over the last few decades (Airo, Olkinuora, & Sala, 2000; Batty, Howard, Garner, Turner, & White, 2002; Buekers, Bierens, Kingma, & Marres, 1995; Cheyne, Hanson, Genereux, Stevens, & Hillman, 2003; Granqvist, 2003; Masuda, Ikeda, Manako, & Komiyama, 1993; Popolo, Rogge-Miller, Svec, & Titze, 2002; Ryu, Komiyama, Kannae, & Watanabe, 1983; Szabo, Hammarberg, Håkansson, & Södersten, 2001). Current models measure the frequency (F0), the amplitude (dB SPL) and the duration of speech occurrences, generally using an accelerometer or a contact microphone attached to the base of the neck. Some devices, such as the VoxLog (Sonvox AB, Umeå, Sweden), also measure the background noise level in order to evaluate its impact on voice use. Growing attention has been focused on evaluating patterns of vocal behavior because vocal load is considered to play a major role in the etiology of many common voice disorders; long-term ambulatory monitoring allows for the characterization of these patterns and provides data on what constitutes a normal level of daily voice use (Hillman & Mehta, 2011).
Teachers have been thoroughly investigated as professional voice users, that is, individuals who work in professions in which the voice is the primary tool (Vilkman, 2000). Professional voice users have a higher incidence of and increased risk for voice disorders (Epstein, Remacle, & Morsomme, 2011). Vocal load has been studied in teachers in particular, because they have one of the most vocally demanding professions. Extended vocal loading is assumed to be one cause of the higher prevalence of voice disorders in teachers than the general population (Roy, Merrill, Thibeault, Gray, & Smith, 2004; Smith, Gray, Dove, Kirchner, & Heras, 1997; Villanueva-Reyes, 2011). An increasing number of
publications have investigated teachers’ voice use in terms of F0, SPL and phonation time (Bottalico & Astolfi, 2012; Gaskill, O'Brien, & Tinter, 2012; Hunter & Titze, 2010; Lindstrom, Waye, Sodersten, McAllister, & Ternström, 2011; Morrow & Connor, 2011a, 2011b; Sodersten, Granqvist, Hammarberg, & Szabo, 2002; Titze, Hunter, & Svec, 2007). An overall picture exists of teachers’ voice demands in general, but few studies have compared specific groups of teachers to determine whether some are more at risk than others.
To date, we have found three publications that report comparisons between specific groups of teachers (Buekers et al., 1995; Masuda et al., 1993; Morrow & Connor, 2011a). Masuda et al. (1993) developed a phonation time and SPL accumulator that picks up the vibrations of the vocal folds with a contact microphone attached to the front of the neck. The vocal behavior of 6 kindergarten and 7 elementary school teachers was measured for one to two days. In kindergarten teachers, the phonation time per 8 hours was 95 min (≈20%) and the phonation time ≥ 80 dB was 51 min (≈11%). In elementary school teachers, the phonation time per 8 hours was 104 min (≈22%) and the phonation time ≥ 80 dB was 50 min (≈10%). These results showed slightly but non-significantly longer phonation time for elementary school teachers than for kindergarten teachers. Buekers et al. (1995) designed a speaking time and SPL accumulator that records the voice with a head-mounted microphone. Vocal load profiles over one day at work were obtained for different occupations, including 6 kindergarten teachers, 8 primary school teachers, 4 college teachers, 6 high school teachers and 6 special education teachers. The results showed that vocal load was greater in teachers than in other workers. Note that speaking time and phonation time are two different measures: speaking time includes voiced and unvoiced segments of speech, while phonation time includes only moments when the vocal folds are vibrating. Finally, Morrow and Connor (2011a) compared voice-use profiles of 5 elementary classroom and 7 elementary music teachers. Participants’ voice use was measured using the Ambulatory Phonation Monitor (APM) over five working days. Results showed significantly higher values in music teachers than in classroom teachers for phonation time, F0 mode, F0 average, SPL, cycle dose and distance dose.
The present study focuses on 12 kindergarten and 20 elementary school teachers without voice problems. The purpose is to provide quantitative data on daily voice use to
determine whether kindergarten and elementary school teachers engage in different vocal loading behaviors. Vocal loading was accumulated in all teachers for one workweek (5 days) in their professional and non-professional environments. The following questions are examined:
(1) Is professional vocal load different in kindergarten and elementary school teachers? (2) Is non-professional vocal load different in kindergarten and elementary school teachers? (3) What are the differences between professional and non-professional vocal load in both groups?
These questions are answered based on a sample of Belgian French-speaking teachers. In Belgium, one year has 181 to 183 days of lessons over 37 weeks, ranging from early September to late June. One school week includes four full days (Monday, Tuesday, Thursday, Friday) and one half day (Wednesday morning). A full-time schedule of teaching and educational activities comprises 24 50-minute periods per week for kindergarten teachers and 26 50-minute periods per week for elementary school teachers, excluding meetings with pedagogical staff, before- and after-school daycare, preparation of lessons and contacts with parents. Kindergarten is for children from 2½ to 5 years old, and elementary school is for children from 6 to 12 years old. Both kindergarten and elementary school teachers’ training takes place over three years and generally does not include voice training. In the French Community of Belgium, the proportion of females is 97 % for kindergarten teachers and 80 % for elementary school teachers (Etnic, 2011). This study examines female teachers because they are twice as likely as males to report voice problems (Russell, Oates, & Greenwood, 1998) and to seek phoniatric care (Fritzell, 1996).
METHOD
Subjects
The sample included 32 teachers who had no voice problems at the time of the study. None of the subjects had a history of any vocal fold lesions or surgery on the vocal folds. One teacher had had speech therapy in the past to improve her voice use. She was included in
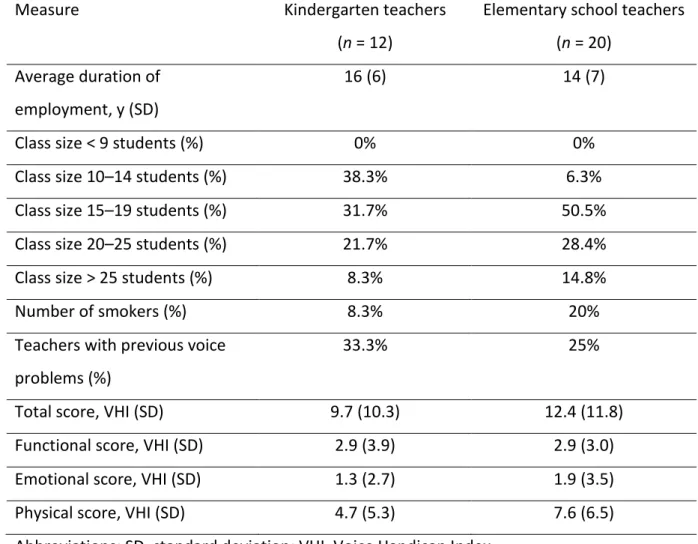
the sample because she had a normal voice at the time of the study. Thirty-three participants were recruited, but one of them dropped out during the testing. The kindergarten teacher group included 12 females aged from 32 to 49 years (M = 39; SD = 5) and the elementary school teacher group included 20 females aged from 25 to 58 years (M = 39; SD = 9). The composition of the two groups was homogeneous concerning age (Mann-Whitney U = 110.5, p = 0.72) and average duration of employment (Mann-(Mann-Whitney U = 98.5, p = 0.41). Concerning class size, teachers indicated each day if they had 0–9 students, 10–14 students, 15–19 students, 20–25 students, or more than 25 students. Background information collected with a questionnaire is presented in Table 1. Results of this questionnaire showed that 33.3% of the kindergarten teachers and 25 % of the elementary school teachers had had previous voice problems.
The participants were selected from five public schools in the Province of Liège, in the French Community of Belgium. We selected three regular education schools located in the city of Liège and two regular education schools located in rural areas. All five schools taught both kindergarten and elementary levels. The same proportion of kindergarten teachers and elementary school teachers was recruited in each school when possible, in order to control for student populations and environmental factors in the comparisons of the two groups. After obtaining approval from the local research ethics committee and authorizations from the schools’ principals, the researcher met individually with each teacher to explain the research objectives and procedures. Each participant signed a consent form and completed the questionnaire before being enrolled in the study.
In addition to the background information questionnaire, participants completed the French version of the Voice Handicap Index (VHI) (Woisard, Bodin, & Puech, 2004), initially developed by Jacobson et al. (1997). The VHI is a 30-item questionnaire to assess patients’ judgment of the relative impact of their voice disorder on their daily life. Each item is scored on an equal-appearing 5-point scale from 0 (never) to 4 (always). The items are equally distributed over three subscales: functional, physical, and emotional. Low scores indicate few complaints and high scores indicate many complaints. The maximum total score is 120 points and the maximum score per subscale is 40 points. The Mann-Whitney U test showed similar results in both groups for the total score (U = 101.5, p = 0.48), the functional score (U
= 114.5, p = 0.83), the physical score (U = 106, p = 0.60) and the emotional score (U = 86.5, p = 0.19). VHI scores for both groups are presented in Table 1.
Table 1. Description of the participants
Measure Kindergarten teachers
(n = 12)
Elementary school teachers (n = 20)
Average duration of employment, y (SD)
16 (6) 14 (7)
Class size < 9 students (%) 0% 0%
Class size 10–14 students (%) 38.3% 6.3%
Class size 15–19 students (%) 31.7% 50.5%
Class size 20–25 students (%) 21.7% 28.4%
Class size > 25 students (%) 8.3% 14.8%
Number of smokers (%) 8.3% 20%
Teachers with previous voice problems (%)
33.3% 25%
Total score, VHI (SD) 9.7 (10.3) 12.4 (11.8)
Functional score, VHI (SD) 2.9 (3.9) 2.9 (3.0)
Emotional score, VHI (SD) 1.3 (2.7) 1.9 (3.5)
Physical score, VHI (SD) 4.7 (5.3) 7.6 (6.5)
Abbreviations: SD, standard deviation; VHI, Voice Handicap Index
Voice dosimeter
We used the Ambulatory Phonation Monitor (APM), Model 3200 (KayPENTAX, Montvale, NJ), a commercially available voice dosimeter, to measure parameters of vocal load over an entire day of normal activities. This device indicates when the phonation occurs and calculates the phonation time, F0 and SPL of voice occurrences. The APM is a PC-compatible hardware and software system. The portable 45 x 95 x 158 millimeter hardware module (microprocessor) is worn in a waist pack. The transducer is an 8.4 x 5.6 x 3.8 millimeter accelerometer mounted on a silicone pad. The accelerometer is attached to the
base of the neck with medical glue (Secure Silicone Adhesive, Factor II, Lakeside, AZ) and removed at the end of the day with adhesive remover wipes (UNI-SOLVE, Smith & Nephew, Largo, FL). The accelerometer detects skin vibrations associated with phonation. Data are extracted 20 times per second throughout the day and stored in the microprocessor’s memory.
For the present study, we configured the APM software in order to average data every minute. The frequency range of the data analyzed extended from 50 to 500 Hz. The SPL range was from 30 to 130 dB SPL. These are the default ranges of the APM software. Note that the APM collects only extracted voice parameters and not actual speech samples. The advantage is the protection of subject confidentiality and the drawback is that an acoustic speech signal is not available for further analysis.
Vocal loading parameters analyzed in the present study were F0 average, F0 mode, SPL average, time dose, cycle dose and distance dose. F0 is determined by the number of vocal fold cycles per second, expressed in Hertz. F0 average is the average F0 over the duration of monitoring and F0 mode is the F0 at which the most phonation occurred over the duration of monitoring, which is automatically calculated by the APM (KayPENTAX, 2009). SPL average refers to the average sound pressure level of voice over the duration of monitoring, which is estimated from the amplitude signal and automatically calculated by the APM (KayPENTAX, 2009). The time dose (Dt) accumulates the total time the vocal folds vibrate during speech (Titze et al., 2003). In this study, the time dose is expressed as a percentage (Dt%) and corresponds to the ratio of the time dose to the monitoring period. There are no direct methods for measuring cycle dose (Dc) and distance dose (Dd), which are automatically calculated by the software from formulas given by Svec, Popolo, and Titze (2003). Dc is an approximation of the total number of glottal cycles over time, calculated from the formula:
where tm is the total duration exam, kv is the voicing detection (1 for voicing, 0 for non-voicing), and F0 the fundamental frequency.
Dd is an approximation of “how far” the vocal folds traveled during monitoring. This dose quantifies the total distance accumulated by the vocal folds in a cyclic path during vibration, following the formula:
where A is the amplitude of the vocal folds.
According to Svec, Popolo, et al. (2003), these doses measure the vocal load and can be used to study the effects of vocal fold tissue exposure to vibration during phonation.
Procedure
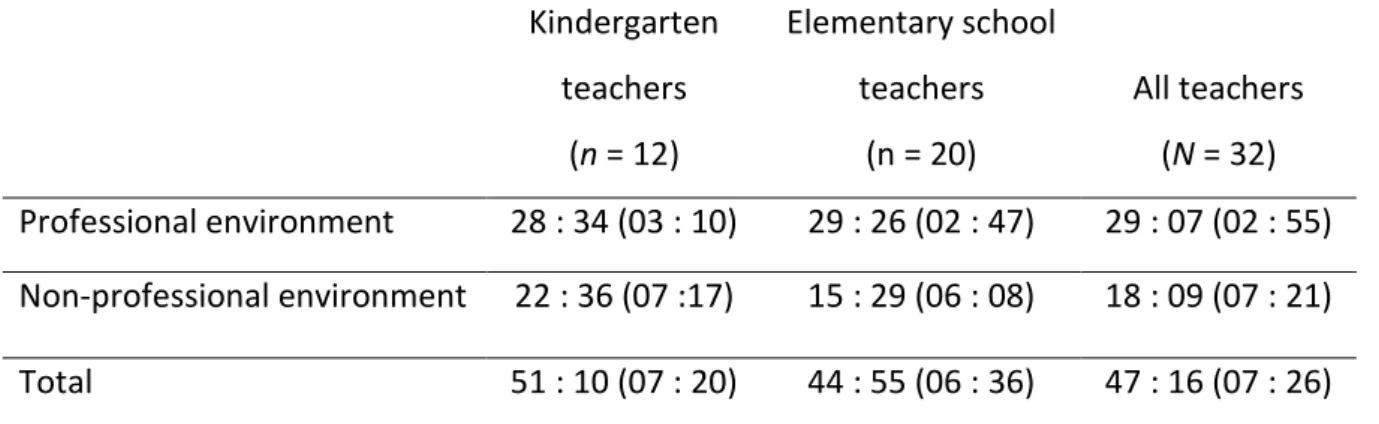
All participants were monitored for five full teaching days in a single workweek (from Monday to Friday) to determine the average vocal load over a prolonged period for the two groups of teachers. In some cases (teacher on sick leave, problem with the APM, public transit strike), the five days of recording were not consecutive and the day corresponding to the missed day was recorded the next week, in order to obtain five full days of collected data. The data analyzed in this study were collected between January 2011 and May 2012. A total of 160 days (≈1513 hours) of collected data were analyzed. Table 2 shows the average duration of monitoring per week. Following the recommendations of Nix, Svec, Laukkanen, and Titze (2007) on voice dosimetry in teachers, the same researcher, who was familiar and visible to school officials and teachers, recruited the subjects and gathered the data.
The APM was installed and calibrated according to the APM software instruction manual (KayPENTAX, 2009). First of all, the APM software was installed on the laptop used for the calibration and analysis of the collected data. At the onset of each workday, the APM was calibrated for SPL measurement in a quiet room, within each participant’s school. The following steps were completed for the calibration process: (1) the APM hardware (microprocessor) was connected to the laptop, (2) a new file was set up for each recording, (3) the accelerometer was attached to the teacher’s neck and connected to the microprocessor, (4) the SPL was calibrated while the participant produced the vowel /a/ from the softest to the loudest SPL for about 10 seconds using the calibration microphone connected to the microprocessor and kept at 15 cm from the lips with a distance guide.
Some participants failed to produce extremely soft or loud voice levels, even after several trials. In these cases, we recalibrated until the software validated the calibration. Then, (5) once the calibration was completed, the monitoring started and the microprocessor was disconnected from the laptop, and (6) the microprocessor was placed in the pack attached around the waist.
The teacher then proceeded with her normal professional and non-professional activities and was instructed to use her voice as usual. Participants were asked to wear the APM as long as possible after work in order to allow comparisons between professional and non-professional voice use. Some participants quickly removed the APM after work (e.g., to play a sport). Consequently, the weekly average duration of non-professional monitoring (18 hours per participant) was shorter than the average duration of professional monitoring (29 hours per participant).
To stop the monitoring, the participant had to unplug the accelerometer cable from the microprocessor and remove the accelerometer from her neck. The next day, the collected data were downloaded onto the laptop by the researcher, before the APM was calibrated again. This procedure was repeated each day of the week. In order to compare professional and non-professional voice use, participants were asked to maintain a diary of their activities for the entire monitoring period. Teachers also received a loan form and an instruction manual for the APM developed on the basis of Popolo et al. (2004), Nix et al. (2007) and the APM software instruction manual (KayPENTAX, 2009).
Table 2. Average duration of monitoring (hr : min) per week per participant (standard deviation in parentheses) Kindergarten teachers (n = 12) Elementary school teachers (n = 20) All teachers (N = 32) Professional environment 28 : 34 (03 : 10) 29 : 26 (02 : 47) 29 : 07 (02 : 55) Non-professional environment 22 : 36 (07 :17) 15 : 29 (06 : 08) 18 : 09 (07 : 21) Total 51 : 10 (07 : 20) 44 : 55 (06 : 36) 47 : 16 (07 : 26) Statistics
Once the data from the APM were downloaded, we manually separated the professional and non-professional voice use for each day of recording on the basis of the diary completed by the participant. Professional voice use concerned all time spent at school, including classical teaching periods and all school-related activities (e.g., meetings, before- and after-school daycare). The separated data from professional and non-professional voice use were then transferred to Microsoft Excel files. Because the duration of monitoring differed for each day, the F0 mode, F0 average, SPL average, Dc and Dd were normalized to the time dose Dt according to this formula:
Parameter normalized =
where Valueparameter is the value of the parameter considered and D1, D2, D3, D4, and D5 represent the five days of monitoring. The normalized parameters were used for the statistical analysis.
To compare professional and non-professional voice use for kindergarten and elementary school teachers, a repeated measures analysis of variance (ANOVA) was performed (2 environments X 2 groups). We tested the within-subjects effect (main effect of environment), the between-subjects effect (main effect of group), and the interaction between environment and group. The significance level was set at p < .05.
A normality test was performed to check if the assumptions in the ANOVA were met. The results showed that all the parameters followed a normal distribution, except for Dc and Dd. Before performing the ANOVA, these doses were normally distributed following a square root transformation for Dc and a logarithmic transformation for Dd. For the sake of clarity, means for the raw data values are presented in the figures. All calculations were conducted using the statistical software Statistica/Win (version 10; StatSoft Inc., Tulsa, OK).
RESULTS
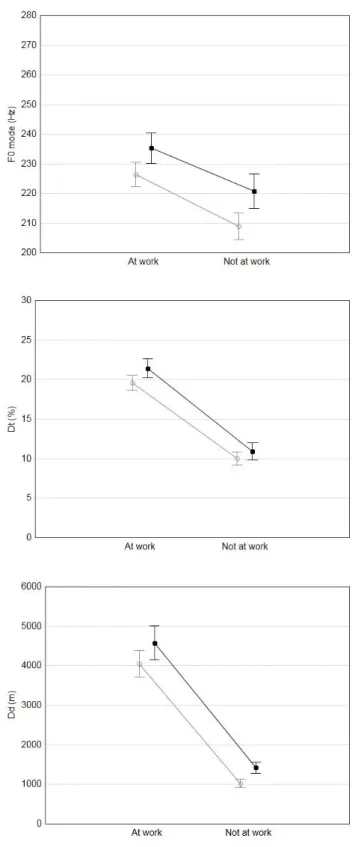
For each parameter, Figure 1 depicts the mean values and standard errors of the mean in the professional and non-professional environments for the two groups of teachers.
Concerning the fundamental frequency, the repeated measures ANOVAs showed a significant main effect of environment for F0 average, F(1, 30) = 68.05, p < .0001, partial η2 = .69, and for F0 mode, F(1, 30) = 33.99, p < .0001, partial η2 = .53. Both kindergarten and elementary school teachers spoke with a higher voice pitch in the professional environment. The results demonstrated no main effect of group for F0 average, F(1, 30) = 2.99, p = 0.09, partial η2 = .09, or F0 mode, F(1, 30) = 2.60, p = 0.12, partial η2 = .08. The interaction between environment and group was significant neither for F0 average, F(1, 30) = 2.04, p = 0.16, partial η2 = .06, nor for F0 mode, F(1, 30) = 0.30, p = 0.59, partial η2 = .01.
The repeated measures ANOVA on SPL average showed that teachers spoke significantly louder in the professional environment, F(1, 30) = 106.82, p < .0001, partial η2 = .78. The main effect of group was not significant, F(1, 30) = 0.34, p = 0.56, partial η2 = .01, nor was the interaction between environment and group, F(1, 30) = 1.73, p = 0.20, partial η2 = .05.
The repeated measures ANOVA on Dt%, F(1, 30) = 116.16, p < .0001, partial η2 = .79, demonstrated a significant main effect of environment. Both kindergarten and elementary school teachers spoke more in the professional environment. The results revealed no main effect of the group, F(1, 30) = 1.50, p = .23, partial η2 = .05, or interaction between environment and group, F(1, 30) = 0.26, p = .62, partial η2 = .008.
The repeated measures ANOVA performed on Dc revealed a main effect of environment, F(1, 30) = 304.99, p < .0001, partial η2 = .91. Dc was higher at school than in the non-professional environment. Kindergarten teachers had a significantly higher Dc than elementary school teachers, F(1, 30) = 6.21, p = 0.018, partial η2 = .17. There was no interaction between environment and group, F(1, 30) = 0.62, p = 0.44, partial η2 = .02.
Finally, the repeated measures ANOVA on Dd demonstrated a significantly higher value in the professional environment than in the non-professional environment, F(1, 30) = 254.12, p < .0001, partial η2 = .89. The significant main effect of group, F(1, 30) = 5.55, p = 0.02, partial η2 = .16, showed that Dd was higher in kindergarten teachers than in elementary school teachers. The interaction between environment and group was not significant, F(1, 30) = 1.06, p = 0.31, partial η2 = .03.
Figure 1. Means for the vocal loading related parameters in the two environments in
kindergarten teachers (in black) and elementary school teachers (in gray). Error bars represent standard errors of the mean.
DISCUSSION
Methodological aspects
This study determined voice load profiles for 12 kindergarten and 20 elementary school teachers in their professional and non-professional environments. As in the studies by Morrow and Connor (2011a, 2011b) and Gaskill et al. (2012), the APM was calibrated at the onset of each day of data collection. An average of 47 hours of data were collected over five days of monitoring, including both professional and non-professional environments (see Table 2). In previous voice dosimetry studies, the duration of monitoring ranged from 1 day (Buekers et al., 1995; Lindstrom, Ohlsson, Sjöholm, & Waye, 2010; Sala et al., 2002; Sodersten et al., 2002; Szabo et al., 2001) to 14 days (Carroll et al., 2006; Gaskill et al., 2012; Hunter & Titze, 2010; Titze et al., 2007).
Continuing dosimetry on weekends would have given a more complete view of the teachers’ non-professional voice use but this was not done for practical reasons. The APM needs to be calibrated by a researcher before each recording and participants were not willing to agree to a schedule and undergo calibration on weekends, especially as we did not offer them any financial compensation for their participation in the experiment.
The advantages of the accelerometer for long-term monitoring have been described in previous publications (Cheyne et al., 2003; Hillman, Heaton, Masaki, Zeitels, & Cheyne, 2006; Lindstrom, Ren, Li, & Waye, 2009; Popolo, Svec, & Titze, 2005; Svec, Titze, & Popolo, 2003). In the present work, we encountered some difficulties with the attachment of the accelerometer, which sometimes detached from the skin during the day. Several participants experienced skin irritation and redness due to the glue where the accelerometer was attached. One participant dropped out because of an allergic reaction to the glue. Similar observations have been made about the National Center for Voice and Speech voice dosimeter (Hunter, 2012).
Comparisons between kindergarten and elementary school teachers
The first question of this study was whether professional voice use was different in kindergarten and elementary school teachers. Figure 1 shows that all vocal loading related parameters were slightly higher for kindergarten teachers than for elementary school teachers. Statistical analyses showed that the differences between the two groups were significant for Dc and Dd.
Concerning the professional F0, the slightly higher values in kindergarten teachers (average = 268 Hz, mode = 235 Hz) versus elementary school teachers (average = 253 Hz, mode = 226 Hz) might be due to acoustic convergence behavior or accommodation. Convergence is a tendency of talkers to imitate various features of one another’s speech so that they are more similar (Ward & Litman, 2007). Kindergarten teachers may possibly use a higher F0 at work than elementary school teachers because they are surrounded by younger children speaking at a higher pitch.
Similarly to the present F0 values, two Swedish studies measured a mean F0 of 252 Hz in 9 preschool female teachers (Lindstrom et al., 2010) and of 247 Hz (median = 244 Hz) in 10 preschool female teachers (Sodersten et al., 2002) during work. In 36 Italian female primary school teachers, the mean F0 at work was 240 Hz (Bottalico & Astolfi, 2012). In the US, 5 female elementary classroom teachers had a mean F0 of 236 Hz (mode = 207 Hz) (Morrow & Connor, 2011a). A larger study showed slightly lower F0 values in 45 female American teachers (mode = 194 Hz, median = 226 Hz) (Hunter & Titze, 2010). It seems that the professional F0 values monitored in American teachers are lower than in European teachers. This may reflect cross-cultural and cross-linguistic differences, which would be interesting to investigate in future research using voice dosimetry.
In terms of professional voice SPL, kindergarten teachers spoke slightly louder (81.7 dB SPL) than elementary school teachers (79.9 dB SPL), with a larger standard deviation for elementary school teachers (5.5 dB SPL versus 3.7 dB SPL). These data are similar to other SPL data collected with the APM. Indeed, Morrow and Connor (2011a) observed a voice SPL of 77.2 dB (SD = 4) in elementary classroom teachers and 82.9 dB (SD = 5.7) in elementary
music teachers. In their study of two female elementary school teachers, Gaskill et al. (2012) measured a mean voice SPL of 80 to 82 dB in the teacher with a history of vocal complaints and of 74 dB in the teacher without a history of voice problems.
In the present study of French-speaking females, professional Dt% was 1.8 percentage points higher for kindergarten teachers (21.4%) than for elementary school teachers (19.6%). In a Japanese study (Masuda et al., 1993), the converse trend was observed: the professional Dt% was lower in 6 kindergarten female teachers (20%) than in 3 male and 4 female elementary school teachers (22%). In Sweden, 10 female preschool teachers working with children between 1 and 6 years had a professional Dt% of 16.9% (Sodersten et al., 2002). In Italy, the professional Dt% was 25.9% in 36 female primary school teachers (Bottalico & Astolfi, 2012). In the US, the professional Dt% was 108 minutes per day in 7 elementary music teachers (≈22%) and 77 minutes in 5 elementary classroom teachers (≈16%) (Morrow & Connor, 2011a). Larger studies covering different school grades and subjects taught reported a professional Dt% of 23% in 31 American teachers (26 females and 5 males), and 29.9% in 57 American teachers (45 females and 12 males), with females reaching 30.7% (Hunter & Titze, 2010; Titze et al., 2007). Across countries, languages, cultures, school grades and subjects taught, research has found a professional Dt% in teachers of between 16% and 30%. The results of the present study fall within this range.
Vocal doses, such as Dt%, Dc and Dd, are of particular interest because they illustrate the work done by the vocal folds. These doses can be used to study the effects of vocal fold tissue exposure to vibration (Svec, Popolo, et al., 2003). In the present study, Dd and Dc were significantly higher in kindergarten teachers than in elementary school teachers, suggesting that teaching young children involves more work in terms of oscillatory cycles and distance traveled by the vocal folds. Note that the results for Dd and Dc in elementary school teachers in this study are comparable to those found in American elementary school teachers during one working day (Morrow & Connor, 2011a): the present study reports a Dd of 4 km in Belgium versus 3.7 km in the US, and a Dc of 1.14 million in Belgium versus 1.06 million in the US. In another American study (Gaskill et al., 2012), the mean daily Dd ranged between 2.5 and 3.9 km in elementary school female teachers and the mean daily Dc ranged between 0.5 and 1.3 million. The present study measured high vocal doses in kindergarten teachers,
whose vocal folds traveled 4.6 km and collided with each other more than 1.2 million times per working day.
Greater vocal loading parameters found in kindergarten teachers may be related to high background noise in kindergarten classrooms or daycare centers (Sodersten et al., 2002). These environments are thought to be particularly noisy because children’s activities are essentially based on playing or doing arts and crafts, while elementary school involves more independent work related to general instruction in quiet environments. Kindergarten pupils are generally freer to move around and speak than elementary school pupils. The elevated background noise in kindergarten environments may increase the voice SPL (Lombard effect). The increased SPL also affects the F0, which is known to rise with SPL (Gramming, Sundberg, Ternström, Leanderson, & Perkins, 1988; Remacle, Finck, Roche, & Morsomme, 2012). In other words, speaking in a noisy place could result in higher voice SPL and F0, and consequently in higher Dc and Dd. However, the background noise level was not measured in the present study. Future research using devices such as the VoxLog (Sonvox AB, Umeå, Sweden) may help to determine if different background noise levels are the reason for different vocal loading profiles in kindergarten and elementary school teachers.
The second question of this study was whether non-professional vocal loading differed in kindergarten and in elementary school teachers. According to Hunter and Titze (2010), non-professional voice use is important because of its cumulative effects with professional vocal load. These authors point out that non-professional voice use “would not only leave little time for significant vocal rest but also would add more vocal load to an already vocally overloaded voice.” When observing non-professional voice use, the present study showed significantly higher Dc and Dd in kindergarten teachers than in elementary school teachers. These doses were already higher for kindergarten teachers in the professional environment, suggesting that more work is done by the vocal folds throughout the day. One explanation for the greater non-professional vocal load in terms of Dc and Dd for the kindergarten group would be continuity over time. This phenomenon of continuity throughout the day had already been demonstrated for F0 (accounting for the calculations of Dc and Dd ) and SPL (accounting for the calculations of Dd). Using acoustic analysis before and after a vocally loaded working day, Laukkanen, Ilomaki, Leppanen, and Vilkman (2008)
showed that female teachers spoke higher and louder after work. Given that kindergarten teachers already used higher Dc and Dd at work than elementary school teachers, it seems logical that they would maintain higher values after work. Monitoring on weekends would allow one to discover whether the kindergarten teachers’ higher vocal doses are also observed on non-working days or if they are exclusively related to professional voice use.
The kindergarten teachers observed in the present study not only had higher vocal doses, which means greater tissue exposure to vibration during phonation, but they also had a higher rate of previous voice problems (33%) than the elementary school teachers (25%). Similarly, Rantala and Vilkman (1999) reported that teachers with many voice complaints had higher values of the vocal loading index (equivalent to Dc) than teachers with few vocal complaints. According to Svec, Popolo, et al. (2003), a factor that can contribute to the correlation of the larger number of cycles with the larger number of vocal complaints is the potentially harmful effect of vocal fold collisions. In a Finnish study comparing daycare center teachers and nurses, vocal loading measurements showed that daycare center teachers used their voices more and at higher levels than nurses (Sala et al., 2002). The prevalence of voice disorders in these two occupations showed that 50% of the teachers had at least two vocal symptoms weekly and an abnormal voice quality, versus 27% of the nurses; indirect laryngoscopy revealed organic findings in 29% of the teachers and 7% of the nurses (Sala, Laine, Simberg, Pentti, & Suonpaa, 2001). These results suggest that occupations with higher vocal loading could result in more voice problems.
Several studies support the hypothesis that teachers working with young children are particularly at risk for voice disorders. Preciado, Garcia Tapia, and Infante (1998) found a higher rate of voice disorders in kindergarten teachers (36%) than in elementary school teachers (25%). Fritzell (1996) analyzed the population of voice patients seen in Swedish hospitals. The proportion of preschool teachers in the voice clinics (3.1%) was higher than their proportion in the general population (1.4%); similar data were not provided for elementary school teachers. These studies suggest that kindergarten teachers are particularly at risk for developing occupational voice disorders. Higher vocal doses in this group of teachers, as measured in the present study, could possibly be related to their higher rate of voice disorders. More research is needed to confirm this hypothesis, including
vocal load measures, prevalence of voice problems and propensity to seek phoniatric care for each group of teachers.
Comparisons between professional and non-professional voice use
The third aim of this study was to determine the differences between professional and non-professional voice use in both groups. The results demonstrated significantly greater values for all parameters in the professional environment than in the non-professional environment (see Figure 1). These findings corroborate the results of two American studies that monitored teachers over two weeks (Hunter & Titze, 2010; Titze et al., 2007). In the study by Titze et al. (2007), the distributions of voicing and silent periods were observed in professional and non-professional environments. As in the present study, data were accurately subdivided into at-work and not-at-work voicing based on a daily diary of all the teacher’s activities. In the study by Hunter and Titze (2010), F0, SPL, and time dose were calculated per hour and compared in both environments. Weekday data were subdivided into two portions of 6 hours each, representing the most likely periods during which most of the teachers were at work (9:00 a.m. to 3:00 p.m.) and not at work (4:00 p.m. to 10:00 pm and weekends).
In the present study, significantly higher F0 and SPL values were found in the professional environment than in the non-professional environment. In a field study, Sodersten et al. (2002) recorded voice use over a working day in 10 female preschool teachers at daycare centers and analyzed the background noise, SPL, F0 and phonation time. Mean background noise levels were high (76.1 dBA); therefore, the teachers spoke significantly louder and higher when teaching as compared with a baseline involving a standard reading passage before work. A laboratory study analyzing voice production during realistic environmental noise exposure showed that having to make oneself heard over noise, as in teachers’ professional environments, results in higher voice F0 and SPL (Sodersten, Ternstrom, & Bohman, 2005). These studies support the hypothesis that the higher F0 and SPL found in the professional environments could be due to the loud background noise at school.
In accordance with Hunter and Titze’s findings (2010), F0 average and F0 mode were about 1 semitone higher in the professional environment for both kindergarten and elementary school teachers. SPL was 7 dB louder in the professional environment for kindergarten teachers and 5.5 dB louder for elementary school teachers. These SPL differences in the two environments are much more marked than in the study by Hunter and Titze (2010), who found 1 dB of difference between environments. These divergences could be explained by the different techniques used for the subdivision of professional and non-professional voice use, which was based on an accurate subdivision using a diary in this study, whereas it was based on predetermined segments of 6 hours in the study by Hunter and Titze.
Significant differences were also found between teaching and non-teaching vocal doses. In accordance with the American studies (Hunter & Titze, 2010; Titze et al., 2007), the Dt% found in French-speaking teachers was twice as high in the professional environment as in the non-professional environment (21.4% versus 10.9% for kindergarten teachers and 19.6% versus 10% for elementary school teachers). Hunter and Titze (2010) found that Dt% was 30.7% at work versus 14.7% not at work in females and 27.4% at work versus 13.7% not at work in males. Titze et al. (2007) found a similar ratio of professional and non-professional Dt% : 23% at work, 13% after work and 12% on weekends.
The data for the teachers in this study showed that, on average, the vocal folds vibrated more than 1 million times a day at work, plus an additional half million times after work. The distance traveled by the vocal folds for these teachers was, on average, 4 km at work, plus an additional 1 km after work. Although non-professional voice use in teachers is lower than the professional voice use, it is important to take it into account when evaluating vocal load because of its additional effect. Concerning the clinical implications, these data encourage the reduction of vocal load in teachers who present symptoms of an overloaded voice, not only at work but also in non-professional environments.
The vocal demands posed by after-work activities may depend on the teacher’s family situation, number of children, and social and leisure activities, which would be interesting to investigate in future research. As testing continues, larger groups of teachers
will be compared. It would be interesting to determine vocal loading in other groups of teachers, such as high school teachers, college teachers, and special education teachers. Future research should also measure vocal loading according to gender, age, experience, subject taught, specific school activities, acoustics and ergonomic data in order to identify the most hazardous teaching conditions for the development of voice disorders.
CONCLUSION
This study confirmed that kindergarten and elementary school teachers have very vocally demanding professions. Comparisons between the two groups indicated that the cycle dose and the distance dose were greater in kindergarten teachers than in elementary school teachers in both professional and non-professional environments. This suggests that teaching young children imposes a greater vocal load in terms of oscillatory cycles and distance traveled by the vocal folds, possibly related to the high background noise levels found in previous studies. Because of their higher vocal load, kindergarten teachers could be more at risk for developing occupational voice disorders than elementary school teachers. Particular attention should be paid to this specific group of teachers who work with young children.
As in previous studies, comparisons between professional and non-professional environments showed significantly greater values for all parameters in the professional environment, meaning that voice demands are higher at work than elsewhere in both groups of teachers.
Acknowledgments
The authors gratefully thank the teachers who took part in the experiment, Marie Simon for the help with data collection, and Dr. Robert E. Hillman and KayPENTAX (Montvale, NJ) for the loan of an APM unit. We thank Professor Philippe Lefèbvre and the ENT department of the CHU of Liège for funding an APM unit.
REFERENCES
Airo, E., Olkinuora, P., & Sala, E. (2000). A method to measure speaking time and speech sound pressure level. Folia Phoniatrica et Logopedica, 52(6), 275-288.
Batty, S. V., Howard, D. M., Garner, P. E., Turner, P., & White, A. D. (2002). Clinical pilot study assessment of a portable real-time voice analyser. Logopedics, Phoniatrics, Vocology, 27(2), 59-62.
Bottalico, P., & Astolfi, A. (2012). Investigations into vocal doses and parameters pertaining to primary school teachers in classrooms. Journal of the Acoustical Society of America, 131(4), 2817-2827.
Buekers, R., Bierens, E., Kingma, H., & Marres, E. H. (1995). Vocal load as measured by the voice accumulator. Folia Phoniatrica et Logopedica, 47(5), 252-261.
Carroll, T., Nix, J., Hunter, E. J., Emerich, K., Titze, I. R., & Abaza, M. (2006). Objective measurement of vocal fatigue in classical singers: A vocal dosimetry pilot study. Otolaryngology - Head and Neck Surgery, 135(4), 595-602.
Cheyne, H. A., Hanson, H. M., Genereux, R. P., Stevens, K. N., & Hillman, R. E. (2003). Development and testing of a portable vocal accumulator. Journal of Speech, Language, and Hearing Research, 46(6), 1457-1467.
Epstein, R., Remacle, A., & Morsomme, D. (2011). From reactive intervention to proactive prevention: The evolution of occupational dysphonia. Perspectives on Voice and Voice Disorders, 21(2), 48-55. doi: 10.1044/vvd21.2.48
Etnic. (2011). Les indicateurs de l'enseignement 2011. Retrieved from http://www.enseignement.be/index.php?page=26464
Fritzell, B. (1996). Voice disorders and occupations. Logopedics, Phoniatrics, Vocology, 21, 7-21. Gaskill, C. S., O'Brien, S. G., & Tinter, S. R. (2012). The effect of voice amplification on occupational
vocal dose in elementary school teachers. Journal of Voice, 26(5), 667.e619-667.e627. doi: 10.1016/j.jvoice.2011.10.010
Gramming, P., Sundberg, J., Ternström, S., Leanderson, R., & Perkins, W. (1988). Relationship between changes in voice pitch and loudness. Journal of Voice, 2(2), 118-126.
Granqvist, S. (2003). The self-to-other ratio applied as a phonation detector for voice accumulation. Logopedics, Phoniatrics, Vocology, 28(2), 71-80.
Hillman, R. E., Heaton, J. T., Masaki, A., Zeitels, S. M., & Cheyne, H. A. (2006). Ambulatory monitoring of disordered voices. Annals of Otology, Rhinology, and Laryngology, 115(11), 795-801. Hillman, R. E., & Mehta, D. D. (2011). Ambulatory monitoring of daily voice use. Perspectives on Voice
and Voice Disorders, 21(2), 56-61.
Hunter, E. J. (2012). Teacher response to ambulatory monitoring of voice. Logopedics, Phoniatrics, Vocology, 37(3), 133-135.
Hunter, E. J., & Titze, I. R. (2010). Variations in intensity, fundamental frequency, and voicing for teachers in occupational versus nonoccupational settings. Journal of Speech, Language, and Hearing Research, 53(4), 862-875.
Jacobson, B. H., Johnson, A., Grywalski, C., Silbergleit, A., Jacobson, G., Benninger, M. S., & Newman, C. W. (1997). The voice handicap index (VHI): Development and validation. American Journal of Speech-Language Pathology, 6, 66-70.
KayPENTAX. (2009). Ambulatory Phonation Monitor, Model 3200 (Version 1.5). Montvale, NJ. Laukkanen, A.-M., Ilomaki, I., Leppanen, K., & Vilkman, E. (2008). Acoustic measures and self-reports
of vocal fatigue by female teachers. Journal of Voice, 22(3), 283-289.
Lindstrom, F., Ohlsson, A.-C., Sjöholm, J., & Waye, K. P. (2010). Mean F0 values obtained through standard phrase pronunciation compared with values obtained from the normal work environment: A study on teacher and child voices performed in a preschool environment. Journal of Voice, 24(3), 319-323.
Lindstrom, F., Ren, K., Li, H., & Waye, K. P. (2009). Comparison of two methods of voice activity detection in field studies. Journal of Speech, Language, and Hearing Research, 52(6), 1658-1663.
Lindstrom, F., Waye, K. P., Sodersten, M., McAllister, A., & Ternström, S. (2011). Observations of the relationship between noise exposure and preschool teacher voice usage in day care center environments. Journal of Voice, 25(2), 166-172.
Masuda, T., Ikeda, Y., Manako, H., & Komiyama, S. (1993). Analysis of vocal abuse: Fluctuations in phonation time and intensity in 4 groups of speakers. Acta Oto-Laryngologica, 113(4), 547-552.
Morrow, S. L., & Connor, N. P. (2011a). Comparison of voice-use profiles between elementary classroom and music teachers. Journal of Voice, 25(3), 367-372.
Morrow, S. L., & Connor, N. P. (2011b). Voice amplification as a means of reducing vocal load for elementary music teachers. Journal of Voice, 25(4), 441-446.
Nix, J., Svec, J. G., Laukkanen, A.-M., & Titze, I. R. (2007). Protocol challenges for on-the-job voice dosimetry of teachers in the United States and Finland. Journal of Voice, 21(4), 385-396. Popolo, P. S., Rogge-Miller, K., Svec, J. G., & Titze, I. R. (2002). Technical considerations in the design
of a wearable voice dosimeter. The National Center for Voice and Speech Online technical Memo, 5. Retrieved from www.ncvs.org
Popolo, P. S., Svec, J. G., Hunter, E. J., Starr, A. C., Rogge-Miller, K., Nix, J., & Titze, I. R. (2004). Teachers' guide to voice dosimetry. The National Center for Voice and Speech Online technical Memo, 4. Retrieved from www.ncvs.org
Popolo, P. S., Svec, J. G., & Titze, I. R. (2005). Adaptation of a pocket PC for use as a wearable voice dosimeter. Journal of Speech, Language, and Hearing Research, 48(4), 780-791.
Preciado, J. A., Garcia Tapia, R., & Infante, J. C. (1998). Prevalence of voice disorders among
educational professionals: Factors contributing to their appearance or their persistence. Acta Otorrinolaringologica Espanola, 49(2), 137-142.
Rantala, L., & Vilkman, E. (1999). Relationship between subjective voice complaints and acoustic parameters in female teachers' voices. Journal of Voice, 13(4), 484-495.
Remacle, A., Finck, C., Roche, A., & Morsomme, D. (2012). Vocal impact of a prolonged reading task at two intensity levels: Objective measurements and subjective self-ratings. Journal of Voice, 26(4), 177-186. doi: 10.1016/j.jvoice.2011.07.016
Roy, N., Merrill, R. M., Thibeault, S., Gray, S. D., & Smith, E. M. (2004). Voice disorders in teachers and the general population: Effects on work performance, attendance, and future career choices. Journal of Speech, Language, and Hearing Research, 47(3), 542-551.
Russell, A., Oates, J., & Greenwood, K. M. (1998). Prevalence of voice problems in teachers. Journal of Voice, 12(4), 467-479.
Ryu, S., Komiyama, S., Kannae, S., & Watanabe, H. (1983). A newly devised speech accumulator. Journal for Oto-Rhino-Laryngology and Its Related Specialties, 45(2), 108-114.
Sala, E., Airo, E., Olkinuora, P., Simberg, S., Strom, U., Laine, A., . . . Suonpaa, J. (2002). Vocal loading among day care center teachers. Logopedics, Phoniatrics, Vocology, 27(1), 21-28.
Sala, E., Laine, A., Simberg, S., Pentti, J., & Suonpaa, J. (2001). The prevalence of voice disorders among day care center teachers compared with nurses: A questionnaire and clinical study. Journal of Voice, 15(3), 413-423.
Smith, E., Gray, S. D., Dove, H., Kirchner, L., & Heras, H. (1997). Frequency and effects of teachers' voice problems. Journal of Voice, 11(1), 81-87.
Sodersten, M., Granqvist, S., Hammarberg, B., & Szabo, A. (2002). Vocal behavior and vocal loading factors for preschool teachers at work studied with binaural DAT recordings. Journal of Voice, 16(3), 356-371.
Sodersten, M., Ternstrom, S., & Bohman, M. (2005). Loud speech in realistic environmental noise: Phonetogram data, perceptual voice quality, subjective ratings, and gender differences in healthy speakers. Journal of Voice, 19(1), 29-46.
Svec, J. G., Popolo, P. S., & Titze, I. R. (2003). Measurement of vocal doses in speech: Experimental procedure and signal processing. Logopedics, Phoniatrics, Vocology, 28(4), 181-192. Svec, J. G., Titze, I. R., & Popolo, P. S. (2003). Vocal dosimetry: Theoretical and practical issues. In G.
Schade, F. Müller, T. Wittenberg & M. Hess (Eds.), Proceeding Papers for the Conference Advances in Quantitative Laryngology, Voice and Speech Research (pp. 1-8). Stuttgart, Germany: IRB Verlag.
Szabo, A., Hammarberg, B., Håkansson, A., & Södersten, M. (2001). A voice accumulator device: Evaluation based on studio and field recordings. Logopedics, Phoniatrics, Vocology, 26(3), 102-117.
Titze, I. R., Hunter, E. J., & Svec, J. G. (2007). Voicing and silence periods in daily and weekly vocalizations of teachers. Journal of the Acoustical Society of America, 121(1), 469-478. Titze, I. R., Svec, J. G., & Popolo, P. S. (2003). Vocal dose measures: Quantifying accumulated
vibration exposure in vocal fold tissues. Journal of Speech, Language, and Hearing Research, 46(4), 919-932.
Vilkman, E. (2000). Voice problems at work: A challenge for occupational safety and health arrangement. Folia Phoniatrica et Logopedica, 52, 120-125.
Villanueva-Reyes, A. (2011). Voice disorders in the metropolitan area of San Juan, Puerto Rico: Profiles of occupational groups. Journal of Voice, 25(1), 83-87.
Ward, A., & Litman, D. (2007). Automatically measuring lexical and acoustic/prosodic convergence in tutorial dialog corpora. Speech and Language Technology in Education, October 1-3.
Retrieved from http://www.isca-speech.org/archive
Woisard, V., Bodin, S., & Puech, M. (2004). The voice handicap index: Impact of the translation in French on the validation. Revue de Laryngologie Otologie Rhinologie, 125(5), 307-312.