»
108 | | September/October 2019
SPECTROSCOPY
»
Charlotte De Bleye,
aJohan Cailletaud,
aE. Dumont,
aPierre-Yves Sacré,
aYoann Gut,
bYves-Michel Ginot,
bPhilippe Hubert,
aand
Eric Ziemons
aaUniversity of Liege (ULiege), CIRM, VibraSanté Hub, Laboratory of Pharmaceutical Analytical
Chemistry, Avenue Hippocrate 15, 4000 Liège, Belgium.
bTechnologie Servier, 27 rue Eugène Vignat, 45000 Orléans, France
Application of
Surface-Enhanced Raman
Chemical Imaging
(SER-CI) to Quantification
in Pharmaceutical Tablets
Abstract
Since its discovery, the application of Surface-Enhanced Raman Spectroscopy (SERS) has extended to various areas, including the pharmaceutical field, facing up challenges in the SERS substrate and sample preparation. This paper will present how beneficially SERS can be applied to the quantification of low-dose compounds in pharmaceutical tablets, focusing on the determination of 4-aminophenol, a toxic impurity, in acetaminophen tablets.
Introduction
Vibrational spectroscopy has become popular in the pharmaceutical sector, due to the high speed of its measurements and to its green and non-destructive nature. Among vibrational techniques, SERS has recently emerged as a potential way of circumventing some of the drawbacks of conventional Raman spectroscopy. Indeed, metallic nanostructures, called SERS substrates, are used in SERS and increase the Raman signal of molecules located nearby their surface. Consequently, the detection and quantification of trace amounts of compounds, such as low-dose Active Pharmaceutical Ingredients (APIs) or impurities, become practical with SERS. SERS can also reduce the extent of fluorescence, which would otherwise mask the conventional Raman spectrum if present in a sample. With these advantages in mind, it is easy to understand the interest shown in SERS related to the pharmaceutical industry.1,2
Just like in Raman microspectroscopy, SERS can be combined with confocal microscopy in order to simultaneously obtain spectral and spatial information about the sample. This leads to Surface-Enhanced Raman Chemical Imaging (SER-CI).2 SER-CI can be extremely helpful
to visualize the spatial distribution of APIs, even at low dosages, or impurities inside medicines, while significantly reducing the image acquisition time in comparison with conventional Raman imaging. Therefore, SER-CI can be considered as a quality control tool, allowing to assess the conformity of medicines.
In this article, an application of SER-CI to determine 4-aminophenol (4-AP) in pharmaceutical tablets of acetaminophen, one of the most sold drugs worldwide, will be developed. 4-AP is the main impurity of acetaminophen and originates from the synthesis or from the degradation of the latter. Due to its nephrotoxicity and hepatotoxicity, 4-AP must systematically be sought and a 0.15% (w/w) specification limit is therefore fixed for acetaminophen tablets in the
United-States Pharmacopeia (USP).3 The sensitivity of conventional Raman
spectroscopy, which is around 1 or 2% (w/w) depending on the target analyte, is not suffi cient to detect these concentrations. Consequently, the use of SERS is mandatory. Several developments in the sample preparation will also be presented in the article, aiming at making homogeneous deposits of the SERS substrate onto the tablet surface, which is a critical step, for increasing analysis repeatability.
Material and Methods
SERS spectra were acquired on a RamanStation 400F spectrometer equipped with a two-dimensional CCD (1024 x 256 pixels sensor) cooled down to -50°C and with a 785 nm laser with power set at 100 mW. A 1 s accumulation time was used.
Suspensions of citrate-coated silver nanoparticles (AgNPs) were synthesized according to the Lee & Meisel protocol4 and were
concentrated by a factor 10 by centrifugation.
The spectral data were then pre-treated and analyzed with MATLAB R2015a and the PLS toolbox 8.5.1.
Results and Discussion
While SER-CI can be an eff ective tool for imaging trace amounts of compounds, the diffi culty of obtaining a homogeneous sample coating with the SERS substrate is still a major issue. The most straightforward tablet coating technique is drop casting deposition (Figure 1a). It consists of dropping a few microliters of the colloidal SERS substrate directly onto the tablet surface. The colloid consequently spreads over the surface of the tablet before being absorbed by the latter. The distribution of the SERS substrate onto the sample surface was studied by means of concentrated AgNPs functionalized with butanethiol (BT).5 The suspension of AgNPs had to be concentrated in
order to provide a suffi cient amount of AgNPs on the sample surface and therefore to produce an intense SERS signal after the deposit. The intensity of a characteristic peak of BT was tracked. It showed high intensity variation along the tablet surface (RSD 29.3%), with increased SERS signal at the edges of the tablet coating (Figure 1d). This was explained by the coff ee-ring eff ect, a phenomenon resulting from the diff erential evaporation rate of the solvent at the center and at the edge of the drop, leading to a highly concentrated ring of the colloid at the edge of the dried deposit. Moreover, the area covered by the SERS substrate is poor, restricting the use of this dropping method to small samples.5,6
In order to decrease this coff ee-ring eff ect and therefore to increase the homogeneity of the coating, another dropping method was studied, absorption coating (Figure 1b). In this approach, some microliters of the SERS substrate are dropped on a glass slide and the tablet is put in contact with the drop for several seconds, allowing the substrate to absorb into the tablet by capillarity. While presenting lower signal intensity variations across the sample surface (RSD 17.7%), a coff ee-ring trend could still be observed (Figure 1e).5,6 However, this coating method
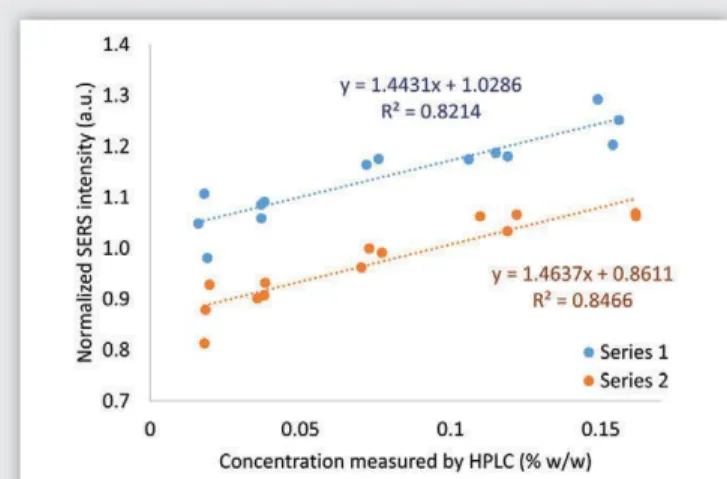
was successfully applied to the quantifi cation of 4-AP in acetaminophen tablets from 0.025 to 0.2% (w/w). In order to minimize the problem of lack of homogeneity in the coating, the median response of 4-AP from each tablet was normalized by the signal of BT. Two series of tablets were analyzed with two batches of AgNPs. The resulting calibration curves are displayed in Figure 2 and demonstrated a good correlation (R2 0.82 and 0.85) between median normalized SERS intensities and the
exact concentration of the tablets determined by high performance liquid chromatography (HPLC). It was also noticed that the AgNPs batch parameter was important to take into account since the obtained SERS intensities were diff erent for the two batches used. Consequently, the calibration of each new batch of AgNPs should be performed before its use for quantitative analyses.5
Figure 1. Description of the drop casting (a), the absorption coating (b) and the spray-coating (c) approaches. Related spatial
distribution of the SERS substrate highlighted with the use of the K-Means algorithm (the number of clusters was fi xed at 3) on tablets coated by drop casting (d), absorption coating (e) and
spray-coating (f). The green, red and blue colors on the tablet represent areas without AgNPs deposit, with a low and high
abundance of AgNPs, respectively.
Figure 2. Median 4-AP intensity normalized by BT peak intensity in function of 4-AP concentration (determined by HPLC).
»
110 | | September/October 2019
Finally, a new covering methodology called spray-coating was developed (Figure 1c). This method could prevent the concentration of the colloids at the edge of the sample and can be easily implemented. Moreover, even larger samples can be homogeneously coated. To do so, a home-made device, comprising an electrospray ionization probe with a couple of coaxial tubes, was used to spray a suspension of AgNPs onto tablets. The inner tube was linked to a syringe pump for delivery of AgNPs at a constant and controlled speed. The outer tube was connected to nitrogen gas supply. This gas nebulized the AgNPs suspension into little droplets that were driven onto the sample surface.6
Important parameters determining the coating homogeneity and the resulting SERS signal intensity comprise the concentration of the colloid, its fl ow rate and the spraying time. These parameters were optimized through a design of experiments approach and the optimums (10x concentration, 10 µL/min, 5 min) gave very low SERS signal variations across the sample surface (RSD around 10%), demonstrating the absence of any coff ee-ring eff ect with this coating approach (Figure 1f ).6
The optimized spray-coating method was then applied to the detection of the 4-AP impurity in acetaminophen tablets by SER-CI (Figure 3). The determination of 4-AP was possible from 0.2% down to 0.025% (w/w), which is signifi cantly lower than the specifi cation limit of 0.15% (w/w) set by the USP.3
Since many tablets are made up of water-soluble compounds (such as lactose or mannitol), they could dissolve or become distorted when aqueous SERS substrates are applied onto their surface. This point was taken into account and the migration of soluble compounds was studied by SER-CI after the coating of tablets. The surface of the tablets coated by drop casting and absorption coating displayed cracks and holes whereas it remained intact for tablets coated by spray-coating. As a result, only spray-coating prevented the migration of water-soluble compounds in the tablets.
From these results, the spray-coating approach seems to be a very promising tool to provide homogeneous deposits of SERS substrates resulting in more repeatable SER-CI analyses. One step further, the
automation of the spray-coating could be considered. This would contribute to improving the level of repeatability of SER-CI.
Conclusion
To conclude, next to its low sensitivity, SER-CI also benefi ts from decreased analysis time (by a factor ~6) in comparison with conventional Raman imaging. Indeed, a reduced acquisition time can be set in SER-CI due to the signal exaltation obtained by SERS. Besides, the SERS spectra fi ngerprints remain of the sample composition. As a result, the spatial resolution of the mappings can be increased while retaining sensible total acquisition time, helping low-dose compounds identifi cation along. In contrast, the visualization of these trace compounds by conventional Raman imaging can be missed due to the absence of pure pixels related to these traces or to low Raman intensity of the latter. In this context, SER-CI combined with eff ective substrate coating methods is establishing itself as a high-quality tool for the quality control of trace amounts, either API or impurities, in the pharmaceutical sector. SER-CI can indeed be quickly implemented to verify the distribution homogeneity of low-dose API or the distribution of any impurities inside the tablets.
However, challenges persist in SER-CI. The repeatability of analysis could still be improved while the SERS technique remains rather limited in terms of analytes that can be studied. That is why research is currently being conducting on the development of more homogeneous SERS substrates and on automated systems which would eliminate the infl uence of the operator on the results, hence extending repeatability. Furthermore, the functionalization of the SERS substrates could also be considered in order to extend the range of analytes SER-CI could be applied to.
References
1. Dumont E, De Bleye C, Sacré PY, Netchacovitch L, Hubert Ph, Ziemons E. From near-infrared and Raman to surface-enhanced Raman spectroscopy: progress, limitations and perspectives in bioanalysis. Bioanalysis 2016;8:1077-1103.
2. Cailletaud J, De Bleye C, Dumont E et al. Critical review of surface-enhanced Raman spectroscopy applications in the pharmaceutical fi eld. J Pharm Biomed Anal 2018; 147:458-472.
3. Acetaminophen tablets. In: United States Pharmacopeia and National Formulary (USP42 - NF37). Rockville, MD: United States Pharmacopeial Convention; 2016. https://online. uspnf.com/uspnf/document/GUID32170AD6FA984DC890E982EC5E59945_4_en-US?highlight=acetaminophen. Updated November 1, 2018. Accessed July 18, 2019. 4. Lee PC, Meisel D. Adsorption and surface-enhanced Raman of dyes on silver and gold sols.
J Phys Chem 1982;86:3391-3395.
5. De Bleye C, Sacré PY, Dumont E et al. Development of a quantitative approach using surface-enhanced Raman chemical imaging: First step for the determination of an impurity in a pharmaceutical model. J Pharm Biomed Anal 2014;90:111-118. 6. Cailletaud J, De Bleye C, Dumont E et al. Towards a spray-coating method for the detection
of low-dose compounds in pharmaceutical tablets using surface-enhanced Raman chemical imaging (SER-CI). Talanta 2018; 188:584-592.
Figure 3. 4-AP distribution maps in acetaminophen tablets from 0.025% to 0.2% (w/w) by SER-CI.