HAL Id: hal-02899777
https://hal.sorbonne-universite.fr/hal-02899777
Submitted on 15 Jul 2020HAL is a multi-disciplinary open access
archive for the deposit and dissemination of sci-entific research documents, whether they are pub-lished or not. The documents may come from teaching and research institutions in France or
L’archive ouverte pluridisciplinaire HAL, est destinée au dépôt et à la diffusion de documents scientifiques de niveau recherche, publiés ou non, émanant des établissements d’enseignement et de recherche français ou étrangers, des laboratoires
Refining anodic and cathodic dissolution mechanisms:
combined AESEC-EIS applied to Al-Zn pure phase in
alkaline solution
Junsoo Han, Vincent Vivier, Kevin Ogle
To cite this version:
Junsoo Han, Vincent Vivier, Kevin Ogle. Refining anodic and cathodic dissolution mechanisms: combined AESEC-EIS applied to Al-Zn pure phase in alkaline solution. npj Materials Degradation, Nature Research 2020, 4, pp.1-9. �10.1038/s41529-020-0123-0�. �hal-02899777�
Refining anodic and cathodic dissolution mechanisms: 1
Combined AESEC-EIS applied to Al-Zn pure phase in alkaline solution 2
3
Junsoo Hana, c, *, Vincent Vivierb and Kevin Oglea 4
5 a
Chimie ParisTech, PSL Research University, CNRS, Institut de Recherche Chimie Paris (IRCP), 6
F-75005 Paris, France 7 b
Sorbonne Université, CNRS, Laboratoire Interfaces et Systèmes Electrochimiques, LISE, F-8
75005, Paris, France 9 c
Present address: Department of Materials Science and Engineering, University of Virginia, 10
Charlottesville, VA 22904, United States 11 *
: corresponding author 12
Abstract 13
In this work, the use of atomic emission spectroelectrochemistry (AESEC) coupled to 14
electrochemical impedance spectroscopy (EIS) is presented as a method of revealing dissolution 15
mechanisms. To illustrate the method, the dissolution kinetics of Al cations from an Al-Zn pure 16
phase (Zn-68 wt.% Al) was investigated in an alkaline solution. In the cathodic potential domain, 17
a nearly direct formation of dissolved Al3+ was observed, while in the anodic potential domain 18
the Al dissolution occurred by migration across a ZnO/Zn(OH)2 film. The localization of the
19
charge transfer mechanism depending on applied potential could be distinguished by comparing
20
the DC and AC faradaic yield using AESEC-EIS.
21
Introduction 23
Since its introduction to the corrosion field by Epelboin et al. [1 ], electrochemical
24
impedance spectroscopy (EIS) has proven itself an essential and ubiquitous technique in
25
corrosion research. For steady state corroding systems, the EIS spectrum may in some cases be
26
used to estimate the corrosion rate of the material without significant electrochemical
27
perturbation of the system [1], and the EIS spectrum itself is often considered as a fingerprint for
28
specific mechanisms revealing different kinetic processes over a wide range of time constants [2].
29
The difficulty of EIS alone is the inability to identify the specific faradaic reactions that occur
30
during charge transfer. This has given rise to the development of a variety of couplings such as
31
EIS – Raman spectroscopy [3]. The modulated Raman emission signal allows one to “tune in” to
32
surface chemical bonds that form and dissipate in resonance with the modulated electrochemical
33
potential. The theoretical development of such techniques has been addressed in the development
34
of a generalized EIS transfer function [4].
35
Atomic emission spectroelectrochemistry (AESEC) provides a direct measurement of
36
elemental dissolution rates [5]. One of the difficulties of this technique is that dissolution may be
37
directly related to a faradaic process, weakly related as in the case of anodic dissolution by way
38
of an oxide intermediate, or unrelated as when dissolution is due to a non-faradaic process. The
39
correlation of electrochemical current transients with dissolution transients is one means of
40
distinguishing between these possibilities as demonstrated by Jiang et al. [6, 7] for the dissolution
41
of Zn in the presence of conversion coatings. The coupling of EIS and AESEC allows for a more
42
sophisticated analysis of dissolution kinetics: the oscillating elemental dissolution rates may be
43
related to the oscillating current and the EIS data may be decomposed into elemental components
by element basis with the advantage that dynamic systems may be treated directly, by analyzing
46
data in the time domain. A detailed model for AESEC-EIS was developed by Shkirskiy and Ogle
47
[8], directly correlating the elemental dissolution rate and electrical current for pure Zn at open
48
circuit potential. Zn dissolution in 0.1 M NH4Cl occurred without any significant intermediate
49
film formation as evidenced by the Zn dissolution rate being in-phase with the alternating current
50
(AC) component of the electrical current. In 0.5 M NaCl solution, no correlation between the AC
51
and the Zn dissolution rate was observed, indicating that oxide film formation and dissolution
52
were decoupled faradaic and non-faradaic processes, respectively. The goal of this article is to
53
extend the previous work to a multi-element system and to use the EIS spectra to distinguish
54
different mechanisms of dissolution by taking advantage of the time-resolved measurement of
55
each element of a multi-element system that AESEC technique provides.
56
The Al-Zn alloy system in alkaline solution was considered an ideal system for an early
57
demonstration of the method. The system is industrially significant: Al-Zn alloys are commonly
58
used as galvanic coatings on steel and occur as separate phases in Zn containing Al alloys, such
59
as the 6000 series, and are almost always exposed to alkaline solution in their lifetime either
60
during surface treatment by alkaline etching, or during corrosion when the cathodic reaction leads
61
to local pH changes. The mechanisms of anodic and cathodic dissolution of multi-phase Zn-5 wt.%
62
Al alloy coatings on steel were previously investigated [9, 10]. A complex interaction between
63
the Zn and Al was observed, however, interpretation of the mechanisms of these interactions was
64
hindered due to the multi-phase nature of the commercial coating material. Therefore, to simplify,
65
we isolated the chemistry of a single phase: the α-phase of Al-Zn (Zn-68 wt.% Al). The anodic
66
dissolution of Al and Zn were investigated as a function of potential in slightly alkaline (pH =
10.1) [11] and alkaline (pH = 12.8) [12] electrolytes. In the latter, the temperature dependence of
68
anodic dissolution was also investigated [13].
69
In summary of these results, three potential domains were identified where the dissolution
70
of the material occurred by very different mechanisms. Based on the individual Zn and Al
71
dissolution rate results and the electrochemical current, it was found that Al underwent a direct,
72
potential independent dissolution mechanism in the cathodic potential domain by reacting with
73
H2O, and without the formation of a significant intermediate oxide film. Metallic Zn accumulated
74
on the surface in a mechanism of cathodic dealloying. In the anodic domain, Zn was transformed
75
into an oxide film and Al dissolution occurred by ionic transfer across the film. As the two
76
mechanisms are very different, it was felt that EIS coupled to AESEC might further confirm
77
these mechanisms and allow a higher degree of precision on the mechanistic details.
78
79
Results and discussions 80
Overview of Al5.2Zn mechanisms as a function of potential
81
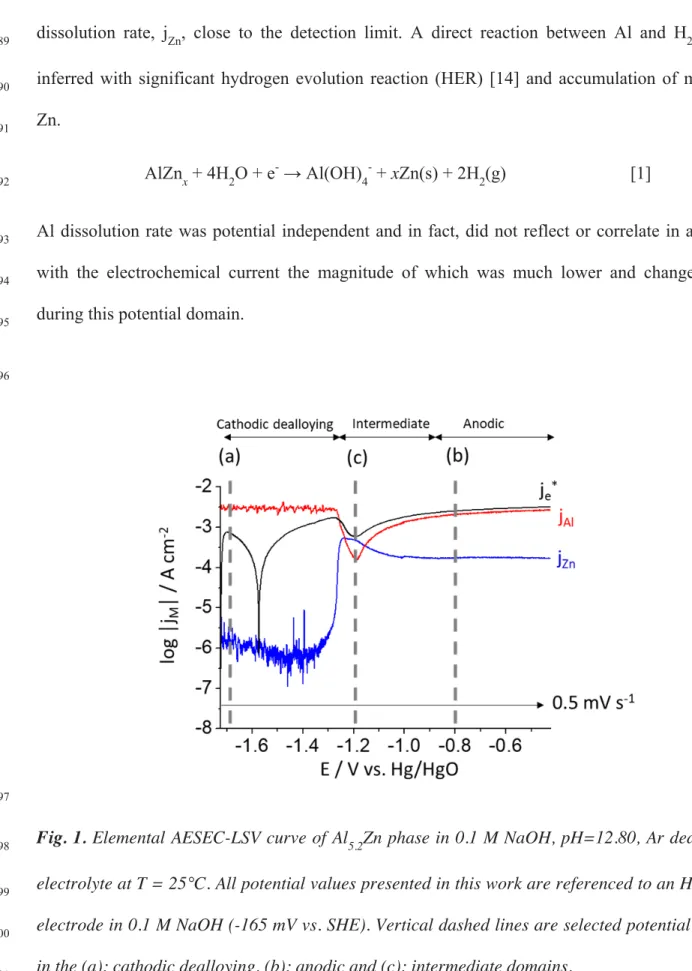
The sensitivity of the Al-Zn dissolution mechanism to potential is evident from the 82
AESEC-linear sweep voltammetry (AESEC-LSV) curve of Al5.2Zn (Zn-68 wt.% Al) phase in 0.1 83
M NaOH solution, shown in Fig. 1. Elemental dissolution rates (jM) and the convoluted electrical 84
current density (je*) as a function of potential are given with 0.5 mV s-1 scan rate. As previously 85
described, the polarization curve clearly shows three potential domains, to which can be ascribed 86
three unique mechanisms of dissolution. The cathodic dealloying domain occurs between -1.72 V 87
to -1.35 V vs. Hg/HgO. It is characterized by an intense Al dissolution rate, jAl, and a Zn 88
dissolution rate, jZn, close to the detection limit. A direct reaction between Al and H2O was 89
inferred with significant hydrogen evolution reaction (HER) [14] and accumulation of metallic 90
Zn. 91
AlZnx + 4H2O + e- → Al(OH)4- + xZn(s) + 2H2(g) [1] 92
Al dissolution rate was potential independent and in fact, did not reflect or correlate in anyway 93
with the electrochemical current the magnitude of which was much lower and changed sign 94
during this potential domain. 95
96
97
Fig. 1. Elemental AESEC-LSV curve of Al5.2Zn phase in 0.1 M NaOH, pH=12.80, Ar deaerated
98
electrolyte at T = 25°C. All potential values presented in this work are referenced to an Hg/HgO
99
electrode in 0.1 M NaOH (-165 mV vs. SHE). Vertical dashed lines are selected potential values
100
in the (a): cathodic dealloying, (b): anodic and (c): intermediate domains.
A totally different mechanism is apparent in the anodic domain (from -0.9 V to -0.4 V vs. 102
Hg/HgO), evidenced by the nearly congruent dissolution of Zn and Al, and the significantly 103
decreased amplitude of perturbations in the jAl signal. The DC faradaic yield of elemental 104
dissolution may be determined as ηDC = jΣ / je* when cathodic current contribution is negligible, 105
where jΣ = jZn + jAl. In this case, the dissolution rate follows the electrical current with nearly a 106
100% DC faradaic yield (ηDC = 0.98) of dissolution.The potential independence of Zn and Al 107
dissolution rates suggests an oxide film formation type of mechanism and indeed, Raman 108
spectroscopy and SEM analysis also demonstrated the formation of ZnO layer in this potential 109
domain [11, 12]
110
The elemental dissolution rates in the intermediate domain (from -1.35 V to -0.90 V vs. 111
Hg/HgO), is more complex and involves the accumulated metallic Zn enriched layer, Zn(0), that 112
was formed in the cathodic domain by the preferential Al dissolution. At the onset of Zn 113
dissolution, there is a notable decrease in the jAl, that we previously termed a negative correlation 114
effect (NCE) in [12]. The jZn reached its maximum value in approximately the same potential
115
domain as jAl obtained its minimum value. 116
117
AESEC-EIS results 118
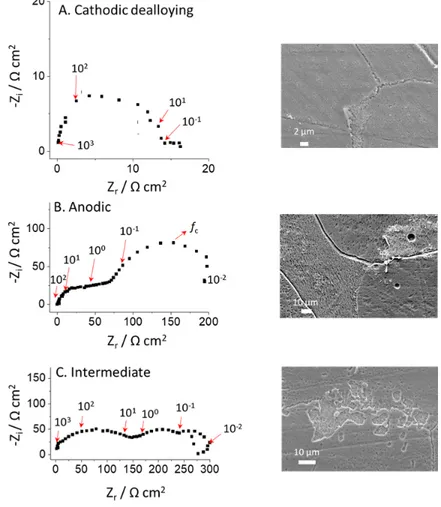
To corroborate and gain further insight into the proposed dissolution mechanisms, 119
potentiostatic EIS was performed simultaneously with AESEC in the three potential domains, at 120
potentials indicated as (a), (b), and (c) in Fig. 1. The Nyquist plots are presented in Fig. 2 and the 121
corresponding AESEC-EIS dissolution profiles are given in Figs. 3A – 3C. The effective oxide 122
capacitance (Cδ) values determined by the complex capacitance curve [15], the constant phase 123
element (CPE) parameters (α and Q), and the corresponding effective oxide layer thicknesses (δ) 124
for each potential domain are summarized in Table 1. 125
126
The Cathodic Dealloying Domain (-1.72 V to -1.35 V vs. Hg/HgO)
127
EIS in the cathodic dealloying domain (Fig. 2A) revealed a single time constant 128
suggesting that H2O reduction reaction was the dominating charge transfer reaction. The 129
dissolution profile obtained by AESEC (Fig. 3A) again demonstrates the potential independence 130
of Al dissolution, as the potential cycles at low frequency do not appear as oscillations in the 131
elemental dissolution rates. This is an important conclusion because it indicates that the EIS 132
spectra are revealing information on the interfacial electrochemical processes that may not 133
directly affect the dissolution rate. 134
135
Fig. 2. Nyquist plots at each potential domain determined from Fig. 1 and their corresponding 136
SEM images; A: -1.70 V vs. Hg/HgO, B: -0.80 V vs. Hg/HgO and C: -1.20 V vs. Hg/HgO. Arrows
137
are indicating frequency values (Hz).
138
139
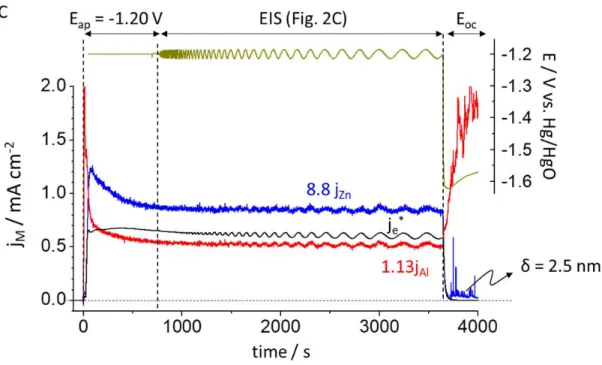
Fig. 3. AESEC-EIS curve of Al5.2Zn in 0.1 M NaOH, Ar deaerated electrolyte including
potentiostatic hold (Eap), EIS and open circuit measurement (Eoc). A: Eap = -1.70 V vs.
Hg/HgO, B: Eap = -0.80 V vs. Hg/HgO and C: Eap = -1.20 V vs. Hg/HgO. jM (M = Zn or Al)
values are normalized based on the molar composition for B and C.
141
The analysis of the high frequency loop shows a CPE behavior where α = 0.73 and Q = 142
(1.07 ± 0.20) x 10-3 Ω-1 cm-2 sα-1,estimated from a graphical analysis [16]. Assuming that this 143
time constant is attributed to a 2D frequency distribution [17], Brug’s relationships [18] allow an 144
estimation of the equivalent capacitance from the CPE parameters, in this case the double layer 145
capacitance, Cdl = 191 μF cm-2. This value is about an order of magnitude larger than the 146
expected value for a double layer capacitance and could represent the response of a very thin, 147
perhaps a non-uniform oxide film. It is reasonable to suppose that Al(OH)3 forms as a short lived 148
intermediate in Reaction 1 as previously discussed [12, 13]. Reaction 1 may be broken down into 149
more elementary steps as follows: 150
3H2O + 3e- → 3/2 H2 + 3OH- [2]
151
AlZnx + 3OH- → Al(OH)3 + xZn (s) + 3e- [3]
152
Al(OH)3 + OH- → Al(OH)4- [4]
153
AESEC directly measures Reaction 4, which involves no electron transfer and in principle should
154
be potential independent. The EIS results indicate that water reduction was potential dependent
155
(Fig. 2A). This confirms the conclusions of [13]; the dissolution of Al oxide/hydroxide layer
156
(Reaction 4) was the rate determining step (RDS) in accordance with previous studies [19, 20, 21,
157
22]. At steady state, Reactions 3 – 4 must occur at identical rates. The properties of the film most
158
likely determine the reaction rate by controlling the access of H2O to Al metal. The presence of
159
the film may not be directly detected by AESEC due to the intense dissolution rate and cathodic
160
current, however, the film is detected indirectly by EIS. The cathodic current resulting from the
161
HER may be determined simply as j∆ = je* - jΣ = jc, shown in Fig. 3A.
162
163
The anodic domain (-0.9 V to -0.4 V vs. Hg/HgO)
164
In the anodic domain, the polarization curve (Fig. 1) demonstrates that Zn and Al
165
dissolution rates and the electrochemical current are stable and nearly independent of potential. In
166
the EIS spectrum (Fig. 2B), three-time constants are observed. The high frequency capacitive
167
loop may be attributed to the charge transfer resistance of Zn and / or Al oxidation in parallel
168
with the interfacial capacitance. In this system, independent anodic dissolutions from Zn and Al
simultaneously occur at different rate and thus the admittance is the sum of these contributions.
170
This may explain why the two entangled time constants are observed in the high frequency
171
domain. The low frequency loop shows a nearly 45° phase that suggests a diffusion process [23, 172
24]. The time constant observed at intermediate frequency (approximately f = 1 Hz) is poorly 173
resolved due to overlap with the high and low frequency contributions and will not be discussed. 174
The high frequency capacitive loop is flattened and this can be described by a CPE in 175
parallel with the charge transfer resistance. We assume that this CPE is due to the distribution of 176
properties in a thin oxide film [16], for instance, the distribution of resistivity according to a 177
power-law model [25, 26]. From the analysis of the complex capacitance calculated from the 178
impedance data [15], the high frequency limit of the of the capacitance was Cδ = 0.65 ± 0.05 μF 179
cm-2. Such a low value is characteristic of the dielectric response of a thin oxide film. Assuming a 180
dielectric constant ε = 8.8 ± 0.8 for ZnO [27] the thickness of the thin oxide film, δ, formed at the 181
electrode interface is given by; 182
δ = ε ε0 / Cδ [5]
183
where ε0 is the vacuum permittivity (8.85 x 10⁻¹⁴ F cm-1). This equation yields δ = 12 ± 1 nm. 184
Such a value confirms the hypothesis that the interfacial capacitance is governed by the thin 185
oxide film contribution (i.e. the double layer capacitance which is in series with the capacitive 186
contribution of the oxide film, has in this case a negligible contribution). 187
The presence and characteristics of the oxide film may be further refined by consideration 188
of the low frequency capacitive loop. For the AESEC-EIS (Fig. 3B), very slight oscillations are 189
observed in the Zn and Al dissolution rate at low frequency (magnified curve is given in the 190
inset). The faradaic yield of dissolution for the total current, ηDC = 0.96 ± 0.03 close to 1, in 191
agreement with [12]. The faradaic yield of the AC component, ηAC, is defined as: 192
ηAC = AC amplitude (jΣ ) / AC amplitude (je*) [6] 193
From the data in Fig. 3B, ηAC = 1.01 ± 0.05, reasonably identical to ηDC within experimental error.
194
Note that error bar of ηAC was obtained from different frequency domains. It appears to be
195
distributed essentially in the Al dissolution although slight peaks above background are observed 196
for Zn dissolution as well. 197
The second capacitive loop in Fig. 2B shows a typical diffusion-controlled charge transfer 198
mechanism through an oxide layer [24]. Interestingly, the characteristic frequency, fc, = 0.032 Hz 199
at the apex of the time constant of the diffusion process in the Nernst layer may be expressed as; 200
fc = 2.51 D / 2π δ2 [7]
201
where δ is the thickness of the corrosion product, that can be in a first approximation evaluated to 202
be at least the thickness previously obtained from the CPE parameter (δ = 12 nm). The diffusion 203
coefficient may be calculated from Eq. 7, D = 1.15 x 10⁻¹³ cm2 s-1. Such a low value should be 204
due to the underestimated δ value because the calculation did not consider the porosity of the 205
oxide as well as the accumulation of corrosion products at the electrode surface. It may be 206
attributed to a diffusion of species inside of a micrometric diffusion layer of corrosion product. In 207
this case, the diffusion and migration caused by the large electric filed inside the film should be 208
taken into account. 209
A. Eap = -0.80 V vs. Hg/HgO
B. Eap = -1.20 V vs. Hg/HgO
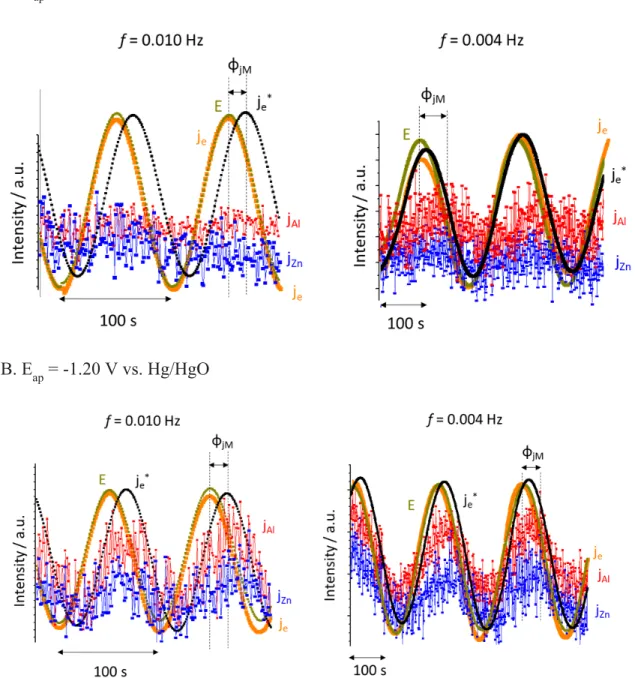
Fig. 4. The oscillation trends at low frequency domain for A: Eap = -0.80 V vs. Hg/HgO and B:
Eap = -1.20 V vs. Hg/HgO from Figs. 3B and 3C, respectively.
211
Fig. 4 shows the oscillation trends of the je, je*, jM and applied potential (E) at a given
212
presented in arbitrary units. The phase shift of jM and je* vs. E (ϕjM) results from the residence
214
time distribution of the flow cell [5], which means that it is not frequency dependent but time
215
dependent. The actual phase shift between E and je (ϕ) was nearly zero in all cases as shown in
216
Fig. 4. 217
The impedance contribution from each elemental dissolution in real part, Zr (jM), is given 218
in Table 2, calculated at each frequency domain as: 219
Zr (jM) = (|d E| / |d jM|) cos(ϕ) [8]
220
For Eap = -0.80 V vs. Hg/HgO (Fig. 4A), jZn oscillation is less evident than at Eap = -1.20 V vs. 221
Hg/HgO (Fig. 4B), probably indicating a weak potential dependent Zn dissolution in the anodic 222
potential domain due to the Zn-based corrosion products formation. The high Zr (jZn) values at
223
Eap = -0.80 V vs. Hg/HgO could also be explained by the weak potential dependency of Zn
224
dissolution at this potential. For Eap = -1.20 V vs. Hg/HgO, Zr (jZn) + Zr (jAl) ≈ Zr – Re, which may
225
indicate that jZn and jAl contributed to the total impedance with a parallel relationship.Note that
226
Zr is measured by potentiostat then subtracted by the electrolyte impedance, Ze = Re. It is
227
consistent with the previously proposed dissolution model of the Al5.2Zn phase in which Al
228
dissolution occurred through a porous Zn(0) layer in parallel with Zn dissolution [12]. It should
229
be mentioned that the dissolution is not a simple mechanism as it usually involves the adsorbed
230
intermediate species which may result in a delay between the je* and jM.
231
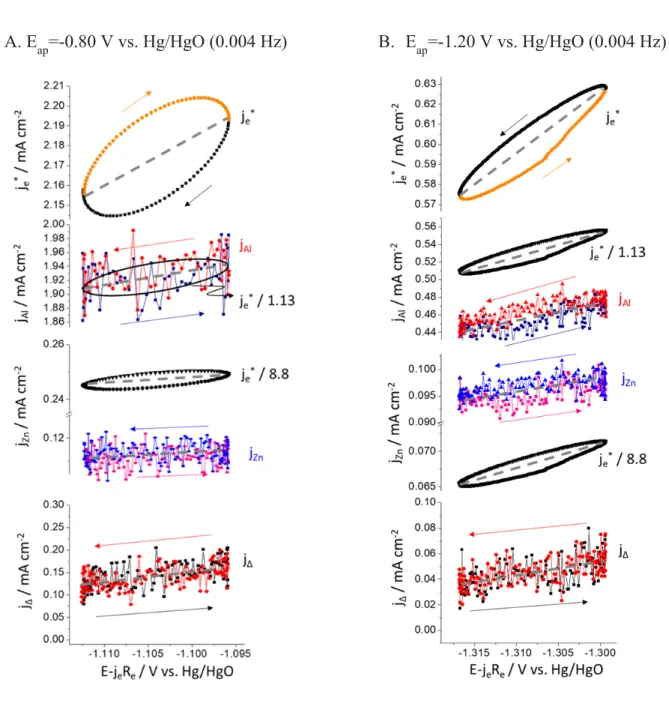
The correlation between the AC current and dissolution rates is highlighted by the
232
Lissajous analysis in Figs. 5A (Eap = -0.80 V vs. Hg/HgO) and 5B (Eap = -1.20 V vs. Hg/HgO) at
233
f = 0.004 Hz. je* curve is shown on the top, both for upper and lower potential scans. For jM vs. E
curves in the middle, je* assuming congruent dissolution of Al and Zn are also shown. For 235
example in Fig. 5A, Al dissolution was congruent as jAl ≈ (je* / 1.13) whereas Zn dissolution was 236
not as jZn < (je* / 8.8). The correlation of Zn dissolution rate with potential is less obvious than for 237
Al, but exists (also see Fig. 4A). In principle, at this potential, there is no significant cathodic 238
reaction, so we conclude that the AC current is primarily going to the formation and reduction of 239
ZnO or Zn(OH)2. It was previously shown that the ηAC ≈ ηDC ≈ 1 at Eap = -0.80 V vs. Hg/HgO,
240
supporting this assumption. The weak correlation is interesting since the overall faradaic yield of
241
dissolution based on the DC current density and elemental dissolution rates was nearly 100% 242
(ηDC = 0.96 ± 0.03) at this potential. In this case, it could be concluded that the DC component
243
was due to the dissolution of the corrosion products [6, 7, 28].
244 245 246 247 248 249 250 251 252 253
255
A. Eap=-0.80 V vs. Hg/HgO (0.004 Hz) B. Eap=-1.20 V vs. Hg/HgO (0.004 Hz)
Fig. 5. Lissajous analysis at f = 0.004 Hz at A: Eap = -0.80 V vs. Hg/HgO and B: Eap = -1.20 V vs. HgO. The je*, jAl and jZn are shown as a function of IR drop compensated applied potential (E-jeRe). One cycle including upper and lower potential scans, indicated by arrows, is given.
The kinetic parameters for ZnO formation and reduction may be estimated from the j∆ vs.
257
E Lissajous plot, shown in the bottom of Fig. 5. The Zn dissolution in the anodic potential
258
domain (Fig. 5A) may be the combination of a series of elementary reactions as: 259
Zn + 2OH- → Zn(OH)2 + 2e- (jΔ) [9]
260
Zn(OH)2 + OH- → Zn(OH)3- [10]
261
Zn + Zn(OH)2 + 2OH- → 2ZnO + 2H2O + 2e- (jΔ) [11] 262 ZnO + OH- + H 2O → Zn(OH)3 - (j Zn) [12] 263
The intermediate species such as ZnOH or ZnOHads [29, 30, 31] are not considered as the time 264
scale of the AESEC experiment is too slow to measure these species. The formation rate of 265
Zn(OH)2 or ZnO (j∆) is potential dependent (Reactions 9 and 11) given that the Lissajous plot of
266
jΔ vs. E showed the linearity, neglecting the contribution of cathodic current at this potential. The
267
anodic Tafel slope of jΜ (ba, jM) may be calculated as; 268
ba, jM = 2.303 ΔE / ln(jM+/jM-) [13]
269
where jM+ and jM- are jMvalues measured at the highest and lowest potential, respectively. ΔE is 270
the difference between the highest and lowest potential. ba, jΔ = 94 mV decade-1 and ba, jZn = 2350 271
mV decade-1 are calculated by Eq. 13. It is clearly demonstrated that the formation of ZnO 272
(Reaction 11) is faster than the dissolution (Reaction 12), resulting in the growth of the ZnO layer 273
[12, 13]. 274
The quantity of oxide formed during the AESEC-EIS experiment may be estimated by the 275
dissolution profile obtained after releasing the potential to open circuit at the end of the 276
experiment. The Eap = -0.80 V vs. Hg/HgO AESEC-EIS profile of Fig. 3B illustrates this idea. At 277
the end of the experiment, the presence of oxide dissolution is indicated by a plateau in the Eoc vs. 278
time profile at approximately Eoc = -1.50 V vs. Hg/HgO. The removal of the oxide and the 279
exposure of the underlying metallic substrate is indicated by the sudden drop in potential to < -280
1.6 V vs. Hg/HgO. The removal of the oxide film gives rise to a transient dissolution of Zn, 281
which decays steadily but at a rate significantly slower than the residence time distribution 282
associated with the flow cell. The latter is indicated by the drop of the convoluted 283
electrochemical current, je*. Integration of the jZn yields a thickness of ZnO layer δ = 11 nm was 284
obtained assuming a uniform ZnO layer formation over the geometrical surface area and a ZnO 285
density of 5.6 g cm-3. This is in the same range as the thickness estimated from EIS of 12 ± 1 nm 286
(Table 1). 287
288
The Intermediate Domain (-1.35 V to -0.9 V vs. Hg/HgO)
289
In the intermediate domain, both jZn and jAl showed clear in-phase oscillations, with the 290
low frequency AC current (Fig. 3C). The EIS response in Fig. 2C shows three capacitive time 291
constants and one inductive loop. An inductive loop has already been reported for both Zn and Al 292
dissolution. In the case of Zn, this loop is usually observed in the intermediate frequency range 293
[24, 32] whereas for Al, it can be only be seen in the low frequency domain in an alkaline 294
solution [33, 34]. We thus conclude that the inductive loop observed for f < 10-2 Hz may be 295
attributed to the relaxation of the surface intermediates involved in the dissolution mechanism of 296
Al and Zn [35]. The third capacitive loop is similar to the one observed at Eap = -0.80 V vs. 297
Hg/HgO and may be ascribed to diffusion processes inside a thin layer. The characteristic 298
frequency is also similar to the previous case in Fig. 2B confirming that convection-diffusion 299
controlled mechanism by the flux of the electrolyte in the AESEC experiment. 300
The second capacitive loop (10-1 Hz < f < 100 Hz) was also distributed and its analysis is 301
complicated by the fact that it is convoluted with other processes at both higher and lower 302
frequency. However, it may be ascribed to Zn dissolution [24]. The high frequency time constant 303
was analyzed as previously described. From the CPE behavior, the oxide film thickness was 304
estimated at δ = 2.4 nm. The analysis of the high frequency loop for each potential showed that 305
the thin film formed on the alloy surface has a thickness that strongly depends on the applied 306
potential. 307
In Fig. 3C, a peak of Zn dissolution is observed after the potential release, albeit a much 308
smaller peak than at Eap = -0.80 V vs. Hg/HgO (Fig. 3B). Nevertheless, this peak cannot be 309
unequivocally attributed to oxide dissolution as there is no clearly defined potential plateau 310
following the potential release. Assuming that this peak was due to oxide dissolution, an 311
estimated thickness of 2.5 nm is obtained with the same assumptions as before, in good 312
agreement with that obtained from the EIS analysis of 2.4 ± 0.3 nm (Table 1). 313
The low frequency Lissajous plots at Eap=-1.20 V vs. Hg/HgO (Fig. 5B) show linear 314
behavior within experimental error indicating that the elemental dissolution current (jM) for each 315
species is in-phase with the potential. In this case, the linearity of the Lissajous plots of jZn and jΔ 316
is clearly demonstrated, indicating that both reactions are charge transfer limited. The cathodic 317
zero current potential (Ej=0). The Zn oxidation reaction may be written by the combination of 319
Reactions 9 and 10 as; 320
Zn + 3OH- → Zn(OH)3- + 2e- (jZn) [14]
321
and the formation of the ZnO (jΔ) is via Reaction 11. ba, jΔ = 68 mV decade-1 and ba, jZn = 864 mV 322
decade-1 were obtained by Eq. 13 from Fig. 5B. Given that the Tafel slope of jZn at Eap = -1.20 V 323
vs. Hg/HgO is lower than that at Eap = -0.80 V vs. Hg/HgO, it could be concluded that the 324
dissolution of Zn is faster in former case resulting in a relatively thinner ZnO layer formation. 325
In this case, both Zn and Al dissolution were not faradaic in that je* / 1.13 ≠ jAl and je* / 8.8
326
≠ jZn (Fig. 5B). It showed a significant difference between ηDC = 0.92 ± 0.02 and ηAC = 0.65 ±
327
0.03. It was proposed that the AC component is due to non-faradaic reactions at the metal/oxide
328
interface and the DC component to the faradaic dissolution of the film at the oxide/electrolyte
329
interface [6, 7, 28]. For the AC case in the intermediate domain, it can be concluded that
330
formation of the corrosion product would be the RDS, given that ηDC >> ηAC, consistent with the
331
Tafel slope analysis. A simplified elemental dissolution at each interface in anodic potential
332
domain is illustrated in Fig. 6. The system extends our previous work with AESEC-EIS in that
333
the potential dependent and potential independent mechanisms are observed for two different
334
elements of a single system. In the previous work they were observed for Zn in different
335
electrolytes [8].
336
Interestingly, jZn was higher than its congruent dissolution level (je* / 8.8) whereas jAl was
337
lower than je* / 1.13. The excess Zn dissolution could lead to a restrained Al dissolution,
338
referenced as the NCE [12].
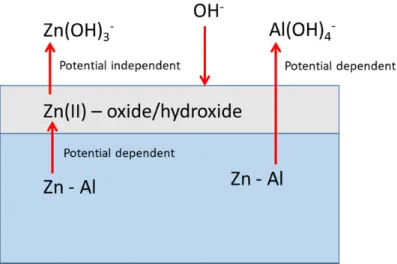
Fig. 6. Simplified schematic model of elemental dissolution at each interface of AlxZn in 0.1 M
NaOH solution in anodic potential domain.
340
Al0.7Zn (Zn-22 wt.%Al) 341
In this section, we will demonstrate the AESEC-EIS methodology with a system that is 342
intrinsically unstable and shows a more usually observed dissolution case for the lower Al 343
content Zn-Al system [36]. An AESEC-EIS curve (Fig. 7A), magnified oscillation trends at f =
344
0.010 Hz (Fig. 7B) and a corresponding Nyquist plot (Fig. 7C) for the Al0.7Zn (Zn-22 wt.% Al) 345
nominally pure phase at Eap = -1.36 V vs. Hg/HgO (i.e. +150 mV from Ej=0) in the same 346
electrolyte are given. It is clear from Fig. 7A that the elemental dissolution mechanism varies 347
throughout the time period of the experiment. Initially, Zn dissolution was intense at 348
approximately the same level as Al. However, for t > 2700 s (f < 0.005 Hz), jZn decreased to 349
under the detection limit and Al dissolution changed from a charge transfer to a chemical 350
dissolution mechanism. The latter is indicated by the disappearing oscillation of jAl, and the 351
dissolution mechanism is also revealed in the Nyquist plot (Fig. 7C) where an unambiguous 353
diffusive impedance trend was observed (ϕ = 45°) in this frequency domain. ZnO/Zn(OH)2 354
formation and dissolution would occur for f ≥ 0.007 Hz as Reactions 9 - 12: 355
A.
B.
Fig. 7. A: AESEC-EIS curve of Zn-22 wt.% Al in 0.1 M NaOH, Ar deaerated electrolyte, at Eap
= -1.36 V vs. Hg/HgO, B: oscillation trends at f = 0.010 Hz, and C: corresponding Nyquist
plot.
356
jZn showed a clear oscillation from a relatively higher frequency domain (f ≈ 0.030 Hz)
357
where no jAl oscillation was observed. jAl oscillation disappeared with the dissolution of
358
ZnO/Zn(OH)2 for t > 2700 s, indicating that Al dissolution occurred through this Zn-based
359
corrosion product layer (see also Fig. 6). The phase shift of E vs. je (ϕ) was not zero as
360
summarized in Table 3, whereas ϕ ≈ 0 for Al5.2Zn (Fig. 4). The measured total impedance was
361
close to the sum of each elemental contribution calculated from Eq. 8, Zr - Ze ≈ Zr (jZn) + Zr (jAl),
362
similar to the Al5.2Zn in the same potential domain, which can be an indicative of the parallel
363
relationship between Zn and Al dissolution. The phase shift between jZn and jAl was 180˚ (Fig. 7B)
364
whereas in-phase relation was monitored for Al5.2Zn (Fig. 4). The out-of-phase of jZn and jAl
365
should have been explained by the fact that Al dissolution is related to the cathodic reaction at
366
open circuit potential [28]. However, it is not probable in the present work because this phase
negligible. One possible explanation is that in this potential domain, the slope of the Al
369
dissolution rate - potential curve is negative [36] resulting in a negative low frequency-impedance
370
[37, 38].
371
For f ≤ 0.007 Hz, jZn decreased to under the detection limit as all the previously formed
372
ZnO/Zn(OH)2 dissolves. Previously for Al5.2Zn phase, a clear Zn dissolution peak was observed
373
during the spontaneous dissolution after the AESEC-EIS experiments in Figs. 3B and 3C. It was
374
attributed to the residual ZnO/Zn(OH)2 dissolution formed during the potentiostatic experiment.
375
In Fig. 7, no jZn peak was monitored in Eoc indicating that the oxide was completely dissolved
376 near t = 2700 s. 377 378 Conclusion 379
In this work, we have demonstrated the application of combined AESEC-EIS to identify
380
and quantify different anodic dissolution processes for a multi-element system, Al-Zn pure phase
381
in 0.1 M NaOH. The elemental dissolution mechanism at each potential domain was elucidated
382
by the AESEC-EIS technique.
383
AESEC gave immediate information on the elemental dissolution rates and transient
384
behavior while EIS gave information on the physical properties of intermediate oxide layers and
385
kinetic information for water reduction in the cathodic domain. A potential independent Al
386
dissolution without forming an oxide layer was observed by AESEC-EIS at a cathodic potential
387
domain (Eap = -1.70 V vs. Hg/HgO).
By comparing the DC and AC faradaic yield, information on the localization of charge
389
transfer reactions could be obtained. In the anodic domain (Eap = -0.80 V vs. Hg/HgO), ηDC ≈ ηAC
390
indicating that the formation and dissolution of the corrosion products occur at the nearly same
391
rate, consistent with the previous observation [12, 13]. In the intermediate domain (Eap = -1.20 V
392
vs. Hg/HgO), formation would be the RDS as ηDC >> ηAC. In the former case, the oxidation of
393
metal occurred through a corrosion product layer. In the latter case, the oxidation would occur
394
directly from the metal/oxide complex. It was further demonstrated by the Tafel slope of jZn from
395
the elemental Lissajous analysis (Fig. 5). In this way, AESEC-EIS can be utilized to distinguish
396
the different elemental dissolution kinetics. Diffusion processes were identified although the
397
precise origin was not ascertained, i. e. across corrosion product films or within inter-granular
398
crevices and pits.
399
Elemental impedance contribution, Zr (jM), demonstrated the potential dependent
400
elemental dissolution model of Al-Zn pure phase proposed in [12]. In the intermediate potential
401
domain, Al dissolution occur through the porous Zn(0) enriched layer in parallel with Zn
402
dissolution as Zr (jZn) + Zr (jAl) ≈ total measured impedance (Zr – Ze).
403
For Al5.2Zn, Al and Zn dissolution rates were in-phase regardless of the applied potential. 404
For Al0.7Zn and other low Al content alloys and phases [36], Al and Zn dissolution rates showed 405
a 180° phase shift. However, the origin of the phase shift is not ascertained to the satisfactory
406
level.
407
408
Materials
410
A nominally pure phases of Al-Zn (Zn-68 wt.% Al and Zn-22 wt.% Al), provided and 411
characterized by the Department of Metals and Corrosion Engineering, University of Chemistry 412
and Technology, Prague, were investigated in this work. Zn-68 wt.% Al phase is denoted as
413
Al5.2Zn and Zn-22 wt.% Al as Al0.7Zn, based on their molar compositions to facilitate the 414
congruent dissolution analysis. The chemical composition of these materials were 67.6 wt.% Al 415
and 32.4 wt.% Zn (Zn-68 wt.% Al), and 21.4 wt.% Al and 78.6 wt.% Zn (Zn-22 wt.% Al), 416
respectively, measured by atomic absorption spectroscopy (AAS). All samples were ground with 417
Si-C paper up to P4000 under ethanol, dried with flowing N2 gas then stored in a humidity 418
chamber of 50% relative humidity with saturated Mg(NO3)2 6H2O during 24 hours, providing a 419
reproducibly oxidized surface prior to the experiment [36, 39 ]. All the experiments were 420
performed in a 0.1 M NaOH (pH = 12.80) at T = 25°C, prepared from analytical grade materials 421
using deionized water obtained by a MilliporeTM system (18.2 MΩ cm). The electrolytes were 422
deaerated by Ar gas for 30 min prior to the tests and maintained during the experiments. 423
424
Atomic emission spectroelectrochemistry (AESEC)
425
The AESEC technique has been described in detail elsewhere [5, 40]. The working 426
electrode was in contact with the flowing electrolyte in a specially designed flow cell [5, 41] with 427
conventional three-electrode system; a Hg/HgO in 0.1 M NaOH (-165 mV vs. SHE) as a 428
reference electrode and a Pt foil as a counter electrode. The elements released from the working 429
electrode were transported to an Ultima 2C Horiba Jobin-Yvon inductively coupled plasma 430
atomic emission spectrometer (ICP-AES). The concentrations of Zn and Al were determined 431
from the emission intensity at 213.86 nm (Zn with a Paschen-Runge polychromator) and at 432
167.08 nm (Al with a monochromator) wavelength, respectively, using standard ICP-AES 433
calibration techniques. 434
A Gamry Reference 600TM potentiostat was used to perform electrochemical impedance 435
spectroscopy (EIS) and linear sweep voltammetry (LSV). The electrochemical response (namely 436
the electrical current density, je, and the electrode potential, E) were recorded in real-time with
437
the elemental dissolution rates, using the analog data acquisition and the software interface 438
(QuantumTM, Horiba Jobin-Yvon) of the AESEC technique. The EIS was performed at different 439
potentials from 100 kHz to 0.004 Hz with 8 points per decade of frequency and applying a 10 440
mVrms sinewave perturbation. 441
442
Data analysis of the AESEC technique
443
The atomic emission intensity at a characteristic wavelength (λ) of the element M, IM, λ, 444
was recorded by the ICP-AES as a function of time downstream from an electrochemical flow 445
cell. The elemental concentration (CM) is calculated as; 446
CM = (IM, λ – IM, λ°) / κλ [15]
447
where IM, λ° is the background signal, and is κλ the sensitivity factor of M, obtained from a 448
standard ICP calibration method. The elemental dissolution rate (vM) can be calculated from Eq.
449
15 with the flow rate of the electrolyte (f = 2.8 mL min-1) and the exposed surface area A (1.0
450
cm2) as:
The vM was converted to an equivalent elemental current density (jM) to facilitate comparison
453
with the electrical current density (je) measured by the potentiostat, in a relationship with; 454
jM = z F vM [17]
455
where F is the Faraday constant and z is the valance of the dissolving species (Al3+, Zn2+). It is 456
often useful to present je* which represents the measured je after a numerical convolution with the
457
residence time distribution in the flow cell (a lognormal distribution), thereby allowing a direct
458
comparison between the instantaneous values of je* and jM [5]. Cathodic reactions and the
459
formation of insoluble or slightly soluble species are not directly detected by ICP-AES. If surface
460
charging is neglected, the faradaic component of these hidden processes may be determined by a
461
mass-charge balance as:
462 jΔ = je* - jZn - jAl [18] 463 464 Surface characterization 465
The sample surface after each potentiostatic AESEC-EIS experiment was characterized 466
by scanning electron microscopy (SEM) suing a Zeiss LEO 1530TM microscope with field 467
emission gun source at 15 keV, and with 15 mm working distance. An equal mix of secondary 468
electron and back-scattered electron detector was used. 469
470
Acknowledgement 471
Authors would like to appreciate to Dr. Jan Stoulil, University of Chemistry and Technology in 472
Prague, Czech Republic for supplying Zn-22 wt.% Al and Zn-68 wt.% Al samples. 473
474
Author Contributions 475
J. H. carried out the AESEC-EIS experiments and coordinated analysis between two techniques. 476
V. V. was responsible for the EIS data interpretation. K. O. conceptualized the AESEC-EIS 477
analysis. All authors contributed to write the paper and revision. 478
479
Data availability 480
The authors declare that the data supporting the findings of this study are available within the 481
paper. The supplementary data will be available upon reasonable request. 482
483
Competing interests 484
The authors declare no competing interests. 485
486
487
Figure captions 488
Fig. 1. Elemental AESEC-LSV curve of Al5.2Zn phase in 0.1 M NaOH, pH=12.80, Ar deaerated 489
electrolyte at T = 25°C. All potential values presented in this work are referenced to an Hg/HgO 490
electrode in 0.1 M NaOH (-165 mV vs. SHE). Vertical dashed lines are selected potential values 491
in the (a): cathodic dealloying, (b): anodic and (c): intermediate domains. 492
Fig. 2. Nyquist plots at each potential domain determined from Fig. 1 and their corresponding 493
SEM images; A: -1.70 V vs. Hg/HgO, B: -0.80 V vs. Hg/HgO and C: -1.20 V vs. Hg/HgO. 494
Arrows are indicating frequency values (Hz). 495
Fig. 3. AESEC-EIS curve of Al5.2Zn in 0.1 M NaOH, Ar deaerated electrolyte including 496
potentiostatic hold (Eap), EIS and open circuit measurement (Eoc). A: Eap = -1.70 V vs. Hg/HgO, 497
B: Eap = -0.80 V vs. Hg/HgO and C: Eap = -1.20 V vs. Hg/HgO. jM (M = Zn or Al) values are 498
normalized based on the molar composition for B and C. 499
Fig. 4. The oscillation trends at low frequency domain for A: Eap = -0.80 V vs. Hg/HgO and B: 500
Eap = -1.20 V vs. Hg/HgO from Figs. 3B and 3C, respectively. 501
Fig. 5. Lissajous analysis at f = 0.004 Hz at A: Eap = -0.80 V vs. Hg/HgO and B: Eap = -1.20 V vs. 502
HgO. The je*, jAl and jZn are shown as a function of IR drop compensated applied potential (E-503
jeRe). One cycle including upper and lower potential scans, indicated by arrows, is given. 504
Fig. 6. Simplified schematic model of elemental dissolution at each interface of AlxZn in 0.1 M 505
NaOH solution in anodic potential domain. 506
Fig. 7. A: AESEC-EIS curve of Zn-22 wt.% Al in 0.1 M NaOH, Ar deaerated electrolyte, at Eap = 507
-1.36 V vs. Hg/HgO, B: Oscillation trends at f = 0.010 Hz, and C: Corresponding Nyquist plot. 508
509
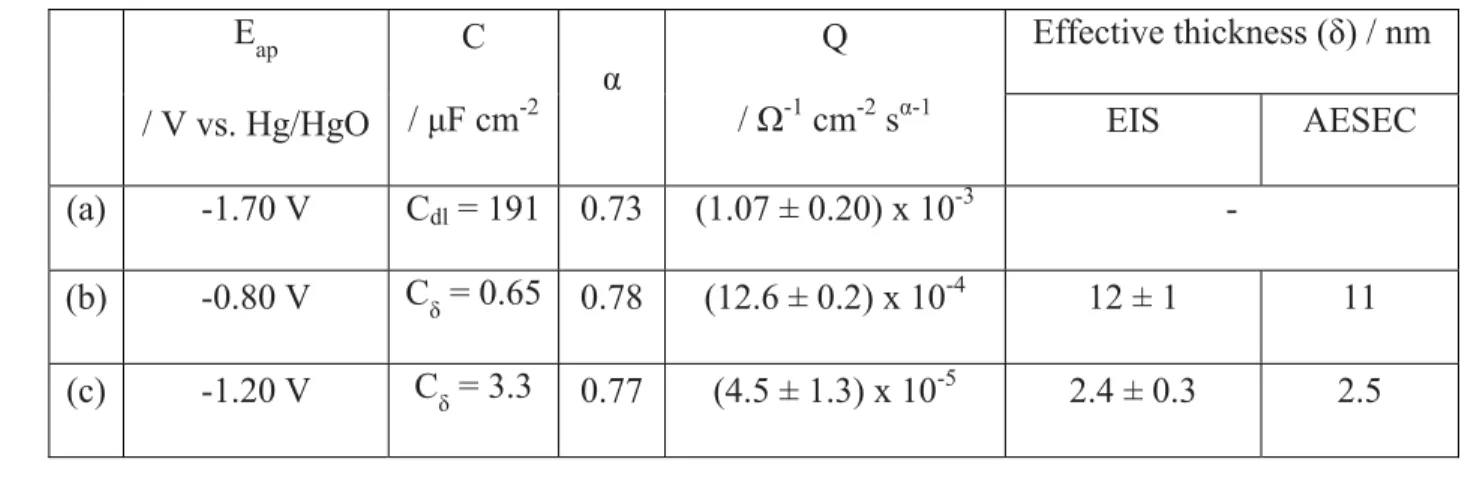
Table 1. The effective capacitance values obtained from Brug’s relation [18] (a), complex 510
capacitance curve [15] (b) and (c). CPE parameters (α and Q) are provided. The corresponding 511
effective oxide layer thickness (δ) calculated by Eq. 5 and obtained from the AESEC mass-512
balance are given. 513 Eap / V vs. Hg/HgO C / μF cm-2 α Q / Ω-1 cm-2 sα-1 Effective thickness (δ) / nm EIS AESEC (a) -1.70 V Cdl = 191 0.73 (1.07 ± 0.20) x 10-3 - (b) -0.80 V Cδ = 0.65 0.78 (12.6 ± 0.2) x 10-4 12 ± 1 11 (c) -1.20 V Cδ = 3.3 0.77 (4.5 ± 1.3) x 10-5 2.4 ± 0.3 2.5 514
Table 2. The real part impedance measured by the potentiostat (Zr - Ze), contribution of Zn 515
dissolution (Zr(jZn)) and Al dissolution (Zr (jAl)). 516
f / Hz Zr - Ze / Ω cm2 Zr (jZn) / Ω cm2 Zr (jAl) / Ω cm2
Eap = -0.80 V vs. Hg/HgO (anodic domain)
0.010 194 878 19
0.004 192 872 61
Eap = -1.20 V vs. Hg/HgO (intermediate domain)
0.013 305 270 48
0.010 297 274 37
0.008 287 275 37
0.006 279 234 29
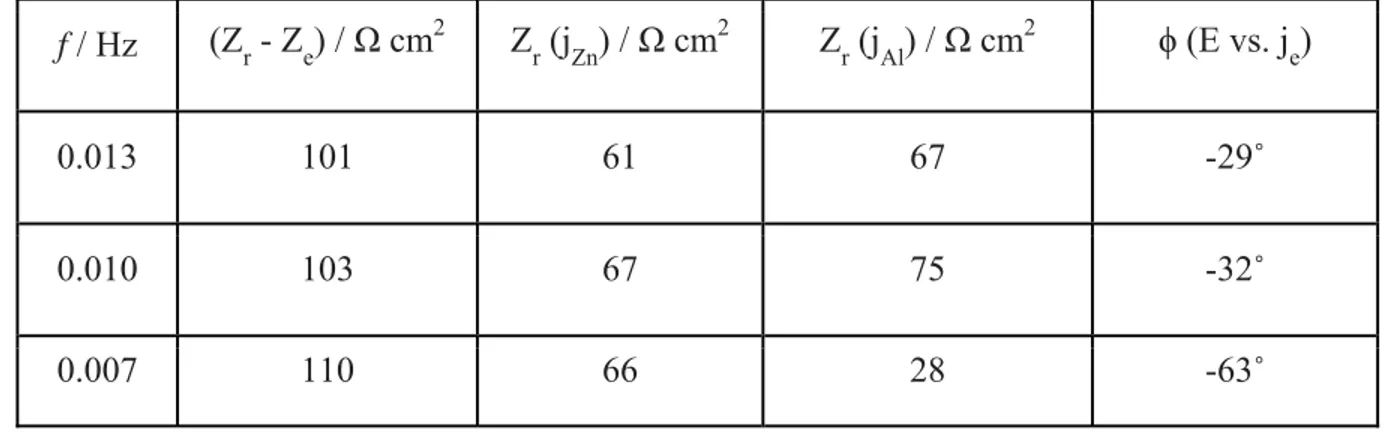
Table 3. The real part of impedance, and ϕ obtained from Fig. 7. 518 f / Hz (Zr - Ze) / Ω cm2 Zr (jZn) / Ω cm2 Zr (jAl) / Ω cm2 ϕ (E vs. je) 0.013 101 61 67 -29˚ 0.010 103 67 75 -32˚ 0.007 110 66 28 -63˚ 519 References 520
[ 1 ] Epelboin, I., Keddam, M., & Takenouti, H. Use of impedance measurements for the determination of the instant rate of metal corrosion. J. Applied Electrochem. 2, 71-79 (1972). [2] Keddam, M., Mattos, O.R. & Takenouti, H. Mechanism of anodic dissolution of iron-chromium alloys investigated by electrode impedances - II. Elaboration of the reaction model.
Electrochim. Acta, 31, 1159-1165 (1986).
[3] Wang, X. et al. A new transfer function in electrochemistry: Dynamic coupling between Raman spectroscopy and electrochemical impedance spectroscopy. Electrochim. Acta, 55, 6299-6307 (2010).
[4] Gabrielli, C. & Tribollet, B. A Transfer Function Approach for a Generalized Electrochemical Impedance Spectroscopy. J. Electrochem. Soc. 141, 1147-1157 (1994).
[ 5 ] Ogle, K. Atomic emission spectroelectrochemistry: Real time rate measurements of dissolution, corrosion and passivation. Corrosion, 75(12), 1398-1419 (2019).
[6]Jiang, L., Wolpers, M., Volovitch, P. & Ogle, K. The degradation of phosphate conversion coatings by electrochemically generated hydroxide. Corros. Sci. 55, 76-89 (2012).
[7] Jiang, L., Wolpers, M., Volovitch, P. & Ogle, K. An atomic emission spectroelectrochemical study of passive film formation and dissolution on galvanized steel treated with silicate
conversion coating. Surf. & Coat. Tech. 206, 3151-3157 (2012).
[8] Shkirskiy, V., & Ogle, K. A novel coupling of electrochemical impedance spectroscopy with atomic emission spectroelectrochemistry: Application to the open circuit dissolution of zinc.
Electrochim. Acta, 168, 167-172 (2015).
[9] Vu, T. N., Volovitch, P. & Ogle, K. The effect of pH on the selective dissolution of Zn and Al from Zn–Al coatings on steel. Corros. Sci. 67, 42-49 (2013).
[10] Vu, T. N., Mokaddem, M., Volovitch, P. & Ogle, K. The anodic dissolution of zinc and zinc alloys in alkaline solution. II. Al and Zn partial dissolution from 5% Al–Zn coatings. Electrochim.
[11] Han, J. & Ogle, K., Cathodic dealloying of α-phase Al-Zn in slightly alkaline chloride electrolyte and its consequence for corrosion resistance. J. Electrochem. Soc. 165, C334-C342 (2018).
[12] Han, J. & Ogle, K. The anodic and cathodic dissolution of α-phase Zn-68Al in alkaline media. Corros. Sci. 148, 1-11 (2019).
[13] Han, J., Thierry, D. & Ogle, K. Temperature dependence of the passivation and dissolution of Al, Zn and α-phase Zn-68Al. Corrosion, 75(1), 68-78 (2019).
[14] Han, J. & Ogle, K. Hydrogen evolution and elemental dissolution by combined gravimetric method and atomic emission spectroelectrochemistry. J. Electrochem. Soc. 166(11), C3068-3070 (2019).
[15] Benoit, M. et al. Comparison of different methods for measuring the passive film thickness on metals. Electrochem. Acta, 201, 340-347 (2016).
[ 16 ] Orazem, M. E., Pébère, N. & Tribollet, B. Enhanced graphical representation of electrochemical impedance data. J. Electrochem. Soc. 153(4), B129-B139 (2006).
[17] Hirschorn, B. et al. Determination of effective capacitance and film thickness from constant-phase-element parameters. Electrochim. Acta, 55, 6218-6227 (2010).
[18] Brug, G. J., Van Den Eeden, A. L. G., Sluyters-Rehbach, M. & Sluyters, J. H. The analysis of electrode impedance complicated by the presence of a constant phase element. J. Electroanal.
Chem. 176, 275-295 (1984).
[19] Zhang, J., Klasky, M. & Letellier, B. C. The aluminum chemistry and corrosion in alkaline solutions. J. Nucl. Mater. 384, 175-189 (2009).
[20] Chu, D. & Savinell, R.F. Experimental data on aluminum dissolution in KOH electrolytes.
Electrochim. Acta, 36(10) 1631-1638 (1991).
[21] Moon, S. M. & Pyun, S. I. The corrosion of pure aluminium during cathodic polarization in aqueous solutions. Corros. Sci. 39(2) 399-408 (1997).
[22] Pyun, S. & Moon, S. Corrosion mechanism of pure aluminium in aqueous solution”, J. Solid
State Electrochem. 4, 267-272 (2000).
[23] Cachet, C. Ströder, U. & Wiart, R. The kinetics of zinc electrode in alkaline zincate electrolytes. Electrochim. Acta, 27(7), 903-908 (1982).
[24] Cachet, C., De Pauli, C. P. & Wiart, R. The passivation of zinc in slightly alkaline solutions.
Corros. Sci. 25(7), 493-502 (1985).
[25] Hirschorn, B. et al. Constant-phase-element behavior caused by resistivity distributions in films: II. Applications. J. Electrochem. Soc. 157(12), C458-C462 (2010).
[26] Hirschorn, B. et al. Constant-phase-element behavior caused by resistivity distributions in films: I. Theory. J. Electrochem. Soc. 157(12), C452-C457 (2010).
[27] Madelung, O., Rössler, U., & Schulz M. (eds) II-VI and I-VII Compounds; Semimagnetic compounds. Landolt-Börnstein – Group III Condensed Matter (Numerical data and functional relationships in science and technology), vol. 41B. Springer, Berlin, Heidelberg.
[28] Shkirskiy, V., Maltseva, A., Ogle, K. & Volovitch, P. Environmental effects on selective dissolution from ZnAlMg alloy under low frequency alternating current perturbations.
Electrochim. Acta, 238, 397-409 (2017).
[30] Cachet, C., Saïdani, B. & Wiart, R. The behavior of zinc electrode in alkaline electrolytes I. A kinetic analysis of cathodic deposition. J. Electrochem. Soc. 138(3), 678-687 (1991).
[31] Thomas, S., Birbilis, N., Venkatraman, M. S. & Cole, I. S. Corrosion of zinc as a function of pH. Corrosion, 68(1), 015009-1 (2012).
[32] Armstrong, R. D. & Bell, M. F. The active dissolution of zinc in alkaline solution.
Electroanal. Chem. & Interf. Electrochem. 55, 201-211 (1974).
[33] de Wit, J. H. W., & Lenderink, H. J. W. Electrochemical impedance spectroscopy as a tool to obtain mechanistic information on the passive behaviour of aluminium. Electrochim. Acta, 41(7-8), 1111-1119 (1996).
[34] Lnderink, H. J. W., Linden, M. V. D. & de Wit, J. H. W. Corrosion of aluminium in acidic and neutral solutions. Electrochim. Acta, 38(14), 1989-1992 (1993).
[35] Gudić, S., Radošević, J. & Kliškić, M. Study of passivation of Al and Al–Sn alloys in borate buffer solutions using electrochemical impedance spectroscopy. Electrochim. Acta, 47, 3009-3016 (2002).
[36] Han, J. The electrochemistry and dealloying of Zn-Mg/Zn-Al pure phases and their significance for corrosion of Zn-Al-Mg alloys. Ph.D. thesis, Chimie ParisTech (2018). [37] Epelboin, I., Keddam, M. & Lestrade, J. C. Faradaic impedances and intermediates in electrochemical reactions. Faraday Discuss. Chem. Soc. 56, 264-275 (1973).
[38] Annergren, I., Keddam, M., Takenouti, H. & Thierry, D. Modeling of the passivation
mechanism of Fe-Cr binary alloys from ac impedance and frequency resolved rrde-I. Behavior of Fe-Cr alloys in 0.5 M H2SO4. Electrochim. Acta, 41, 1121-1135 (1996).
[39] Stoulil, J. et al. Electrochemical properties of corrosion products formed on Zn-Mg, Zn-Al and Zn-Al-Mg coatings in model atmospheric conditions. Mat. & Corros. 66(8), 777-782 (2015). [40] Ogle, K. & Weber, S. Anodic dissolution of 304 stainless steel using atomic emission spectroelectrochemistry. J. Electrochem. Soc. 147(5), 1770-1780 (2000).
[41] Lodi, P., Ogle, K. & Storhaye, A. Méthode d’analyse d’un échantillon métallique par dissolution de sa surface, et dispositif pour sa mise en œuvre. Patent, 92-3782, France (1992).