HAL Id: hal-01570952
https://hal.archives-ouvertes.fr/hal-01570952
Submitted on 8 Aug 2017HAL is a multi-disciplinary open access
archive for the deposit and dissemination of sci-entific research documents, whether they are pub-lished or not. The documents may come from
L’archive ouverte pluridisciplinaire HAL, est destinée au dépôt et à la diffusion de documents scientifiques de niveau recherche, publiés ou non, émanant des établissements d’enseignement et de
Jules Morel
To cite this version:
Jules Morel. AN ANDROID APPLICATION TO VISUALIZE POINT CLOUDS AND MESHES IN VR. CGVCVIP 2017, Jul 2017, Lisbon, Portugal. �hal-01570952�
AN ANDROID APPLICATION TO VISUALIZE
POINT CLOUDS AND MESHES IN VR
Jules Morel
French Institute of Pondicherry, UMIFRE 21, India and LSIS, UMR 7296, Aix-Marseille University, France
ABSTRACT
This paper presents a review of well-known rendering techniques and their adaptation to the features of OpenGL ES 2.0 to develop an Android application dedicated to the visualization of surface meshes and point clouds in virtual reality.
KEYWORDS
Point clouds, surface meshes, Visualization, Virtual reality, Android application
1. INTRODUCTION
The increasing ease of use and popularity of 3D acquisition entails a wider use of digital representations. In order to visualize the point clouds acquired and their associated reconstructed surface, computer scientists and professionals rely on dedicated visualization tools using Oculus Rift or other similar virtual reality (VR) headsets. However, those devices are expensive and need to be powered by high end desktop PC. This paper presents an effective alternative to such costly virtual reality solutions: "LiDAR VR Viewer", an Android application, freely available on the Google Play Store, immersing the user into a virtual reality made of 3D point clouds and possibly reconstructed surfaces as mesh models. This paper builds upon well-known rendering techniques and describes how to adapt them to the features of OpenGL ES 2.0. This paper can also be seen as a literature review for scientists eager to implement a similar system.
2. DESIGN
The application has been developed following Android developer best practices proposed by Google. It is made of three different screens (called Activity among Android developers). After the splash screen, which proposes the download of a testing data-sets, the user sets up the parameters in the next activity, that is divided in sections. The Display section customizes the screen output and its behavior. It allows for instance to set up the rendering on the two sides of the screen in order to use the application with a head-mounted device for virtual reality purpose. Under the Point cloud section, one can set up the file containing the points and the parameters for their rendering such as their colors or sizes. Similarly, the colors and aspects of surface meshes are defined in the Surface section. The last section, Lightning, defines the shader used during the rendering. Once every settings have been chosen, one can proceed to the loading and rendering by clicking on the Rendering section. Actually the loading is done asynchronously and a format check on the file is performed.
3. FEATURES
The following sections give details on the main features we chose to implement in OpenGL shading language ( Kessenich, 2004, Rost, 2009) to improve the visualization while keeping a flowing experience. Actually, this was the main challenge: to provide an immersive experience through devices with low computing power.
3.1 Immersive Mode
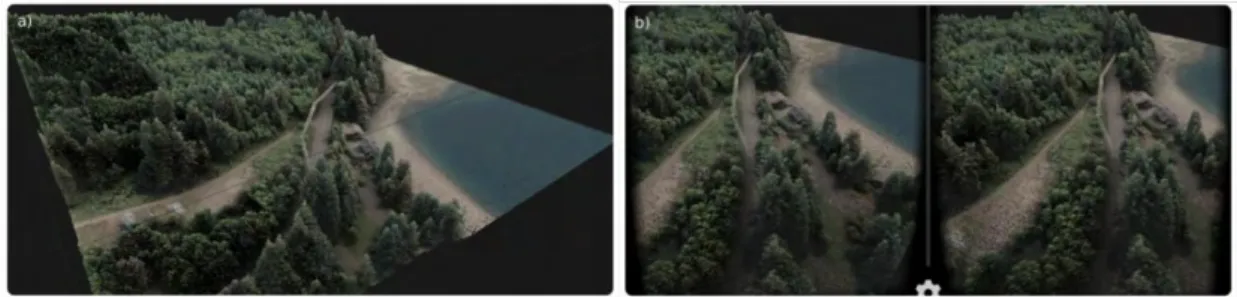
As shown on the Figure 1, the application proposes two rendering modes : 1a) a classic mode designed to be used without VR headset as a window on the world of the data, where the navigation is done by using the touchscreen, and 1b) an immersive mode dividing the screen in two parts, and designed to be used with a VR headset to reproduce the 3D effect with double-view stereo. In this mode, chromatic aberration and distortion induced by the lenses of the VR device are corrected.
Figure 1. Rendering in classic mode (a) and immersive mode (b) of an aerial LiDAR point cloud (2 million points)
3.2 Optimization of Buffers
The complexity of our scenes with millions of points and triangles on lightweight devices requires the use of vertex buffer objects. Instead of transferring vertex information from client memory at every frame, the information is transferred once and rendering is then performed directly from the graphics memory cache.
3.3 Points, Surfels and Surfaces Rendering
This section describes the methods implemented in the application to render points, surfaces and surfels.
3.3.1 Points Rendering
As the application has been designed to display heavy point clouds, such as the ones captured by 3D scanners, we focused on rendering efficiency. Indeed, provided the large size of handled point clouds and the double computation rendering for immersive mode (one for each eye), GPU cannot ran more than really simple shaders. With this in mind we kept the most simple vertex shader while allowing different processing in the fragment shader to propose the display of points, implemented as GL_POINTS, by squares, circles or spheres. By enabling point sprites, we get a special variable glPointCoord that can be read in the fragment shader and give the coordinates of the fragment in the square of the current point. To display a circle, we discard every fragment that falls outside of the in-scribed circle. To display spheres (illustrated in Figure 2), inspired by (Tarini, 2006), we draw them on the fly by relying on the concept of ray-traced impostors: we consider the square of the current point as a 2D frame always facing the user. We draw in that frame a virtual sphere which normal is assessed by relying on the symmetry of the sphere object.
3.3.2 Surfaces Rendering
To improve the rendering of surfaces, we shade them according to a partial Phong reflection model (Phong, 1975). As specular reflection needs several computations in the fragment shader, only ambient and diffuse reflection were implemented to keep a flowing experience on highly detailed models. Inspired by Cook and Torrance (Cook and Torrance, 1982), we implemented another lightning model (see Figure 3). This model, known to be closer to the physical reality, simulates the specular reflectance of different materials. The model treats each surface as consisting of many micro-facets: Very small facets that reflect the incoming light. On rough surfaces, the slopes of these micro facets vary greatly, and on smooth surfaces the micro-facets are oriented in a similar direction (Torrance and Sparrow, 1967).
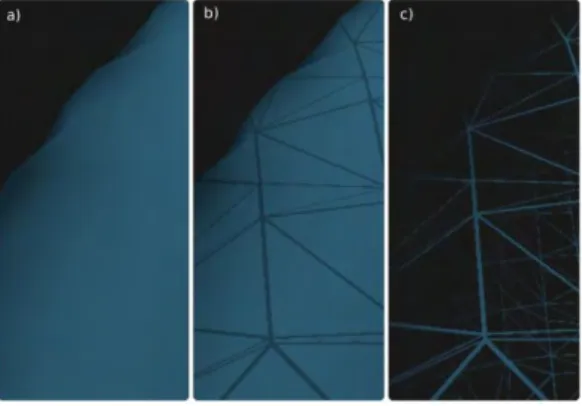
Finally, we propose a wire-frame view of the surfaces (see Figure 4) to improve visualization when transparency is required. Our procedure for wire-frame drawing is based on (Bærentzen, 2006). By providing the barycentric coordinates of the vertex to the fragment shader, we compute for each fragment the shortest distance to the edges of the polygon. Then, by setting a threshold on that distance and using alpha testing, triangles edges are drawn directly as a part of triangle rasterization, without resorting to line primitive, and so without any performance hit.
Figure 4. Close up on the rendering of mesh as smooth surface (a), as a surface with superimposed wireframe(b)
and as a only (c).
3.3.3 Surfels Rendering
At the interface between point cloud and surface resides the concept of surface elements (surfels) (Merl, 1994): able to render complex geometric objects, surfels are point primitive without explicit connectivity, represented as small disks oriented with the local normals. While using surfel to render object geometries, we transfer two costly tasks as pre-processing: (i) the re-sampling of the point cloud to limit the redundancy of geometric information at a given resolution and (ii) the computation of the normals. Inspired by (Gross and Pfister, 2011), we parameterize the screen-space square over [−r, r]2 , where r is the surfel radius.
For each of the pixel (x, y) in [−r, r]2 , a depth offset δ
z from the surfel center p is computed as a linear
function depending on the surfel normal vector n = [nx,ny,nz]T expressed in the camera space:
This depth offset is then used to compute the 3D distance from the surfel center: the pixel (x, y) corresponds to a point inside the surfel if . Otherwise,it is discarded. The quality of the model rendered rely on the expertise of the user and in the calibration of the pre-processing step: the point density and the surfels radius must match the expected output resolution of the image.
The upcoming developments on the surfel rendering will focus on the computation of the correct surfel radius. Currently, the splat-size is constant and set by the user. To estimate a correct radius dynamically, we propose to follow (Pajarola, 2003) approach in order to force the elliptical disks to cover the surface at all levels of details. That technique is related to a crucial improvement needing to be implemented: the optimization of the data to be loaded into the GPU according to the viewpoint, as presented by (Pauly, 2002).
Figure 3. Surface model enlightened by (a) partial Phong reflection model and (b) Cook-Torrance modeL
4. PERFORMANCE
4.1 Points Rendering Performance
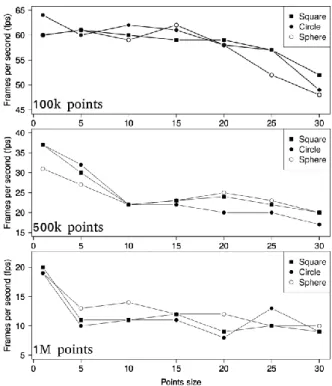
It is obvious that the smart-phones GPU can be strained when requested to display large point clouds. To detect potential bottlenecks in the rendering process, we relied on an average frame rate computation for point clouds loaded in the view frustum. Figure 5 shows an analysis of the performance on a Mali-T880 MP12 GPU with Exynos 8890 CPU system with a 1440 x 2560 pixels screen. It presents, for three point clouds of increasing size, the average frame-rate with respect to the size of the points displayed (variable gl_PointSize in the vertex shader). It highlights similar average frame rates for a given point cloud with a given point size for the three rendering modes of point primitives: squares, circles and spheres. This prove the efficiency of our fragment shader, whose extra computations do not induce frame-rate drop. Since the vertex shader has been kept the simplest possible for efficiency purpose, the bottleneck appears clearly in the data management on the CPU side: a level of detail approach is required to ease the GPU load on larger point cloud. The reader should note that the full point cloud is visible in the frustum view during this test. Moreover, the point size is kept as constant (gl_PointSize = u_Size in vertex shader). It is rarely the case in typical use: usually, only a portion of the point cloud is visible and the point size decreases with the depth (gl_PointSize = u_Size/gl_Position.w in vertex shader). In typical use, based on our experience and for the given hardware, users can explore point clouds with up to 2 million points while keeping a flowing experience.
Figure 5. Evolution of the Average Frame per Second Ratio with the Points Size
4.2 Surfaces Rendering Performance
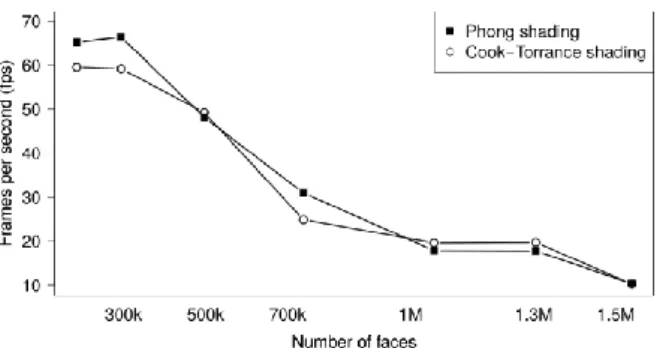
To analyze the impact of the shading effect on the surface rendering, we evaluated the average frame-rate for the display of meshes of increasing complexity. As shown in Figure 6, the application manages to render complex meshes of above one million of faces at a steady 20 frames per second, for both implemented shaders. This is more than satisfactory, given the screen resolution and pixel density of the targeted hardware.
Figure 6. Evolution of the Average Frame per Second
5. CONCLUSION
The optimization of the OpenGL rendering allows our application to maintain a descent frame-rate for well detailed 3D data on lightweight devices. The new trends in development and the evolution of the technology will lead to much better performance in the near future. Indeed, the upcoming generations of smart phones with more powerful GPU promises enhancement of this virtual reality experience. The current developments focus on implementing a level of details (LOD) approach for the data management. By following an octree division of the point clouds as introduced by (Pauly, 2002) and loading on GPU only the relevant part, we expect a huge boost in performance.
REFERENCES
Andreas Bærentzen, Steen L Nielsen, Mikkel Gjøl, Bent D Larsen, and Niels Jørgen Christensen. Single-pass wireframe rendering. In ACM SIGGRAPH 2006 Sketches, page 149, 2006.
Robert L Cook and Kenneth E. Torrance. A reflectance model for computer graphics. ACM Transactions on Graphics (TOG), 1(1):7–24,1982.
Markus Gross and Hanspeter Pfister. Point-based graphics. Morgan Kaufmann, 2011.
John Kessenich, Dave Baldwin, and Randi Rost. The opengl shading language. Language version, 1, 2004. Boston Merl. A survey and classification of real time rendering methods. 1994.
Renato Pajarola, Miguel Sainz, and Patrick Guidotti. Object-space blending and splatting of points. Information and Computer Science, University of California, Irvine, 2003.
Mark Pauly, Markus Gross, and Leif P Kobbelt. Efficient simplification of point-sampled surfaces.In Proceedings of the conference on Visualization’02, pages 163–170, IEEE Computer Society, 2002.
Bui Tuong Phong. Illumination for computer generated pictures. Communications of the ACM, 18(6):311–317,1975. Randi J Rost, Bill Licea-Kane, Dan Ginsburg, John M Kessenich, Barthold Lichtenbelt, Hugh Malan, and Mike Weiblen.
OpenGL shading language. Pearson Education, 2009.
Marco Tarini, Paolo Cignoni, and Claudio Montani. Ambient occlusion and edge cueing for enhancing real time molecular visualization. IEEE transactions on visualization and computer graphics, 12(5), 2006.
Kenneth E Torrance and Ephraim M Sparrow. Theory for off-specular reflection from roughened surfaces. JOSA, 57(9):1105–1112, 1967.