HAL Id: hal-00547705
https://hal.archives-ouvertes.fr/hal-00547705
Preprint submitted on 17 Dec 2010
HAL is a multi-disciplinary open access archive for the deposit and dissemination of sci-entific research documents, whether they are pub-lished or not. The documents may come from teaching and research institutions in France or abroad, or from public or private research centers.
L’archive ouverte pluridisciplinaire HAL, est destinée au dépôt et à la diffusion de documents scientifiques de niveau recherche, publiés ou non, émanant des établissements d’enseignement et de recherche français ou étrangers, des laboratoires publics ou privés.
Understanding how experts rate cigars: A
“havanometric” analysis
Nicolas Gérard Vaillant, François-Charles Wolff
To cite this version:
Nicolas Gérard Vaillant, François-Charles Wolff. Understanding how experts rate cigars: A “havano-metric” analysis. 2010. �hal-00547705�
EA 4272
Understanding how experts rate
cigars: A “havanometric” analysis
Nicolas Gérard Vaillant (*)
François-Charles Wolff (**)
2010/36
(*) LEM – Université Catholique de Lille (**) LEMNA - Université de Nantes
Laboratoire d’Economie et de Management Nantes-Atlantique Université de Nantes
Chemin de la Censive du Tertre – BP 52231 44322 Nantes cedex 3 – France www.univ-nantes.fr/iemn-iae/recherche Tél. +33 (0)2 40 14 17 19 – Fax +33 (0)2 40 14 17 49
D
o
cu
m
en
t
d
e
T
ra
va
il
W
o
rk
in
g
P
ap
er
Understanding how experts rate cigars:
A “havanometric” analysis
Nicolas Gérard Vaillant
*François-Charles Wolff
**November 2010
Abstract: Drawing on data from an annual French guidebook published in 2004, this paper
focuses on the determinants of experts’ ratings on Cuban cigars. We find that high quality cigars are more likely to be recommended to more experienced cigar lovers. Both the self-assessed quality and recommendation depend on the length and diameter of the cigars, but also on more subjective characteristics like number and type of aromas. Results from a Fields’ decomposition show that the quality of cigars is much more sensitive to the presence of a defect and number of aromas than the experts’ recommendation, which is more influenced by the rarity of cigars. Finally, it is essentially the cigars’ objective characteristics that have an influence on their prices, meaning that consumers truly benefit from additional qualitative information when reading experts’ advice and ratings.
JEL Classification: L15, L66, Z1
Keywords: Cigars, expert opinion, quality
*
Corresponding author. LEM (UMR 8179 CNRS) and the Université Catholique de Lille (FLSEG), 60 bd Vauban, BP109, 59016 Lille Cedex, France. E-mail : [email protected] http://ngvaillant.e-monsite.com/
**
LEMNA, Université de Nantes, BP52231 Chemin de la Censive du Tertre, 44322 Nantes Cedex; CNAV and INED, Paris, France.
1/ Introduction
Opinions and ratings from experts matter in many types of markets. A few recent studies have shown the significant impact of rankings in guidebooks on market outcomes. In the gastronomy sector, Gergaud et alii (2007) found that a star from the Michelin Guide
Rouge is associated with a high price premium, independent of the quality of foods1. In
addition, Chossat and Gergaud (2003) have shown that guide evaluations are not exclusively related to food quality. Restaurants have an incentive to invest in their setting (through the choice of their wines in their cellars among other things) to achieve higher marks from guides.
Hadj Ali et alii (2008) looked at the influence of Robert Parker oenological grades on
primeur wine prices using a natural experiment, the wine grades having been attributed after
the determination of prices in 2003. Their estimate of the Parker effect is about 2.8 Euros per bottle of wine. Using data from the Queen Elisabeth piano competition over the period 1952-1991, Ginsburgh and van Ours (2003) have shown that better rankings lead to more success, measured by the presence of recodes in different catalogues of music and by ratings from Belgian music critics2. This is puzzling as the order of appearance, which is randomly assigned, should have no influence on the judges’ ranking.
By definition, experts are expected to provide useful information on product quality to consumers, at a relatively low cost. However, one difficulty with the ratings they provide is that they sometimes mislead consumers and this affects the structure of the market itself as shown above. These results, along with those of Ashenfelter and Jones (2000) on the relationship between experts’ rating of wines and their prices, cast doubt on the ability of experts to make fully objective judgments. But do consumers really seek only objective information when reading a guidebook?
If one assumes that most of the more objective attributes of products are reflected in their prices, then it could be argued that consumers expect something else from experts, with more qualitative (and hence subsequently more subjective) information. Given the increasing availability of guidebooks and other consumer reports, which have a large audience, it is important to understand how experts form their opinions. In particular, how are they influenced by the intrinsic and extrinsic characteristics of products when giving their recommendation?
1
Results from a hedonic price equation show that being featured in the Michelin guide is associated to a price premium of 9%. The premium increases by 27% when a restaurant is awarded its first star.
2
Expert opinions also matter in art markets (Ginsburgh, 2003), sport betting markets (Avery and Chevalier, 1999) or in the stallion vaulting semen market (Vaillant et alii, 2010).
Many papers have relied on hedonic methods to measure both price and quality of wines (see among others Combris et alii, 1997, 2000, Landon and Smith, 1997, Lecocq and Visser, 2006). In this research, we focus on the complementary, albeit less explored, market of cigars. After a period of low demand during the second part of the 20th century, during recent years the cigar market has become much more attractive around the world . The global cigar and cigarillo market in 2006 was around 18 millions units, with a robust growth of premium cigars. The United States and four Western European countries (namely France, Germany, Spain and United Kingdom) account for about 96 percent of the global demand3.
An important feature that wines and cigars have in common is that their intrinsic quality cannot really be appreciated before purchase (Shapiro, 1983, Allen, 1984)4. Experts’ ratings should then be of the highest importance for the cigar market. To the best of our knowledge, so far only three studies have dealt with the estimation of hedonic price and quality equations of cigars (Stover, 1996, Freccia et alii, 2003, Livat and Vaillant, 2006). Our contribution then adds empirical evidence to the role of experts on cigar markets. Specifically, we attempt to measure the added-value of experts’ opinions on cigars with respect to the information included in price. Do consumers benefit from fresh information not reflected in the cigar’s price when reading the experts’ opinion?
To provide an answer to this question, we use data on Cuban cigars published in a French guidebook to study the determinants of experts’ ratings through an econometric analysis. Specifically, we investigate the quality grade measured on a five-point scale and the recommendation of the cigar to a particular group of smokers (all cigar smokers, experienced smokers, etc). We estimate hedonic rating functions, cigars being regressed on a set of characteristics attributes that are objective (diameter, length, handmade cigars) and on more subjective characteristics like strength, lighting, combustion or aromas among others. Drawing on decomposition techniques (Fields, 2003), we calculate the exact contribution of each explanatory variable when explaining variation in rating. We also perform a similar analysis with information on prices and study whether more subjective attributes have more influence on experts’ ratings than on prices.
Our results show that high quality cigars are, on average, recommended to more experienced cigar lovers. Grades on quality and recommendations depend on both the length
3
The per capita consumption is about 19 cigars in North America, while it is 17.7 in Western Europe. The per capita consumption is much lower (less than 1) in Latin America and Asia.
4
Both Landon and Smith (1998) in the area of wine and Vaillant and Livat (2006) in the area of cigars show that the reputation of products plays a substantial role in consumer decisions.
and diameter of the cigar, but also on more subjective characteristics like the presence of a defect or the number of aromas. Conversely, it is essentially the more objective characteristics of the cigars that influence their prices. Thus, our findings suggest that consumers truly benefit from additional qualitative information when reading experts’ advice and ratings.
The reminder of this paper is organized as follows. In the next Section, we briefly review the few economic papers dealing with cigars. The data that we use for our empirical analysis are described in Section 3. We comment on the results of our econometric analysis in Section 4. Finally, Section 5 concludes.
2/ Literature review
When turning to the specific field of cigar consumption, literature remains scarce. Most of the published contributions so far deal with health considerations. For instance, Vlachopulos et alii (2004) show that cigar smoking increases stiffness of large arteries. Using data from 1977 to 1984, Higgins et alii (1988) study the effect of pipe and cigar smoking on the risk of lung cancer, and find that cigar and pipe smokers experienced much lower lung cancer risks than cigarette smokers. However, Refs et alii (1982) highlight the irritant effects of cigars and note that cigar smoke produces similar responses to an unfiltered cigarette at the top of the tar and nicotine range. Cigars are not then a safe alternative to cigarettes. This is of interest as Delnevo et alii (2004) have recently shown that a rise in the cigarette excise tax was leading to some product substitution between cigarettes and cigars5.
To the best of our knowledge, only three papers have focused on hedonic equations related to either prices or quality of cigars. Using a data set of 380 cigars, Stover (1996) estimates a hedonic price index for premium cigars using OLS regressions. On average, cigars are more costly when they are longer, thicker, of higher quality and also when they are made in Cuba. Using an unbalanced sample of the cigars of the 32 Cuban brands commercialized in France covering the years 2000 (270 observations), 2001 (275 observations), 2002 (261 observations) and 2003 (237 observations), Livat and Vaillant (2006) estimate experts’ rating hedonic equations. They show that the quality of cigars is independent of their prices and is linked to their physical attributes. Furthermore, these objective characteristics play an increasing role over time and some brands are preferred by experts.
5
Delnevo et alii (2004) have found such product substitution in New Jersey using data from 2001 and 2002. The proportion of cigar smokers especially increases among males, whites, all cigarette smokers and those who have gone through higher education.
Freccia et alii (2003) account both for price and quality of cigars using data from the leading cigar rater (the Cigar Aficionado Magazine) over the 1992-1999 period. Using a sample of 689 cigars restricted to two cigar sizes (Coronas and Double Coronas), they show that there is a positive correlation between price and quality rating. However, rating explains only a small proportion of price variation and the overall correlation between price and quality tends to decrease over time. Finally, results from a hedonic price regression indicate that flavor dummies influence price less than objective characteristics like origin country6. When considering the determinants of ratings, a reverse pattern holds true since sensory characteristics are more significant than more objective features, with additional evidence of a bias of the judges against mild cigars.
3/ Description of the data
To study the determinants of cigars, we use a cross-sectional dataset collected from an annual guidebook published in France, the Havanoscope. The experts from Havanoscope tasted the 261 Cuban cigars commercialized in France in 2004.
The editor of the guidebook is Jean-Paul Kaufmann, a famous journalist in France. He explicitly takes on the subjectivity of experts and the fact that the evaluation is not conducted in blind tasting. In other words, because the experts know the cigar, it is possible that quality and recommendation reflect some sort of brand reputation. Unfortunately, the exact number and the personality of experts remain unknown. For each cigar, the Havanoscope provides three sets of information related to both objective and subjective characteristics respectively and to evaluations giving by the experts of the Havanoscope.
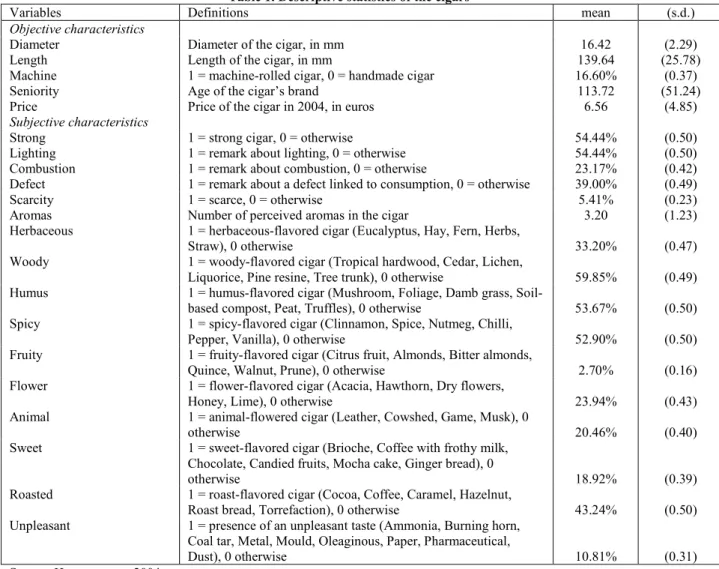
Let us first describe the more objective features of the cigars. According to the descriptive statistics provided in Table 1, the mean diameter of the cigar is about 1.64 centimeters and the mean length is 13.96 centimeters. There are large variations in cigar length, since the shortest and the longest ones respectively measure 9.8 and 23.5 centimeters. Among the Cuban cigars under consideration, 16.6% of them are machine-rolled. Most of them are thus handmade, a feature usually associated to the highest level of quality. Concerning the date of creation of cigars brands, about 65% have been launched before 1900.
6
In particular, the mean price of a cigar is much higher when the Cigar is made in Cuba, with a 7 dollar increase (Freccia et alii, 2003).
Only 15% of them have been produced after the Second World War. Finally, the mean price of a cigar is 6.56 Euros, with a median price of 5.5 Euros7.
Insert Table 1 here
The dataset includes several subjective characteristics related to the consumption of cigars. According to the experts of the Havanoscope, 54.4% of the cigars are considered as strong. A similar proportion of cigars (54.4%) is concerned with remarks about lighting, while remarks about consumption are less frequently reported (23.2%). Two other characteristics, which are likely to influence the final rating given by the experts, are respectively any remarks about a defect linked to consumption (in 39% of cases) and remarks about the scarcity of the cigars, which remains infrequent (5.4%)8.
The Havanoscope includes a detailed description of the aromas perceived by the experts (see Table 1). We choose to categorize these aromas using Houvenaghel’s classification (2005) and make a distinction between 10 aromas. The mean number of perceived aromas in a cigar is 3.2. About 6% of the cigars are characterized by only one aroma, while 35% of them have at least four aromas. Woody, humus, spicy, and roasted are the most frequently reported aromas in our database, respectively 59.85%, 53.67%, 52.90% and 43.24%. A few cigars (10.81%) are perceived as having an unpleasant aroma.
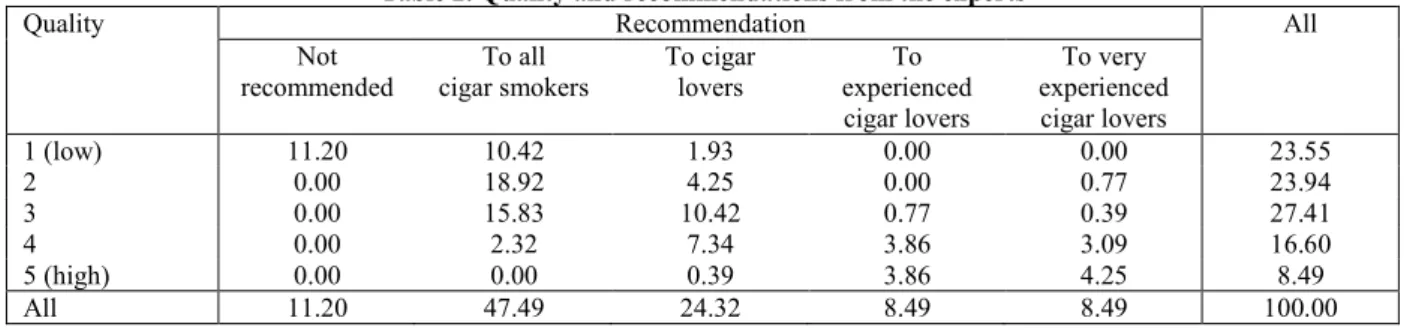
We now turn to the quality evaluation and recommendations formulated by the experts of the cigar guidebook. The Havanoscope provides the two following indicators. The first one is a mark given to the cigar, which is a measure of its quality. The experts’ rating ranges from 1 “ring” (low-quality) to 5 “rings” (high-quality), the mean mark related to quality being 2.62. As shown in Table 2, only a few Cuban cigars are considered as being of high quality, since only 8.5% have the highest mark and 16.6% have the grade of 4. About 47.5% of the cigars are of low quality, with a mark of either 1 or 2.
Insert Table 2 here
Experts complete their mark with a recommendation since they indicate to which category of consumers each cigar seems the most appropriate. Again, the recommendations are distributed according to an ordered scale with five categories. The worst category is related to cigars that are not recommended to smokers. Then, four kinds of consumers are distinguished, on the basis of their experience in cigars smoking. According to the data, 11.2% of the cigars are not recommended, while 47.5% are recommended to all cigar
7
About 20 percent of the cigars exceed 10 Euros, the highest price in our database being 28 Euros (the most expensive cigar being the Monte Cristo A).
8
smokers. In fact, very high recommendations are not frequent since the top two categories (respectively experienced cigar lovers and very experienced cigar lovers) concern only 17% of the consumers as shown in Table 2.
On a priori grounds, there is no reason for experts to recommend better cigars to more experienced consumers. Simple calculations show that this is absolutely not the case. Treating both the experts’ rating and recommendation as continuous outcomes, we find a very high value for the corresponding correlation coefficient (0.741), which is significant at the one percent level. Therefore, a high mark awarded to a cigar is more often associated with a high recommendation from the experts, as clearly shown in Table 2. For instance, cigars not recommended by the experts are all in the lowest quality category. Among cigars recommended to cigar lovers, 75% of them are at least of medium quality (with a mark of 3 and above) and about 90% of the cigars recommended to experienced or very experienced cigar lovers are characterized by a quality of four or five.
This first interesting result suggests that experts explicitly consider cigars as experience goods, i.e. goods whose true quality cannot be known before consumption. As a consequence, the utility derived from the consumption of the cigar cannot perfectly be known before smoking. According to the experts from Havanoscope, one defective product on 25 is an acceptable frequency. Furthermore, from the expert point of view, an inexperienced cigar smoker should not be able to know what a good cigar is. This finding is somewhat puzzling as one expects that information provided in guidebook concerns not only experienced consumers (defined as consumers who already benefit from their own experience).
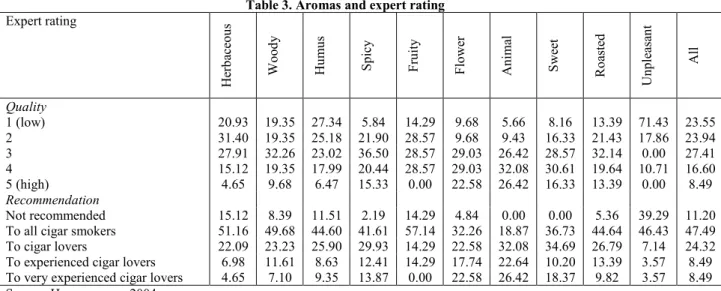
The data finally allow us to understand how the recommendations formulated by experts depend on the characteristics of the cigar. For the sake of illustration, in what follows we focus on the role of aromas on both the self-reported quality and the recommendation.
Descriptive statistics reported in Table 3 suggest that experts have strong preferences for specific aromas. A first expected finding is that cigars featuring an unpleasant taste are much more likely to be not recommended (39.3%) or recommended to every cigar smoker (46.4%). The same pattern holds when considering the self-rated quality, since 71.4% of the cigars characterized by an unpleasant taste are evaluated as being of the lowest quality. A second result is that both recommendation and quality are positively influenced by the same aromas. On average, flower-, animal-, sweet- and spicy-flavored cigars benefit from a higher evaluation from experts. Conversely, woody- (which is the most common aroma) and
herbaceous-flavored cigars are more often recommended to every cigars smoker and are assessed as being of low or medium quality.
Insert Table 3 here
To further investigate the role of both the objective and subjective cigar characteristics on the experts’ opinions, we now turn to an econometric analysis. We are not only interested in knowing which factors significantly influence the levels of quality and recommendation provided by the cigar guidebook, but we also attempt to quantify the influence of each cigars characteristic on the experts’ ratings. Finally, we compare these contributions to those obtained from a hedonic cigar price equation.
4/ An econometric analysis of experts’ rating
4.1/ A bivariate ordered Probit model of recommendation and quality
The first step of our analysis is to understand the determinants of both the levels of recommendation and quality formulated by experts in the guidebook. Let Ym* be a latent, unobserved variable corresponding to a mark given by an expert to a cigar. The mark may be related either to recommendation (m r) or to quality (m q). Each opinion from the expert is expected to depend on a set of exogenous characteristics X , assumed to be the same for both recommendation and quality. By definition, we only observe the ordered indicators Yr
(Yr 1,...,5) and Yq (Yq 1,...,5) in the database.
We use a bivariate ordered Probit model, which is made up of two equations that are jointly estimated. The first one refers to recommendation, while the second one corresponds to the quality level. The bivariate model may be expressed as:
q q q r r r X Y X Y ' ' * * (1)
with Yr j when r,j Yr* r,j 1 and j 1,...,5, Yq k when q,k Yq* q,k 1 and 5
,..., 1
k . We assume that r,1 , r,6 , q,1 and q,6 . The various r,j and q,j are a set of threshold parameters that have to be estimated jointly with the parameters r and q. Finally, we assume that the random disturbances r and q follow a bivariate normal distribution with variances equal to one and an unknown coefficient correlation to be estimated.
j k ri qi ri qi
i D(Y j,Y k)Pr(Y j,Y k)
ln 1 (2)
with Pr(Yri j,Yqi k) Pr( r,j Yri* r,j 1, q,k Yqi* q,k 1) and where D1(Yri j,Yqi k) is equal to one when Yri j and Yqi k and 0 otherwise. Each term Pr(YLi j,YFi k) may be expressed as a sum of four terms involving the bivariate standard normal cumulative distribution function 2(.). The log likelihood of the total sample is
i i
L
ln and the
corresponding model is estimated by a maximum likelihood method. Note that (2) is a seemingly unrelated specification, meaning that no exclusion restriction is needed to identify the parameters in the bivariate ordered model.
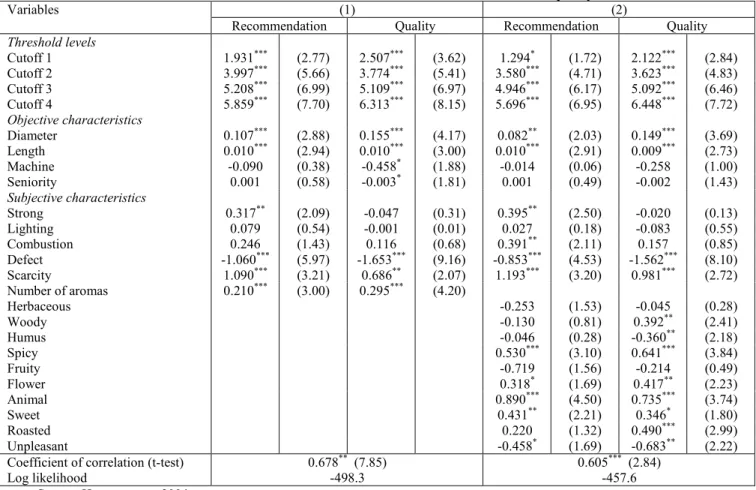
The different covariates introduced in the regression are diameter and length, whether the cigar is machine made, seniority, any remarks about strength, lighting, combustion, defects, and rarity. Concerning aromas, we estimate two different sets of regressions. In the first specification, we only account for the number of aromas in the cigar, while in the second specification we include a set of flavor dummies. Results of the bivariate ordered Probit models are presented in Table 4.
Insert Table 4 here
A few objective and subjective characteristics (respectively age of the cigar’s brand and remarks about lighting and combustion) have no significant effect on quality, nor on recommendation, except in the recommendation equation with controls for the aromas dummies. In that case, experts are more likely to recommend cigars with good combustion. The fact that cigars are machine-made only affects quality, but the negative relationship is only significant at the 10 percent level. This is surprising, insofar as a handmade cigar consists of the filler, the binder to hold the filler, and the outer wrapper, all consisting of 100% tobacco. Conversely, the filler in machine-made cigars is not 100% tobacco and such cigars frequently have defects in their appearance (diameter or length are not constant).
The two other objective characteristics, diameter and length, have a positive and significant impact on recommendation and quality. As expected, experts give a higher rating to both larger and longer cigars, but the diameter coefficient is much higher than the length coefficient. In other words, a “chubby” cigar is viewed as a better cigar than a long one. Nevertheless, in some circumstances, it may present the advantage of being less time consuming, especially for beginner smokers. This could explain why the difference in the diameter and length coefficients is smaller for recommendation than for quality.
According to the data, the presence of an explicit defect in the cigar strongly reduces its quality level evaluation. A similar effect, albeit of a slightly smaller magnitude, is found with the recommendation level. It is interesting to note that the difficulty of finding a cigar is assessed both in the recommendation and quality equations. An interpretation could deal with snobbism (Corneo and Jeanne, 1997) if experts tend to favor cigars that are more difficult to find in a cigar shop. At the same time, the remark on scarcity may simply be due to the fact that these cigars are relatively more in demand, which should be the case if they are of high quality. The strength of the cigar has a positive effect only in the recommendation equation. Strong cigars are not systematically better in terms of quality, but according to experts, only experienced smokers are able to enjoy this characteristic.
Finally, there is a positive relationship between the number of aromas and quality and aromatic cigars are more likely to be recommended by experts. Results in Table 4 show that herbaceous and fruity cigars are not significantly higher rated, nor recommended. While the woody, roasted and humus dummies have no effect on recommendation, the woody and roasted flavors improve quality. Conversely, humus flavor (which is the most common aroma among low quality cigars) sounds more like a negative characteristic. Unpleasant cigars are logically penalized and not recommended, whereas sweet, flowered, spicy and animal features are positively related to both quality and recommendation.
Interestingly, our results on the impact of the aroma statements are very similar to those described in Freccia et alii (2003). With cigars from different countries of origin, these authors show that sensory characteristics strongly influence ratings. We get very similar results with our subsample of Cuban cigars, with the same positive correlation between ratings and spicy, sweet and woody flavors. A more original result, specific to our study, is that the various flavors do not have exactly the same influence on ratings and on recommendation. This is the case for the woody and humus aromas, with respectively positive and negative effects on ratings, but insignificant impact on recommendation.
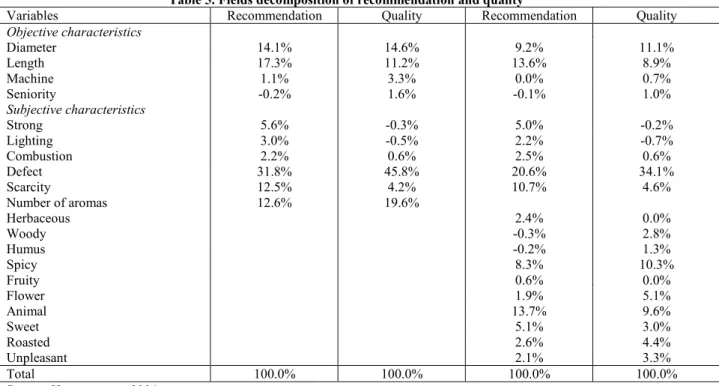
4.2/ Assessing the contributions of cigars’ characteristics to ratings
We now attempt to assess the respective influence of the various cigars’ characteristics on the experts’ ratings. The idea is to know, for instance, whether the diameter and length of the cigars are more influential when explaining either recommendation or quality. In the context of linear models estimated through OLS, the decomposition methodology proposed in
Fields (2003) provides a simple way of measuring the role of each covariate when explaining a given outcome. Let us briefly present the methodology.
For that purpose, we consider the following linear model Ym mX m. Suppose that there are N exogenous regressors in X , indexed by n (with n 1,...,N). Then, the variance of the dependent variable Ym may be decomposed in the following way:
) , cov( ) , cov( ) var( m m n m n m m X Y Y Y (3)
We then deduce the relative contribution of each covariate and the residual from: % 100 ) ( ) ( m ns Xn s (4)
with s(Xn) cov( mXn,Ym)/var(Ym) and s( m) cov( m,Ym)/var(Ym). The first term on the left-hand side of (4) is equal to the R², meaning that s(Xn) indicates the weight of each regressor on the variable of interest Ym.
A difficulty in our context is that both recommendation and quality are ordered indicators, so that they cannot be treated as continuous outcomes. We thus turn to the technique of simulated residuals described in Gouriéroux et alii (1987) to get continuous outcomes Yrc and Yqc respectively from Yr and Yq. We proceed in the following way. First, using two separate ordered Probit regressions, we get consistent estimates for both the parameters of interest ˆ and r ˆ and the threshold values q ˆr,j and ˆq,j9. Then, for each cigar i , we draw random terms ri and qi in the normal density function respectively for recommendation and quality till the following conditions hold:
1 , , ˆ ' ˆr j ri Xi ri r j (5) 1 , , ˆ ' ˆq j qi Xi qi q j (6)
For each cigar, the continuous proxy of the latent variables measuring recommendation and quality are respectively given by Yric ˆri'Xi ri and Yqic ˆqi'Xi qi. As a final step, we turn to OLS regressions to explain both c
ri
Y and c ri
Y as a function of the selected covariates and apply the basic Fields decomposition to get the relative weight of each covariate on the experts’ rating. The corresponding results are in Table 5.
Insert Table 5 here
9
We neglect here the correlation between the residuals of the two outcomes. Estimates from the independent ordered regressions are very similar to those from the bivariate model. Results are available upon request.
According to the dataset, the most influential factor both in the recommendation and quality equations is the presence of a defect. When the cigar has a defect, this explains respectively 31.8% and 45.8% of the variation in recommendation and in quality. The role of diameter and length is also important when explaining both outcomes. The contribution of these physical characteristics is equal to 31.4% for recommendation and 25.8% for quality. While experts put more emphasis on diameter than on length for quality (14.6% instead of 11.2%), the reverse pattern holds for quality.
The influence of the other objective characteristics (machine made cigar, age of the cigar’s brand) is more modest, as well as lighting, combustion and, to a lower extent, strength in the recommendation equation (about 5%). An interesting result of Table 5 is that the difficulty of finding a cigar has a much higher weight in the recommendation equation (12.5%) than in the quality equation (4.2%), reinforcing the hypothesis of experts’ snobbism. Finally, the number of aromas account for about 19.6% of the variation in quality, and 12.6% of the variation in recommendation. For both ratings, the most influential aromas in quality are spicy and animal.
4.3/ Insights from a hedonic price equation
We now turn to a hedonic price equation. Our concern here is to know whether the various cigars’ characteristics have the same influence on both the experts’ rating and price. Considering the log of the cigar price as dependent variable, we estimate OLS regressions to explain the price level. The corresponding estimates are shown in Table 6.
Insert Table 6 here
A first finding is that the explanatory variables playing a role in the price equation are not systematically the same than those previously having an influence in the quality and recommendation equations. In other words, information revealed in the hedonic price function is adequately completed with information revealed by experts. From Table 6, we note that subjective characteristics like strength, lighting and combustion do have a significant influence on the price level. This is also the case for the various aromas, except for the animal and sweet flavors whose presence in a cigar increases its price by 17.4% and 15.7%. In the same way, the most aromatic cigars are more costly, but the effect of each further aroma on price remains somewhat low (+4.5%).
We also include the contribution of each covariate from a Fields decomposition in Table 6. The contribution of the number of aromas is equal to 4.5% in the price equation, but
the corresponding weight was much higher in the recommendation (12.6%) and quality (19.6%) equations. This suggests that experts devote more importance to the subjective characteristics of the cigar compared to the market, which is precisely what consumers expect from a guidebook. This result is reinforced by the fact that both diameter and length of the cigars have a much higher weight in the price equations. These two factors explain more than 45% of the variation in price.
Another influent objective characteristic is whether the cigar is handmade or not. When the cigar is machine-rolled, its price is reduced by 83.6% and this is the most influential factor (about 34%) when explaining price. The presence of a defect and the difficulty of finding a cigar have a significant impact on the price level. On the one hand, the price is reduced by 21.6% when the cigar has a defect. On the other hand, scarce cigars are more costly, with a 35% increase in price. Nevertheless, it should be noted that the weight of these two covariates is much smaller in the price equation (respectively 7.2% for defects and 4.1% for scarcity) than in the experts’ rating equations.
A last comment about our price regressions is that we get high values of R². According to Table 6, the selected covariates explain a large part of the variation of the dependent variable (around 75%). This seems higher than the other empirical estimates in the cigar market. For instance, estimates from hedonic real price equations reported in Freccia et alii (2003, p. 182) lead to a R² equal to 0.583. An explanation of the gap could be that we consider a much more homogeneous sample since we only consider cigars from Cuban. Conversely, Freccia et alii (2003) draw on data from the Cigar Aficionado Magazine and they include cigars from 14 different countries, 68.9% of them coming from Dominican Republic and Honduras.
5/ Concluding comments
The purpose of our empirical study was to provide insights on the determinants of both quality and price of cigars using data from the Havanoscope, an annual French guidebook. Our main results are twofold.
First, the experts’ ratings on quality and recommendation depend on both objective and subjective characteristics of the cigars like length, diameter, or number and types of aromas. As previously shown in Chossat and Gergaud (2003) on the gastronomy market and in Freccia et alii (2003) and Livat and Vaillant (2006) on the cigar market, experts facilitate the discovering and choice of this experience good. Furthermore, consumers truly benefit
from additional qualitative information when reading experts’ advice and ratings. Secondly, experts are likely to recommend high quality cigars to more experienced cigar lovers. This proves that experts are not substitutes to experience for experience goods, and they are thus useful to consumers that need less information.
A limitation of our study is that we do not investigate the relationship between cigar’s price and experts’ rating, either for recommendation or quality. However, since our sample is a cross-section of cigars, we would only be able to document the correlation between price and rating, while it is certainly important to comment on causality issues. On the one hand, the ratings formulated by experts may lead to an increase in price if better-evaluated cigars are in higher demand (an expert premium). On the other hand, experts may be tempted to interpret the price of a cigar as a sign of its quality, thereby systematically giving higher marks to more costly cigars.
Finally, several extensions of our work may come to mind. Firstly, it would be worthwhile to collect longitudinal data in order to estimate hedonic price and quality equations net of unobserved heterogeneity. For instance, this would give the opportunity to study the persistence of quality over time and the possible influence of adverse climatic shocks on the production of cigars. Secondly, it would be of interest to extend our analysis to the whole market of cigars in order to include cigars from other major countries producing cigars like Jamaica, Bahamas, Dominican Republic, Honduras, Nicaragua, Costa Rica, Ecuador or Brazil. We leave all these issues for future research.
References
Allen F., (1984), ‘Reputation and product quality’, RAND Journal of Economics, vol. 15, pp. 311-327.
Ashenfelter O., Jones G., (2000), ‘The demand for expert opinions: Bordeaux Wine’, Les
Cahiers Scientifiques de l’Observations des Conjonctures Vinicoles Européennes, vol. 3,
pp. 1-17.
Avery C., Chevalier J., (1999), ‘Identifying investor sentiment from price paths: the case of football betting’, Journal of Business, vol. 72, pp. 493-521.
Chossat V., Gergaud O., (2003), ‘Expert opinion and gastronomy: The recipe for success’,
Journal of Cultural Economics, vol. 27, pp. 127-141.
Combris, P., Lecocq S., Visser M., (1997), ‘Estimation of a hedonic price equation for Bordeaux wine: Does quality matter ?’, Economic Journal, vol. 107, pp. 309-402.
Combris P., Lecocq S., Visser M., (2000), ‘Estimation of a hedonic price equation for Burgundy wine’, Applied Economics, vol. 32, pp. 961-967.
Corneo G., Jeanne O., (1997), ‘Conspicuous consumption, snobbism and conformism’,
Journal of Public Economics, vol. 66, pp. 55-71.
Delnevo C. D., Hrywna M., Foulds J., Steinberg M. B., (2004), ‘Cigar use before and after a cigarette excise tax increase in New Jersey’, Addictive Behaviors, vol. 29, pp. 1799-1807. Fields G., (2003), ‘Accounting for income inequality and its change: A new method, with
application to the distribution of earnings in the United States’, Research in Labor
Economics, vol. 22, pp. 1-38.
Freccia D.M., Jacobsen J.P., Kilby P., (2003), ‘Exploring the relationship between price and quality for the case of hand-rolled cigars’, Quarterly Review of Economics and Finance, vol. 43, pp. 169-189.
Gergaud O., Guzman L.M., Verardi V., (2007), ‘Stardust over Paris gastronomic restaurants’,
Journal of Wine Economics, vol. 2, pp. 24-39.
Ginsburgh V., (2003), ‘Awards, success and aesthetic quality in the arts’, Journal of
Economic Perspectives, vol. 17, pp. 99-111.
Ginsburgh V., Van Ours J.C., (2003), ‘Expert opinion and compensation : Evidence from a musical competition’, American Economic Review, vol. 93, pp. 289-298.
Gouriéroux C., Monfort A., Renault E., Trognon A., (1987), ‘Simulated residuals’, Journal of
Econometrics, vol. 34, pp. 201-252.
Hadj Ali H., Lecocq S., Visser M., (2008), ‘The impact of gurus: Parker grades and en primeur wine prices’, Economic Journal, vol. 118, pp. F158-F173.
Higgins I. T. T., Mahan C. M., Wynder E. L., (1988), ‘Lung cancer among cigar and pipe smokers’, Preventive Medicine, vol. 17, pp. 116-128.
Houvenaghel D., (2005), Le cigare – De la culture à l’art, Editions du Gerfaut.
Landon S., Smith C.E., (1997), ‘The use of quality and reputation indicators by consumers: the case of Bordeaux wine’, Journal of Consumer Policy, vol. 20, pp.289-323.
Landon S., Smith C.E., (1998), ‘Quality expectations, reputation, and price’, Southern
Economic Journal, vol. 64, pp. 628-647.
Lecocq S., Visser M., (2006), ‘What determines wine prices: Objective vs. sensory characteristics’, Journal of Wine Economics, vol. 1, pp. 42-56.
Livat F., Vaillant N.G., (2006), ‘Expert opinion and brand reputation : An analysis from a French Cuban cigars Guidebook’, Applied Economics Letters, vol. 13, pp. 97-100.
Refs P.J., Chowienczyk P.J., Ayres J.G., Clark T.J.H., (1982), ‘Irritant effects of cigarette and cigar smoke’, The Lancet, vol. 320, pp. 1015-1017.
Shapiro C., (1983), ‘Premiums for high quality products as returns to reputations’, Quarterly
Journal of Economics, vol. 98, pp. 659-679.
Stover M.E., (1996), ‘An hedonic price index for premium cigars’, Journal of Economics, vol. 22, pp. 63-73.
Vaillant N.G., Lesot P., Bonnard Q., Harrant V., (2010), ‘The use of expert opinion, quality and reputation indicators by consumers: Evidence from the French vaulting stallion semen market’, Applied Economics, vol. 42, pp. 739-745.
Vlachopoulos C., Alexopoulos N., Panagiotakos D., O’Rourke M.F., Stefanadis C., (2004), ‘Cigar smoking has an acute detrimental effect on arterial stiffness’, American Journal of
Table 1. Descriptive statistics of the cigars
Variables Definitions mean (s.d.)
Objective characteristics
Diameter Diameter of the cigar, in mm 16.42 (2.29)
Length Length of the cigar, in mm 139.64 (25.78)
Machine 1 = machine-rolled cigar, 0 = handmade cigar 16.60% (0.37)
Seniority Age of the cigar’s brand 113.72 (51.24)
Price Price of the cigar in 2004, in euros 6.56 (4.85)
Subjective characteristics
Strong 1 = strong cigar, 0 = otherwise 54.44% (0.50)
Lighting 1 = remark about lighting, 0 = otherwise 54.44% (0.50)
Combustion 1 = remark about combustion, 0 = otherwise 23.17% (0.42)
Defect 1 = remark about a defect linked to consumption, 0 = otherwise 39.00% (0.49)
Scarcity 1 = scarce, 0 = otherwise 5.41% (0.23)
Aromas Number of perceived aromas in the cigar 3.20 (1.23)
Herbaceous 1 = herbaceous-flavored cigar (Eucalyptus, Hay, Fern, Herbs,
Straw), 0 otherwise 33.20% (0.47)
Woody 1 = woody-flavored cigar (Tropical hardwood, Cedar, Lichen,
Liquorice, Pine resine, Tree trunk), 0 otherwise 59.85% (0.49)
Humus 1 = humus-flavored cigar (Mushroom, Foliage, Damb grass,
Soil-based compost, Peat, Truffles), 0 otherwise 53.67% (0.50)
Spicy 1 = spicy-flavored cigar (Clinnamon, Spice, Nutmeg, Chilli,
Pepper, Vanilla), 0 otherwise 52.90% (0.50)
Fruity 1 = fruity-flavored cigar (Citrus fruit, Almonds, Bitter almonds,
Quince, Walnut, Prune), 0 otherwise 2.70% (0.16)
Flower 1 = flower-flavored cigar (Acacia, Hawthorn, Dry flowers,
Honey, Lime), 0 otherwise 23.94% (0.43)
Animal 1 = animal-flowered cigar (Leather, Cowshed, Game, Musk), 0
otherwise 20.46% (0.40)
Sweet 1 = sweet-flavored cigar (Brioche, Coffee with frothy milk,
Chocolate, Candied fruits, Mocha cake, Ginger bread), 0
otherwise 18.92% (0.39)
Roasted 1 = roast-flavored cigar (Cocoa, Coffee, Caramel, Hazelnut,
Roast bread, Torrefaction), 0 otherwise 43.24% (0.50)
Unpleasant 1 = presence of an unpleasant taste (Ammonia, Burning horn,
Coal tar, Metal, Mould, Oleaginous, Paper, Pharmaceutical,
Dust), 0 otherwise 10.81% (0.31)
Table 2. Quality and recommendations from the experts
Quality Recommendation All
Not recommended To all cigar smokers To cigar lovers To experienced cigar lovers To very experienced cigar lovers 1 (low) 11.20 10.42 1.93 0.00 0.00 23.55 2 0.00 18.92 4.25 0.00 0.77 23.94 3 0.00 15.83 10.42 0.77 0.39 27.41 4 0.00 2.32 7.34 3.86 3.09 16.60 5 (high) 0.00 0.00 0.39 3.86 4.25 8.49 All 11.20 47.49 24.32 8.49 8.49 100.00 Source: Havanoscope, 2004.
Table 3. Aromas and expert rating Expert rating H er b ac eo u s W o o d y H u m u s S p ic y F ru it y F lo w er A n im al S w ee t R o as te d U n p le as an t A ll Quality 1 (low) 20.93 19.35 27.34 5.84 14.29 9.68 5.66 8.16 13.39 71.43 23.55 2 31.40 19.35 25.18 21.90 28.57 9.68 9.43 16.33 21.43 17.86 23.94 3 27.91 32.26 23.02 36.50 28.57 29.03 26.42 28.57 32.14 0.00 27.41 4 15.12 19.35 17.99 20.44 28.57 29.03 32.08 30.61 19.64 10.71 16.60 5 (high) 4.65 9.68 6.47 15.33 0.00 22.58 26.42 16.33 13.39 0.00 8.49 Recommendation Not recommended 15.12 8.39 11.51 2.19 14.29 4.84 0.00 0.00 5.36 39.29 11.20
To all cigar smokers 51.16 49.68 44.60 41.61 57.14 32.26 18.87 36.73 44.64 46.43 47.49
To cigar lovers 22.09 23.23 25.90 29.93 14.29 22.58 32.08 34.69 26.79 7.14 24.32
To experienced cigar lovers 6.98 11.61 8.63 12.41 14.29 17.74 22.64 10.20 13.39 3.57 8.49
To very experienced cigar lovers 4.65 7.10 9.35 13.87 0.00 22.58 26.42 18.37 9.82 3.57 8.49
Table 4. Bivariate ordered Probit estimates of recommendation and quality
Variables (1) (2)
Recommendation Quality Recommendation Quality
Threshold levels Cutoff 1 1.931*** (2.77) 2.507*** (3.62) 1.294* (1.72) 2.122*** (2.84) Cutoff 2 3.997*** (5.66) 3.774*** (5.41) 3.580*** (4.71) 3.623*** (4.83) Cutoff 3 5.208*** (6.99) 5.109*** (6.97) 4.946*** (6.17) 5.092*** (6.46) Cutoff 4 5.859*** (7.70) 6.313*** (8.15) 5.696*** (6.95) 6.448*** (7.72) Objective characteristics Diameter 0.107*** (2.88) 0.155*** (4.17) 0.082** (2.03) 0.149*** (3.69) Length 0.010*** (2.94) 0.010*** (3.00) 0.010*** (2.91) 0.009*** (2.73) Machine -0.090 (0.38) -0.458* (1.88) -0.014 (0.06) -0.258 (1.00) Seniority 0.001 (0.58) -0.003* (1.81) 0.001 (0.49) -0.002 (1.43) Subjective characteristics Strong 0.317** (2.09) -0.047 (0.31) 0.395** (2.50) -0.020 (0.13) Lighting 0.079 (0.54) -0.001 (0.01) 0.027 (0.18) -0.083 (0.55) Combustion 0.246 (1.43) 0.116 (0.68) 0.391** (2.11) 0.157 (0.85) Defect -1.060*** (5.97) -1.653*** (9.16) -0.853*** (4.53) -1.562*** (8.10) Scarcity 1.090*** (3.21) 0.686** (2.07) 1.193*** (3.20) 0.981*** (2.72) Number of aromas 0.210*** (3.00) 0.295*** (4.20) Herbaceous -0.253 (1.53) -0.045 (0.28) Woody -0.130 (0.81) 0.392** (2.41) Humus -0.046 (0.28) -0.360** (2.18) Spicy 0.530*** (3.10) 0.641*** (3.84) Fruity -0.719 (1.56) -0.214 (0.49) Flower 0.318* (1.69) 0.417** (2.23) Animal 0.890*** (4.50) 0.735*** (3.74) Sweet 0.431** (2.21) 0.346* (1.80) Roasted 0.220 (1.32) 0.490*** (2.99) Unpleasant -0.458* (1.69) -0.683** (2.22)
Coefficient of correlation (t-test) 0.678** (7.85) 0.605*** (2.84)
Log likelihood -498.3 -457.6
Source: Havanoscope, 2004.
Note: Maximum likelihood estimates from bivariate ordered Probit models. Absolute values of t-statistics are in parentheses, significance levels being respectively 1% (***), 5% (**) and 10% (*).
Table 5. Fields decomposition of recommendation and quality
Variables Recommendation Quality Recommendation Quality
Objective characteristics Diameter 14.1% 14.6% 9.2% 11.1% Length 17.3% 11.2% 13.6% 8.9% Machine 1.1% 3.3% 0.0% 0.7% Seniority -0.2% 1.6% -0.1% 1.0% Subjective characteristics Strong 5.6% -0.3% 5.0% -0.2% Lighting 3.0% -0.5% 2.2% -0.7% Combustion 2.2% 0.6% 2.5% 0.6% Defect 31.8% 45.8% 20.6% 34.1% Scarcity 12.5% 4.2% 10.7% 4.6% Number of aromas 12.6% 19.6% Herbaceous 2.4% 0.0% Woody -0.3% 2.8% Humus -0.2% 1.3% Spicy 8.3% 10.3% Fruity 0.6% 0.0% Flower 1.9% 5.1% Animal 13.7% 9.6% Sweet 5.1% 3.0% Roasted 2.6% 4.4% Unpleasant 2.1% 3.3% Total 100.0% 100.0% 100.0% 100.0% Source: Havanoscope, 2004.
Table 6. Prices estimates of cigars
Variables (1) (2)
coef t-test Fields % coef t-test Fields %
Constant -1.119*** (4.31) -1.055*** (3.91) Objective characteristics Diameter 0.101*** (7.06) 23.7% 0.101*** (6.72) 23.2% Length 0.009*** (7.00) 23.4% 0.009*** (6.80) 22.0% Machine -0.836*** (9.43) 34.0% -0.785*** (8.73) 31.2% Seniority -0.001** (2.55) 2.5% -0.001** (2.29) 2.2% Subjective characteristics Strong 0.039 (0.67) 0.6% 0.042 (0.73) 0.6% Lighting -0.041 (0.72) -0.4% -0.048 (0.84) -0.5% Combustion 0.058 (0.88) 0.5% 0.040 (0.59) 0.3% Defect -0.216*** (3.42) 7.2% -0.162** (2.44) 5.3% Scarcity 0.350*** (2.66) 4.1% 0.398*** (2.89) 4.5% Number of aromas 0.045* (1.68) 4.5% Herbaceous -0.002 (0.03) 0.0% Woody 0.086 (1.44) 1.2% Humus -0.100 (1.65) 0.5% Spicy 0.042 (0.67) 1.1% Fruity -0.033 (0.20) 0.0% Flower -0.021 (0.30) -0.4% Animal 0.174** (2.37) 3.8% Sweet 0.157** (2.13) 2.5% Roasted 0.034 (0.55) 0.7% Unpleasant -0.139 (1.46) 1.9% R² 0.74 0.76
Note: OLS estimates. Absolute values of t-statistics are in parentheses, significance levels being respectively 1% (***), 5% (**) and 10% (*).