We MIN P06
Iron Grades Estimation Using Bayesian
Sequential Simulation - Lalor Case Study
A. Bouchedda* (INRS), M. Blouin (INRS), S. Tirdad (INRS), E. Gloaguen (INRS) & B. Giroux (INRS)
SUMMARY
This work presents the first step of the use of a Bayesian sequential simulation algorithm to estimate the iron grades of Lalor VMS deposit. The approach is based on an in situ petrophysical
relationship between iron grades and both conductivity and density. This statistical relationship is used to interpolate and extrapolate the iron grades over a 3D conductivity and density volume. Furthermore, this stochastic algorithm allows estimating the spatial uncertainty among a set of equiprobable realizations.
Introduction
Knowledge of the spatial distribution of ore mineral grades within the mineralized envelop is critical for reliable predictions of reserve estimation and mineral deposit characterisation. Generally, core analyses, that provide highly detailed information, are carried out in a few boreholes. As such information is inherently representative of small volume near boreholes, accurate assessment of ore mineral grades requires a high density of wells throughout the mineralisation. In this study, we proposed to achieve the same objective by using only a limited number of core data coupled with geophysical and geological information which are distributed on the entire investigated volume. More precisely, we used Bayesian sequential simulation (BSS) (Dubreuil-Boisclair et al., 20011) for multiple data integration. Bayesian kriging technique was originally developed by Doyen and Boer (1996) for the interpolation and extrapolation of lithological data. It has been successfully extanded to simulation and used in petroleum applications for gas hydrate grade estimation (Dubreuil-Boisclair et al., 2011) and hydrogeophysics applications for hydraulic conductivity estimation (Ruggeri et al., 2014). It consists in generating multiple equiprobable realizations of the spatial distribution of primary variable, here ore mineral grades, conditional to geophysical data that are know on the entire investigated volume and are statistically related in some way to limited sparsely sampled ore mineral grades. The advantage of BSS approach is that the relationship between ore mineral grades and petrophysical properties is estimated empirically based on collocated data. In other words, this relationship can be nonlinear and its quality is reflected in the variability of the stochastic realizations. To demonstrate the effectiveness of the proposed approach, we applied it to the Lalor Lake VMS deposit which is located near the town of Snow Lake, Manitoba (Canada). During the last five years, Lalor lake deposit was extensively studied by different university and industrial researcher groups. As the huge volume of geophysical, geological and geochemical datasets are publically shared by Hudbay Minerals,the owner of the deposit, we have a good opportunity to develop a new approaches It is one of the most in the Chisel Basin portion of the Flin Flon Greenstone Belt. It is considered as the largest VMS deposit discovered in the region. It has a lateral extent of about 900 m in the north-south direction and 700 m in the east-west direction and is located at ~570m to 1170m below surface. Mineralization occurs as disseminated to solid sulphides consisting of medium to coarse grained sphalerite, pyrite and chalcopyrite. It consists of a few stratiform sulphide horizons that trend to the northwest and have dips between 10o and 30o to the NNE. From the top to the bottom, there are three mineralization zones including a zinc rich zone, a gold rich zone and a gold-copper rich zone (Bellefleur et al., 2014).
Integration methodology
Before starting our integration methodology, it is necessary to determine the relationship between ore grades minerals and physical properties that allows us to separate ore rich zones from poor ore zones. The analysis of collocated well logs data and ore grade minerals on more than 17 wells shows a relationship between two metal grades, Fe and Zn concentrations, and two physical properties, electrical conductivity and density. Only the results obtained for Fe concentration are presented here. As shown in figure 1, the concentration of Fe increases with the density and electrical conductivity. In the case of Zn concentration, the same behavior can be only seen for electrical conductivity larger than 1 S/m. in addition, we can observe that the relationship between metal grades and physical properties is highly nonlinear.
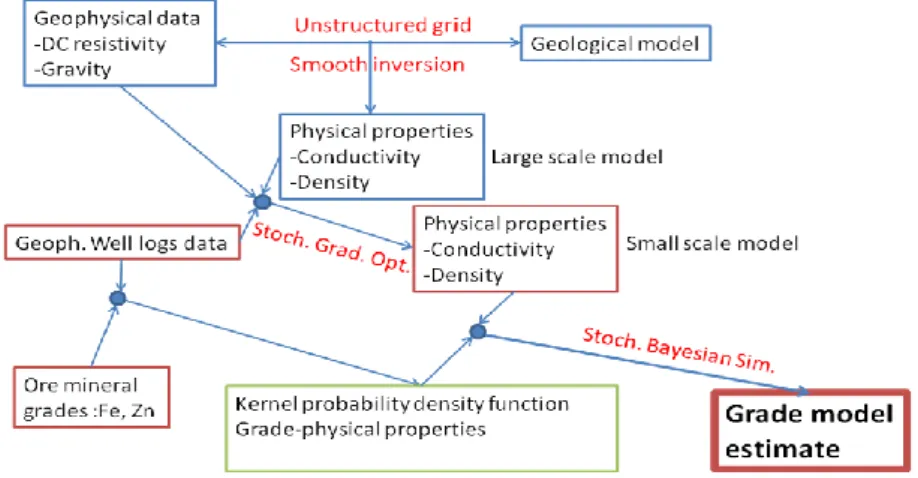
Our integration methodology can be summarised in three steps as shown in figure 2. A detailed description of the two first steps can be found in Bouchedda et al. (2016) and is not be detailed here. The two first steps aim to determine the physical properties model at the same scale of ore grade minerals for the entire interesting volume.
Figure 1 Scatter plot of conductivity-density-Iron grades obtained from collocated iron grades core
samples and resistivity and near density well logs.
The first step consists of constrained geophysical inversion using DC resistivity and borehole gravity data. The constraints are introduced as starting model which is obtained from geological model. The large scale physical properties models obtained from this geophysical inversion are used in the second step to determine the petrophysical models at the same scale of mineral grade measured on core data. This is carried out by minimizing an objective function that contains two terms. The first term consists of conventional geophysical data fitting. In the second term, the semi-variogram of petrophysical model is fitted to experimental semi-variogram obtained from well log data. The objective function is minimized using the derivative-free gradient stochastic algorithm as described by Li and Reynolds (2011).
Figure 2 Integration methodology flow chart.
The last step consists of BSS integration of the small scale petrophysical model obtained previously and core grade minerals. BSS technique is based on Bayes’ theorem that can be stated as follow:
High
where A and B denote the primary, iron grades here, and secondary variables, conductivity and/ or density here, respectively, p(•) denotes a probability distribution, and c is a normalization constant. The conditional distribution p(An|A1,…,An-1) represents the prior for the mineral grades in a chosen cell n in the model space. This prior is conditional to the measured and previously simulated values of the primary variable in cells 1 through n-1, and is obtained by calculating a Gaussian distribution from kriging estimate and variance at the chosen location. The distribution p(Bn| An) is the likelihood function, which expresses the range of values for the primary variable in cell n that is consistent with a particular measured value of the secondary variable at the same location. Finally, the distribution p(An |Bn,A1,…,An-1) represents the posterior for the primary variable in cell n, which represents an updated state of knowledge that takes into account both the prior information and likelihood.
Iron grade estimation of Lalor deposit
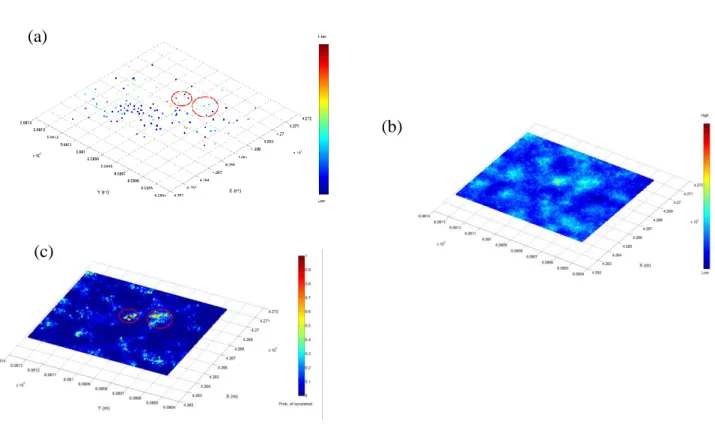
The small scale 3-D conductivity and density models obtained in step 2 as well as iron grades in 17 sparsely distributed wells are used to generate 50 BSS simulations. The variogram model used to compute the simple kriging (for the prior) is spherical with horizontal ranges of 100 m, and a vertical range of 100 m. Family 1 has a mean grade value of 2.8 and a variance of 2.7. Family 2 has a mean of 10 and a variance of 10. The the two means and variances were inferred from core analysis of 17 wells. The ranges were estimated under the hypothesis that the conductivity and density models respect the main structural behaviour of the iron grades. It is interesting to note that the stochastic approach allows the mapping of probability values exceeding a given cutoff considering all the realizations.
Figure 3 shows the BSS results at depth slice 820m. It is interesting to observe that two zones of higher iron grades are clearly identified on the probability of map for a cutoff fixed at a grade of 10. The median of all realisations shows more variability and a lot of similarity with core iron grades data. The extreme values of core grades are not well retrieved. This is probably due to low mean value for of the second family.
Conclusions
This work presents the first step of the use of a Bayesian sequential simulation algorithm to estimate the iron grades of Lalor VMS deposit. The approach is based on an in situ petrophysical relationship between iron grades and both conductivity and density. This statistical relationship is used to interpolate and extrapolate the iron grades over a 3D conductivity and density volume. Furthermore, this stochastic algorithm allows estimating the spatial uncertainty among a set of equiprobable realizations.
Acknowledgements
This work was supported by the Canada Chair on the Stochastic Data Assimilation for Three Dimension geological modelling. We also want to acknowledge Hudbay minerals and Mira Geoscience for access to the data
Figure 3 BSS results at depth slice of 820m. (a) Core iron grades at 820m obtained from more than
50 wells, (b) median of 50 realisations, (c) probability of occurrence of iron grades over a cutoff fixed at a grade of 10.
References
Bellefleur, G., Schetselaar, E. and Craven, J.A. [2014] Targeted Geoscience Initiative 4: a synthesis of the methodology project at the Lalor VMS Deposit, Manitoba. Geological Survey of
Canada, Geology of Canada (No. 7863).
Dubreuil-Boisclair, C., E. Gloaguen, D. Marcotte, and B. Giroux [2011] Heterogeneous aquifer characterization from ground-penetrating radar tomography and borehole hydrogeophysical data using nonlinear Bayesian simulations, Geophysics, 76 (4), J13–J25.
Li, G., Reynolds, A.C. [2011] Uncertainty quantification of reservoir performance predictions using a stochastic optimization algorithm. Computational Geosciences, 15(3), 451–462.
Ruggeri, P., Gloaguen, E., Lefebvre, R., Irving, J. and Holliger, K. [2014] Integration of hydrological and geophysical data beyond the local scale: Application of Bayesian sequential simulation to field data from the Saint-Lambert-de-Lauzon site, Québec, Canada. Journal of
Hydrology, 514, 271-280.
(b)