CONVECTIVE DRYING OF GELS: COMPARISON BETWEEN SIMULATED AND EXPERIMENTAL MOISTURE PROFILES OBTAINED BY X-RAY
MICROTOMOGRAPHY
I. Escalona1, W. Jomaa2, C. Olivera-Fuentes1, M. Crine3, A. Léonard3 1
TADIP, Thermodynamics and Transport Phenomena Department, University Simon Bolivar,Caracas, Venezuela
2
University Bordeaux 1, ENSAM, Talence, France
3
Laboratory of Chemical Engineering, University of Liège, FNRS, Liège, Belgium
Correspondence: A. Léonard, Laboratory of Chemical Engineering, University of Liège, B6C - Sart Tilman,4000 Liège, Belgium. Tel : + 32 4 366 47 22; Fax : + 32 4 366 28 18; E-Mail : A.Leonard@ulg.ac.be
Running head: Simulated vs. experimental internal moisture profiles
Abstract:
In this work, internal moisture profiles obtained either by simulation or experimentally during the convective drying of resorcinol-formaldehyde gels are compared. Such a comparison constitutes an attractive way to validate drying simulation models. X-ray microtomography, a powerful 3D imaging technique, coupled to image analysis is used to determine the internal moisture profiles in a non destructive way. A thermo-hygro-mechanical coupled model is used to simulate the moisture profiles developing during drying. Resorcinol-formaldehyde gels are used because their degree of shrinkage can be easily controlled. Results show a fairly good agreement between experimental and simulated profiles, especially at high moisture contents.
Keywords: X-ray microtomography, moisture profiles, convective drying,
resorcinol-formaldehyde xerogels, thermo-hygro-mechanical modelling
INTRODUCTION
Comparison of actual and predicted moisture profiles which develop during drying is an elegant a way to validate simulation models [1]. However, the difficulty to obtain experimental measurements has limited the ability of such drying models validation. Up to now, moisture profiles have been mainly determined either by a destructive technique such as slicing [2] or by sophisticated non destructive methods such as nuclear magnetic resonance [3-5] or gamma-ray attenuation [6]. Alkan et al. [7] recently reported the use of high X-ray energy industrial computed tomography to follow moisture distribution changes in wetwood. Some of us showed previously that X-ray microtomography coupled with image analysis was an accurate, non destructive and easy to use technique to determine internal moisture profiles developing during drying [8]. This technique is also very useful to measure precisely shrinkage and to detect the formation of drying induced cracks [9, 10]. Similarly as for a medical scanner, X-ray microtomography provides 2D or 3D images of the investigated sample. By calibration, it is possible to relate the grey level of each pixel to the local moisture content [11]. In this work, experimental moisture profiles obtained by X-ray microtomography during the convective drying of resorcinol-formaldehyde hydrogels are compared with those obtained from the simulation of the drying experiment. Resorcinol-formaldehyde hydrogels constitute good test materials because their degree of shrinkage can be easily modified by changing the synthesis conditions [12]. Moreover, porous carbons obtained after pyrolysis of these gels present a wide variety of promising applications such as adsorbents for gas separation, catalysts supports [13], electrode material for double layer capacitors [14], energy storage device, column packing materials for chromatography, …
MATERIALS AND METHODS
Sample preparation
Hydrogels were obtained by polycondensation of resorcinol, solubilized in water, with formaldehyde in the presence of Na2CO3, usually called catalyst (C). Since the carbonate concentration controls the gel texture and its shrinkage behavior [15], two R/C ratios (300, and 500) were chosen to study the influence of the solid displacement. Indeed, the pore texture of the pristine RF hydrogels can be modified by changing the pH, or the R/C ratio, of the precursors solution. The effect of the R/C value on the pore size was already discussed in many previous studies reviewed by Muhtaseb and Ritter [16]. The molar ratio R/F and the dilution ratio D, i.e. the Solvent/(R+F) molar ratio were fixed at 0.5, (stoichiometric ratio), and 5.7, respectively. 9.91 g resorcinol (Vel, 99%) were first dissolved with 18.8 ml deionised water with the required amount of Na2CO3 in 250 ml sealable flasks under magnetic stirring. Then, 13.5 ml formaldehyde solution (Aldrich, 37% wt. in water, stabilized by 10–15% wt. methanol) were added to the resorcinol solution. Cylindrical samples were obtained by casting 6 ml solution into glass moulds and putting them for gelation and aging at 70°C during 24 h under saturated atmosphere.
Convective drying
After gelation and aging, the monoliths were dried in a classical convective rig controlled in air relative humidity, temperature and velocity specially designed for handling small samples (a few cm³) [17]. The sample was continuously weighed during the drying test. Its mass was recorded every 10 s. Drying conditions were chosen in order to keep monoliths and to avoid sample cracking [10]. External heat and mass transfer coefficients were obtained from the constant flux period.
X-ray microtomography
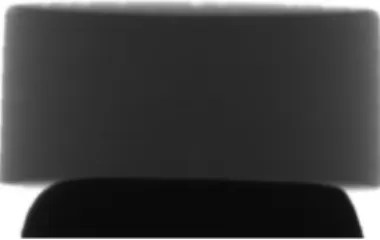
X-ray microtomography is a powerful non-invasive technique allowing the visualization of the internal texture of a sample based upon local variation of the X-ray attenuation coefficient. It was used to obtain 2-dimensional cross sections images of the RF hydrogels after increasing drying times (Fig. 1). The X-ray tomographic device used in this study was a "Skyscan-1074 X-ray scanner" (Skyscan, Belgium). Advanced technical details about its conception and operation can be found in [18]. The X-ray source operated at 40 kV and 1 mA. The detector was a 2D, 768×576 pixels, 8-bit X-ray camera with a spatial resolution of 41 µm. The RF hydrogel sample was periodically (approximately every 5 minutes) removed from the drying chamber and placed in the microtomograph. The rotation step was fixed at 3.6 degree in order to reduce the acquisition time down to about 2 minutes. This was necessary to avoid relaxation of moisture profiles and further drying of the sample. It was shown in a previous work about sludge drying that the repeated interruptions had no significant effect on the drying kinetics [17]. A radiograph of the sample (Fig. 2) was recorder for each angular position, over 180°. A classical back projection algorithm was used to reconstruct 2D cross sections from the radiographs, along the sample height. The images are constituted of pixels whose grey level value is related to the local X-ray linear attenuation coefficient.
Image analysis
An original image analysis processing has been developed in order to perform a quantitative grey level analysis of the 2D tomographic images [11]. The program was implemented in Matlab software, with image analysis toolbox version 6.0 from Matworks. For each cross section, a series of equal thickness concentric rings was constructed by applying successive cross section erosions. Each ring had a thickness of 5 pixels or 0.205 mm. A calibration curve was used to convert grey level into moisture content. This curve can be obtained by plotting
the mean moisture content of the whole sample versus the mean grey level of the 2D reconstructed images, for each interruption of the drying process.
MODEL
The equations are based on the model developed by Jomaa and Puiggali [19]. The xerogel is assumed to be a shrinking medium in which the liquid and solid phases are followed during drying. Saturation of the sample, i.e. ideal shrinkage, is assumed throughout the drying process. The equations are written in Eulerian coordinates with the introduction of the matrix velocity to take into account the mechanical coupling. The numerical resolution is performed with the commercial solver COMSOL MultiphysicsTM with an ALE (Arbitrary Lagrangian Eulerian) method in order to follow the moving of the boundaries. This method is well adapted when this deformation can not be considered as infinitesimal. A 2D axisymmetric geometry was adopted, taking into account the cylindrical shape of the samples. The drying conditions are the same on both the upper and bottom faces of the cylinder, so that a horizontal axis of symmetry was also used besides the axial symmetry [20].
Mass balance equation
Assuming that the system remains biphasic, the water content on a dry basis W can be obtained from the apparent density of the liquid phase
ρ
l (Eq. 1), which was chosen as the dependent variable in the expression of mass conservation (Eq. 2). In these equations ρll ands s
ρ are the intrinsic densities of the liquid and solid phases, Deff is the effective diffusion coefficient, and uis the solid velocity vector.
− = = l l l l s s l l s l ρ ρ ρ ρ ρ ρ ρ W (1)
(
D)
0 .− eff∇ + = ∇ + ∂ ∂ u ρ ρ t ρ l l l (2)Energy balance equation
The convective term associated to water transport was neglected in the heat transfer equation according to a previous work [21] (Eq. 3). In this expression
ρ
is the apparent sample density (Eq. 4), Cp the specific heat of the xerogel (Eq. 5) and k the thermal conductivity (Eq. 6). The vaporization is assumed to occur at the surface of the sample throughout the process so that the latent heat contribution only appears in the boundary conditions.(
k)
0 . Cp −∇ ∇ = ∂ ∂ T t T ρ (3) s l ρ ρ ρ= + (4) W W + + = 1 C C C s p l p p (5) t pDiff C k=ρ (6)Mechanical equilibrium equation
The mechanical equilibrium equations (Eq. 7) are written in an axisymmetric system according to equations 8 and 9. Stress-strain relations are expressed following equations 10 to 16. The strain associated to shrinkage is determined from ideal volumetric shrinkage, which can be considered as isotropic for xerogels [10] (Eq. 17). Depending on the synthesis conditions, the gels may present a viscoelastic behavior. However the Deborah number, i.e. the ratio of the characteristic relaxation time to the characteristic diffusion time, is small, indicating that the elastic contribution is sufficient to describe the hydro-mechanical coupling [22]. Mechanical properties can be found in [12].
0 .σ= ∇ (7) 0 = ∂ + − + ∂ ∂ r r r rz r r σ σ τ σ θ (8)
z r r z rz rz ∂ ∂ + + ∂ ∂τ τ σ (9) − − − = S z T z S T S r T r z r ε ε ε ε ε ε σ σ σ θ θ θ 1 2 2 2 1 2 2 2 1 C C C C C C C C C (10) T rz rz ε τ =G (11) υ υυ υ υ 2 1 G C 2 1 1 G C 1 E G 2 1 − = − − = + = (12) r a T r ∂ ∂ =
ε , with a = radial displacement (13)
r a T = θ ε (14) z b T z ∂ ∂ =
ε , with b = vertical displacement (15)
∂ ∂ + ∂ ∂ = r b z a T rz 2 1 ε (16) l l s s l l s s S z S S r ρ W ρ Wρ V V V V + + = − = = = ρ 1 0 0 3 1 0 ε ε ε θ (17) Boundary conditions
Equations 18 to 24 express the boundary conditions associated with a convective drying operation.
a) For mass transfer: On the two drying faces:
(
D)
h ( -C ) .n − eff∇ρl = Mρair Csurf ∞ (18) On the two axis of symmetry
(
D)
0.
n − eff∇ρl = (19)
b) For heat transfer:
On the two drying faces: (20)
(
T)
(
C)
(
T Tsurf)
n.k∇ =-∆HvaphMρair Csurf − ∞ +hT ∞−
Csurf is obtained from the knowledge of both the temperature at external surface, and the corresponding saturation vapour pressure, and the sorption isotherm [23].
On the two axis of symmetry:
(
k)
0.
n ∇T = (21) c) For mechanical equilibrium
On all faces:
0 n . =
σ (22)
On the vertical axis of symmetry:
a = 0 (23) On the horizontal axis of symmetry:
b = 0 (24)
RESULTS AND DISCUSSION
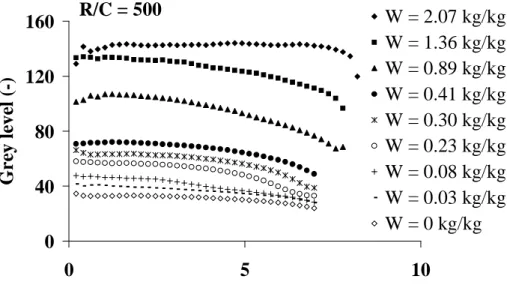
Figs. 3 and 4 show some grey level profiles obtained at increasing drying times corresponding to decreasing mean water contents, for samples synthesized with R/C = 500 and 300, respectively. The grey levels represented on these figures were averaged on the different
cross-sections along the sample height, in a same ring. The x-axis represents the distance between the centre of the sample (x=0) and the considered ring, up to the external border of the sample. Decreasing distances between the wall and the sample centre illustrate the shrinkage observed during drying. At the beginning of drying, both samples have initial water contents close to 2 kgkg-1. Consequently, the same mean grey level, approx. 135, is obtained throughout the samples. A grey level gradient is observed at the wall before putting the sample in the drying ring, indicating that some water has already been removed during the end of the gelation-aging period.
When drying proceeds, two different kinds of results are obtained depending on the sample. For R/C = 500, the mean grey level of the cross sections decreases during the whole course of drying, while for R/C = 300, the mean grey level first increases before beginning to decrease. Once dried, the mean grey level for xerogels obtained at R/C = 500 has a value lower than 40, while at R/C = 300 a value close to 70 is measured.
These observations based on the grey level values can be related to the evolution of the X-ray linear attenuation coefficient during drying. This coefficient µ depends on the density
ρ
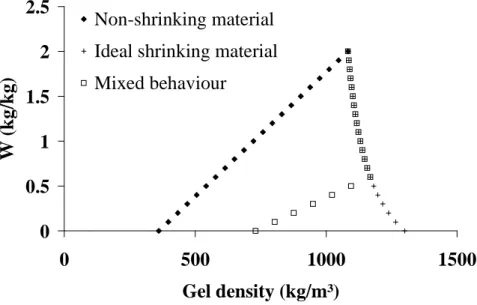
and the atomic number Z of the material, and on the energy of the incident beam EX according to Eq. 25 in which a is a quantity with a relatively small energy dependence, and b is a constant [24]. + = 33..82 X E bZ a ρ µ (25)Taking into account the composition of the hydrogels, i.e. water, resorcinol and formaldehyde, one can assume that the local attenuation coefficient mainly depends on the density of the material. Depending on the shrinkage behavior of the hydrogels, two extreme situations can be considered to describe the evolution of the density with the water content (Fig. 5). For a totally non-shrinking material, the density decreases as the water removed
during drying is replaced by air. For a material exhibiting ideal shrinkage, i.e. remaining fully saturated, the density increases as water ‘is replaced’ by the dried RF resins whose intrinsic density is higher. When the gel first exhibits an ideal shrinkage period and then keeps the same volume until the end of the drying process, a mixed behavior is obtained: the density first increases and then decreases.
Results obtained from X-ray tomography come from the evolution of the attenuation coefficient, or the density, during the drying process. For R/C = 500, the gel exhibits almost no shrinkage, explaining the continuous decrease of the attenuation coefficient. For R/C = 300, the gel exhibit a large zone of ideal shrinkage before reaching its final volume [10]. This explains the increase of the attenuation coefficient down to W = 0.55 kgkg-1. Once shrinkage has stopped, the density and, consequently, the attenuation coefficient decreases. At the end of the drying process, the values of the attenuation coefficient indicate that the xerogel obtained with R/C = 300 has a higher density than the one obtained with R/C = 500. This is in agreement with Fig. 5 and with experimental measurements [10].
Fig. 6 shows the calibration curves obtained by plotting the mean moisture content of the sample versus the mean grey level of the reconstructed images. The shape of the curves corresponds rather well with the theoretical evolution of the density shown in Fig. 5. For R/C = 500, the relation between the water content and the grey level is almost linear. For R/C = 300, two parts can clearly be identified. The sharp zone observed at water contents higher than 0.5 kgkg-1 corresponds to ideal shrinkage. However, the grey level value remains close to 130 and does not increase as expected by Fig. 3. This is probably due to the limit of contrast that can be obtained with the used X-ray microtomograph. For water contents below 0.5 kgkg -1
, the linear part corresponds to a non-shrinking zone. The comparison of both calibration curves seems to indicate a short ideal shrinkage zone even for R/C = 500, which corresponds to the actual behavior of the sample [12].
Based on the data of Fig. 6, it is possible, in principle, to get internal water content profiles from the grey level ones (Fig. 3 and 4). Even though this is quite easy in the linear part of the calibration curve, some difficulties appear in the zone of ideal shrinkage because of the nearly asymptotic shape. A small error on the grey level value may lead to a large change in the water content. This is why, is this work, we will only present moisture profiles obtained for R/C = 500, at mean water content lower than 1.5 kgkg-1. Fig. 7 clearly shows the existence of moisture gradients at the wall resulting from internal mass transfer limitations.
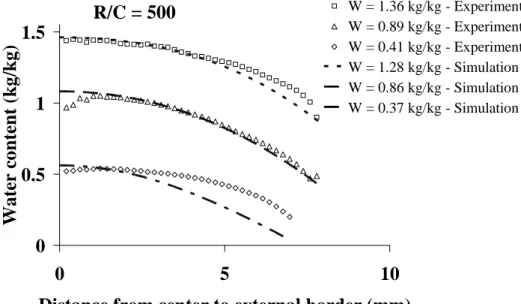
In Fig. 8, experimental profiles obtained during the convective drying of hydrogels synthesised with R/C = 500 are compared with those predicted by the simulation model. Results show a fairly good agreement for mean water content higher than approx. 0.8 kgkg-1. On the contrary, experimental and simulated profiles diverge at lower water contents: the simulation overestimates the gradient at the wall. This indicates that some improvements should be done in the model, namely the introduction of a water dependent effective diffusion coefficient. Nevertheless, it must be noticed that some errors can also affect the experimental profiles. Another measurement campaign should be done in order to obtain tomographic measurements for other drying conditions.
CONCLUSIONS
X-ray microtomography, associated to image analysis, is a powerful non destructive characterization method. By allowing the comparison between experimental and simulated internal moisture profiles, this technique is very promising for the validation of drying models. In this work, rather good results have been obtained in the case of the convective drying of resorcinol-formaldehyde hydrogels. Nevertheless some problems remain in the zone of ideal shrinkage of the samples, due to difficulties in calibrating the grey level images. Results also show that the model should be improved, especially in the last stages of drying.
As a next step, further experiments will be carried out in order to confirm the profiles obtained by microtomography and to study the influence of the drying conditions. For these tests, a microtomograph with a higher resolution [25] will be used in order to enhance the contrast of the obtained images.
NOMENCLATURE a radial displacement m b vertical displacement m C air humidy kgkg-1 Cp specific heat Jkg-1K-1 s p
C xerogel specific heat Jkg-1K-1
l p
C water specific heat Jkg-1K-1 Deff effective diffusion coefficient m²s-1 Difft thermal diffusivity m²s-1 E Young’s modulus MPa EX Energy of the X-ray beam keV G rigidity modulus MPa
hM external mass transfer coefficient ms-1 hT external heat transfer coefficient Wm-2K-1
∆Hvap latent heat of vaporization Jkg-1 k thermal conductivity Wm-1K-1 r radial co-ordinate m RH relative humidity (-)
t time s
u solid velocity ms-1 v air velocity ms-1 V volume m3 W water content kgkg-1 z vertical co-ordinate m Z atomic number (-) Greek letters ε strain (-) θ angular co-ordinate (°)
µ X-ray attenuation coefficient m-1
ρ apparent sample density kgm-3
ρair humid air density kgm-3
ρs apparent xerogel density kgm-3
ρl apparent water density kgm-3
l l
ρ intrinsic water density kgm-3
s s
ρ intrinsic xerogel density kgm-3
σ stress Pa
τ shear stress Pa
υ poisson’s ratio (-)
Subscripts
0 initial
surf at the external sample surface
ACKNOWLEDGEMENTS
A. Léonard is indebted to the Belgian Fonds de la Recherche Scientifique (FRS-FNRS) for a Research Associate position. A. Léonard also thanks the FNRS for supporting her scientific stay at the TREFLE Laboratory. I. Escalona thanks the ALFA Program of the E.U. (project ALFA II 0412 FA FI) for enabling fruitful scientific exchanges between European Union and Latin America.
REFERENCES
1. Waananen, K.M., J.B. Litchfield, and M.R. Okos, Classification of drying models for porous solids. Drying Technology, 1993, 11 (1), 1-40.
2. Couturier, S., J. Vaxelaire, and J.R. Puiggali. Convective drying of domestic activated sludge. In Proceedings of 12th International Drying Symposium, Noordwijkerhout, The Netherlands, August 28-31, 2000, 2000.
3. Ruan, R., S.J. Schmidt, A.R. Schmidt, and J.B. Litchfield, Nondestructive measurement of transient moisture profiles and the moisture diffusion coefficient in a potato during drying and absorption by NMR imaging. Journal of Food Process Engineering, 1991, 14 (4), 297-313.
4. Frias, J.M., L. Foucat, J.J. Bimbenet, and C. Bonazzi, Modeling of moisture profiles in paddy rice during drying mapped with magnetic resonance imaging. Chemical Engineering Journal, 2002, 86 (1-2), 173-178.
5. Schrader, G.W. and J.B. Litchfield, Moisture profiles in a model food gel during drying: Measurement using magnetic resonance imaging and evaluation of the Fickian model. Drying Technology, 1992, 10 (2), 295 - 332.
6. Mazza, M.G.G., E.C. Biscaia, and G. Massarani, Study of Drying of a Porous Medium Using Gamma-Ray Attenuation Technique. Drying Technology, 2006, 24 (3), 259 - 267.
7. Alkan, S., Y. Zhang, and F. Lam, Moisture Distribution Changes and Wetwood Behavior in Subalpine Fir Wood during Drying Using High X-Ray Energy Industrial CT Scanner. Drying Technology, 2007, 25 (3), 483 - 488.
8. Leonard, A., S. Blacher, P. Marchot, J.P. Pirard, and M. Crine, Moisture profiles determination during convective drying using x-ray microtomography. Canadian Journal of Chemical Engineering, 2005, 83 (1), 127-131.
9. Leonard, A., S. Blacher, P. Marchot, J.P. Pirard, and M. Crine, Measurement of shrinkage and cracks associated to convective drying of soft materials by X-ray microtomography. Drying Technology, 2004, 22 (7), 1695-1708.
10. Job, N., F. Sabatier, J.P. Pirard, M. Crine, and A. Leonard, Towards the production of carbon xerogel monoliths by optimizing convective drying conditions. Carbon, 2006,
44 (12), 2534-2542.
11. Leonard, A., S. Blacher, P. Marchot, J.P. Pirard, and M. Crine, Image analysis of X-ray microtomograms of soft materials during convective drying. Journal of Microscopy-Oxford, 2003, 212, 197-204.
12. Leonard, A., S. Blacher, M. Crine, and W. Jomaa, Evolution of mechanical properties and final textural properties of resorcinol-formaldehyde xerogels during ambient air drying. Journal of Non-Crystalline Solids, 2008, 354 (10-11), 831-838.
13. Job, N., M.F.R. Pereira, S. Lambert, A. Cabiac, G. Delahay, J.F. Colomer, J. Marien, J.L. Figueiredo, and J.P. Pirard, Highly dispersed platinum catalysts prepared by impregnation of texture-tailored carbon xerogels. Journal of Catalysis, 2006, 240 (2), 160-171.
14. Frackowiak, E. and F. Beguin, Carbon materials for the electrochemical storage of energy in capacitors. Carbon, 2001, 39 (6), 937-950.
15. Job, N., F. Panariello, J. Marien, M. Crine, J.P. Pirard, and A. Leonard, Synthesis optimization of organic xerogels produced from convective air-drying of resorcinol-formaldehyde gels. Journal of Non-Crystalline Solids, 2006, 352 (1), 24-34.
16. Al-Muhtaseb, S.A. and J.A. Ritter, Preparation and properties of resorcinol-formaldehyde organic and carbon gels. Advanced Materials, 2003, 15 (2), 101-+. 17. Leonard, A., S. Blacher, P. Marchot, and M. Crine, Use of X-ray microtomography to
follow the convective heat drying of wastewater sludges. Drying Technology, 2002,
20 (4-5), 1053-1069.
18. Sasov, A. and D. Van Dyck, Desktop X-ray microscopy and microtomography. Journal of Microscopy-Oxford, 1998, 191, 151-158.
19. Jomaa, W. and J.R. Puiggali, Drying of shrinking materials - Modelings with shrinkage velocity. Drying Technology, 1991, 9 (5), 1271-1293.
20. Leonard, A., M. Crine, and W. Jomaa, Modelling of the convective drying of resorcinol-formaldehyde resins: influence of the drying conditions on the induced stress tensor. In Drying 2006; I. Farkas, (Ed); Szent Istvan University Publisher: Gödöllö. 2006; 273-278.
21. Jomaa, W., J.R. Puiggali, and S. Whitaker. Transfert de chaleur lors du séchage de matériaux fortement déformables. In Proceedings of J.I.T.H. 91, 5th International Conference of Thermal Energy, Monastir, Tunisia, 1991.
22. Achanta, S., M.R. Okos, J.H. Cushman, and D.P. Kessler, Moisture transport in shrinking gels during saturated drying. Aiche Journal, 1997, 43 (8), 2112-2122.
23. Escalona, I.G., C.J. Gommes, N. Job, S. Blacher, C.G. Olivera-Fuentes, J.-P. Pirard, and A. Léonard, Water desorption from resorcinol-formaldehyde hydrogels and adsorption in the resulting xerogels. Microporous and Mesoporous Materials, 2009,
24. Stepanek, F., M. Crine, and A. Leonard, Use of X-ray tomography for drying-related applications. In Modern Drying Technology, Vol 2. Experimental Techniques; E. Tsotsas and A.S. Mujumdar, (Eds); Wiley-VCH: Weinheim. 2008; 143-186.
25. Leonard, A., S. Blacher, C. Nimmol, and S. Devahastin, Effect of far-infrared radiation assisted drying on microstructure of banana slices: An illustrative use of X-ray microtomography in inicrostructural evaluation of a food product. Journal of Food Engineering, 2008, 85 (1), 154-162.
FIGURES
Fig. 1. Reconstructed cross section
0
40
80
120
160
0
5
10
Distance from center to external border (mm)
G
re
y
l
ev
el
(
-)
W = 2.07 kg/kg
W = 1.36 kg/kg
W = 0.89 kg/kg
W = 0.41 kg/kg
W = 0.30 kg/kg
W = 0.23 kg/kg
W = 0.08 kg/kg
W = 0.03 kg/kg
W = 0 kg/kg
R/C = 500
Fig. 3. Grey level profiles – 80°C – 1 ms-1
0
40
80
120
160
0
5
10
Distance from center to external border (mm)
G
re
y
l
ev
el
(
-)
W = 2.02 kg/kg
W = 1.40 kg/kg
W = 0.75 kg/kg
W = 0.63 kg/kg
W = 0.55 kg/kg
W = 0.52 kg/kg
W = 0.02 kg/kg
R/C = 300
0
0.5
1
1.5
2
2.5
0
500
1000
1500
Gel density (kg/m³)
W
(
k
g
/k
g
)
Non-shrinking material
Ideal shrinking material
Mixed behaviour
Fig. 5. Evolution of gel density with water content
0
0.5
1
1.5
2
2.5
0
50
100
150
Grey level (-)
W
(k
g
/
k
g
)
R/C = 500
R/C = 300
Experimental calibration curves
0
0.5
1
1.5
0
5
10
Distance from center to external border (mm)
W
a
te
r
co
n
te
n
t
(k
g
/k
g
)
W = 1.36 kg/kg
W = 0.89 kg/kg
W = 0.41 kg/kg
W = 0.30 kg/kg
W = 0.23 kg/kg
W = 0.08 kg/kg
R/C = 500
Fig. 7. Internal moisture profiles obtained by X-ray microtomography – 80°C – 1 ms-1
0
0.5
1
1.5
0
5
10
Distance from center to external border (mm)
W
a
te
r
co
n
te
n
t
(k
g
/k
g
)
W = 1.36 kg/kg - Experiment W = 0.89 kg/kg - Experiment W = 0.41 kg/kg - Experiment W = 1.28 kg/kg - Simulation W = 0.86 kg/kg - Simulation W = 0.37 kg/kg - SimulationR/C = 500
TABLES
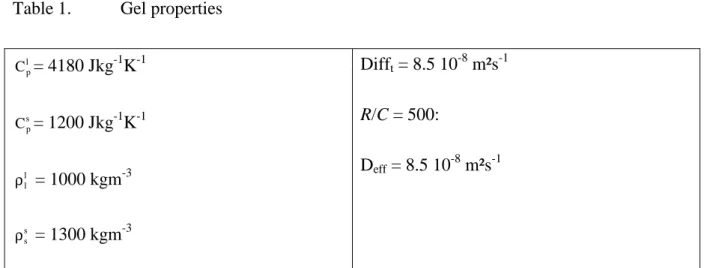
Table 1. Gel properties
l p C = 4180 Jkg-1K-1 s p C = 1200 Jkg-1K-1 l l ρ = 1000 kgm-3 s s ρ = 1300 kgm-3 Difft = 8.5 10-8 m²s-1 R/C = 500: Deff = 8.5 10-8 m²s-1
FIGURE CAPTIONS
Fig. 1. Reconstructed cross section
Fig. 2. Wet gel on the sample holder in the microtomograph
Fig. 3. Grey level profiles – 80°C – 1 ms-1
Fig. 4. Grey level profiles – 20°C – 3 ms-1
Fig. 5. Evolution of gel density with water content
Fig. 6. Experimental calibration curves
Fig. 7. Internal moisture profiles obtained by X-ray microtomography – 80°C – 1 ms-1