Analytical validation of the Liaison Calcitonin_II-Gen (DiaSorin). 1
2
Etienne Cavalier*, Agnès Carlisi, Anne-Catherine Bekaert, Olivier Rousselle, Jean-Paul 3
Chapelle, Pierre Delanaye 4
5
Department of Clinical Chemistry, University of Liege, University Hospital of Liege, 6 Belgium 7 8 * Corresponding author: 9 Dr Etienne Cavalier 10
Department of Clinical Chemistry 11
University Hospital of Liège, 12 Domaine du Sart-Tilman 13 B-4000 Liège 14 Belgium. 15 Tel : +32 4 3667692 16 Fax : +32 4 3667691 17 [email protected] 18 19
Running title: Validation of a calcitonin method: Liaison II Gen® 20
This paper has never been submitted before. Some parts of this work have been accepted as 21
an abstract for presentation at the AACC 2010 (Anaheim) Congress. 22
Word count: 2210 words from introduction to references. 257 words in the abstract. 23
Abstract. 1
Background. We validated the DiaSorin Liaison Calcitonin_II-Gen, an improved method for 2
calcitonin (CT) determination, compared this method with the Cisbio_h-CT kit and 3
established the reference range of CT in a normal adult population. 4
Methods. We determined the precision, functional sensitivity, traceability to the 2nd IS 89/620, 5
linearity and the measurement uncertainty, accuracy profile and β-expectation limits. We 6
evaluated the specificity, the susceptibility to HAMA, hook-effect and carry-over. To 7
establish a reference range, we selected 267 non-renal insufficient adults presenting normal 8
TSH, free-T4 and calcium levels and no anti-thyroglobulin antibodies as our “reference” 9
healthy population. We compared the method with Cisbio on 250 consecutive and 45 samples 10
post-pentagastrin stimulation test. 11
Results. Precision (expressed as CV) was <10% for the measurement range, functional 12
sensitivity: 5.3 ng/L and the method was found linear until the 1/10 dilution. Uncertainty 13
ranged from 25 to 7.2% and the risk that one result falls out of the ±20% acceptance limits 14
was <5% between 2.9 and 1513 ng/L. The Bland and Altman plot showed no systematic bias 15
between the two methods. The test is still prone to HAMA influence, does not present any 16
hook-effect but a carry-over was observed. Ninety-five percent of our adult reference 17
population presented CT levels < 7.4 ng/L, with an important gender difference: 95% of the 18
men presented CT values <9.8 ng/L whereas 95% of women were < 4.0 ng/L. 19
Conclusions. Liaison Calcitonin_II-Gen is an analytically robust method. The important 20
gender-difference observed in our well-designed population might lead to a re-evaluation of 21
the generally used “10 ng/L” cut-off in a multicentre prospective study. 22
23 24
Keywords: analytical validation; calcitonin; measurement uncertainty; reference range; 1
medullary thyroid carcinoma 2
Introduction. 1
Calcitonin (CT) is a 32-amino acid calcium lowering peptide secreted by the C cells 2
(parafollicular cells) of the thyroid. Serum CT is the most specific and sensitive marker of 3
medullary thyroid carcinoma (MTC) for both the primary diagnosis and the post-chirurgical 4
follow-up (1;2). Although CT levels are higher in males than in females, many laboratories 5
use a cut-off value of 10 ng/L instead of a population-based reference interval. Indeed, 6
different studies have shown that, in normal population and in 90% of patients suffering from 7
other nodular thyroid diseases, basal CT concentration were below 10 ng/L (3-7). In clinical 8
practice, patients with basal CT > 10 ng/L should undergo a pentagastrin stimulation test to 9
exclude the presence of MTC. Stimulated peak serum CT concentration > 100 ng/L are >90% 10
specific for the diagnosis of C-cell disease, either C-cell hyperplasia or MTC (1;6;7). It is 11
however important to point out that most of the reference studies have been established on the 12
basis of data obtained with the Cisbio International immunoradiometric calcitonin assay (Gif-13
sur-Yvette, France). Even if this kit is still recommended by some scientific societies, many 14
laboratories have moved to more automated methods, either the Siemens Immulite 2000 15
family or the DiaSorin Liaison. We (8) and others (9) have already warned against the 16
significant problems when the “10 ng/L” cut-off was indiscriminately used with the first 17
version of the Liaison calcitonin kit. 18
Recently, DiaSorin (Stillwater, MN) launched a new version of the calcitonin kit 19
(Calcitonin_II-Gen) on the Liaison platform. The aim of this study was to evaluate the 20
analytical performance of this new version of the Liaison calcitonin and to compare the 21
performance of this kit with the Cisbio International immunoradiometric method. We also 22
determined the biological reference interval of this parameter in a very well biologically 23
described “normal” adult population. 24
2. Materials and methods. 1
2.1 Analytical methods 2
The Liaison Calcitonin_II-Gen assay is a one step sandwich chemiluminescent assay that uses 3
a pair of affinity-purified mouse antibodies. The kit is calibrated against the 2nd International 4
Standard 89/620. 5
The Cisbio International IRMA h-CT is a solid phase two-site immunoradiometric assay that 6
uses a pair of monoclonal antibodies, one coated on a solid phase and the other radiolabelled 7
with 125I. The manufacturer claims that 1µ IU of the 2nd International Standard 89/620 8
corresponds to 3.6 pg of calcitonin. 9
2.2 Statistical softwares 10
We used the Medcalc (Mariakerke, Belgium) and the e-noval (Arlenda, Liège, Belgium) 11
softwares for the statistical evaluation of the results. 12
2.3 Samples 13
We only used serum samples for CT determination. All the samples were treated according to 14
our pre-analytical procedure: after sampling, they were spun at +4°C at 3500G, aliquoted and 15
kept frozen at -20°C until determination. 16
2.4 Validation protocol 17
For the validation purpose, we evaluated the precision in accordance with a modified protocol 18
based on CLSI EP-5A2: 12 serum pools were assayed in six replicates per day on five 19
different days (360 determinations). The limit of quantification (or functional sensitivity) was 20
assessed as the lowest values giving in inter-assay (on 10 different days) a coefficient of 21
variation of 20%. The linearity was evaluated based on CLSI EP-6A. We studied the 22
traceability to the 2nd International Standard 89/620. We evaluated the measurement
23
uncertainty, the accuracy and the β-expectation limits: measurement uncertainty characterizes 24
the dispersion of the values around the true value and β-expectation tolerance limits with 25
β=0.95 are the upper and lower values in-between which each future measurements of the 1
same level has a probability of 95% to be found (10;11). We consider that the method will 2
provide accurate results if the 95% β-expectation tolerance interval at each concentration 3
level is fully included in the acceptance limits that we decided to settle at ±20% (12). 4
We checked the specificity of the assay by using 14 samples from patients treated by 5
complete thyroidectomy and irradiation. 6
The presence of a hook effect was studied with samples spiked with very high amounts of the 7
2nd IS 89/620 and, finally, we studied the susceptibility of the kit to present an interference 8
with human anti-animal antibodies (HAMA) with 3 selected samples, known to present an 9
interference with the previous version. 10
2.5 Comparison with the Cisbio h-CT. 11
We compared the results obtained with the two methods in 250 consecutive samples from our 12
daily routine and 45 samples obtained after pentagastrin stimulation test. 13
2.6 Establishment of the reference range. 14
We evaluated the biological reference interval in a healthy adult population (122 women and 15
145 men; mean age: 56.4 yo (L:17; H: 87)), selected on basis of the absence of anti-16
thyroglobulin antibodies and normal levels of TSH (0.3 – 3.6 mIU/L) and free T4 (10.2 – 21.8 17
pmol/L) on Liaison, according the manufacturer. All the patients presented normal levels of 18
serum calcium (2.20 – 2.60 mmol/L) and did not suffer from chronic kidney disease 19
(estimated glomerular filtration rate > 60 ml/min/1.73m² according to the MDRD equation). 20
We used the Kolmogornov-Smirnov test to check if the distribution of the parameter in the 21
population was Gaussian. If it wasn’t the case, we used a non-parametric method to calculate 22
the reference range according to the CLSI C28-A3 guideline (13). We took the 95% right-23
sided result as the higher limit of normality. 24
3. Results. 1
3.1 Values observed in the population. 2
Our selected population for the establishment of the biological reference interval in adults 3
presented a median TSH level of 1.35 mIU/L (Lowest: 0.366; Highest: 3.30) and a mean free 4
T4 of 14.6 pmol/L (L:10.2 – H: 21.1). The distribution of calcitonin in the population was not 5
normally distributed (p-value <0.0001) and we thus used the non parametric method to 6
evaluate the reference range. The calcitonin levels observed in men were significantly higher 7
than those obtained in women (median: 3.0 vs. 0.6 ng/L, respectively; p-value <0.0001). 8
Ninety-five percent of the male population presented CT levels < 9.8 ng/L (90% CI: 7.4 – 9
12.9 ng/L) whereas 95% of women were below 4.0 ng/L (90% CI: 3.2 – 5.16 ng/L). Taken as 10
a whole, 95% of the reference population presented calcitonin levels below 7.4 ng/L and 11
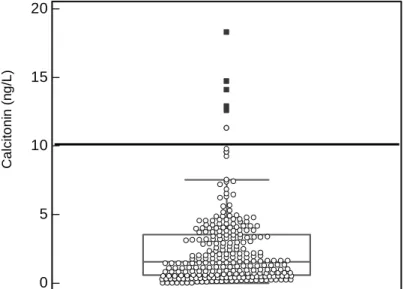
97.5% were <11.3 ng/L. The distribution of the calcitonin levels in our reference population is 12
shown on Figure 1. 13
3.2 Analytical performance. 14
The results of the precision evaluation are shown in Table 1. As can be seen from this Table, 15
repeatability did not exceed 10% and the intermediate precision 11% in the concentration 16
range 2.9 to 1503 ng/L. The functional sensitivity was established at 5.3 ng/L. The kit was 17
correctly traceable against the 2nd IS 89/620, as 1µ IU corresponded to 5.5 pg of Liaison 18
calcitonin (expected: 4.8 – 5.7 pg). Mean recovery was 98.8 ± 4.2 %. The method was found 19
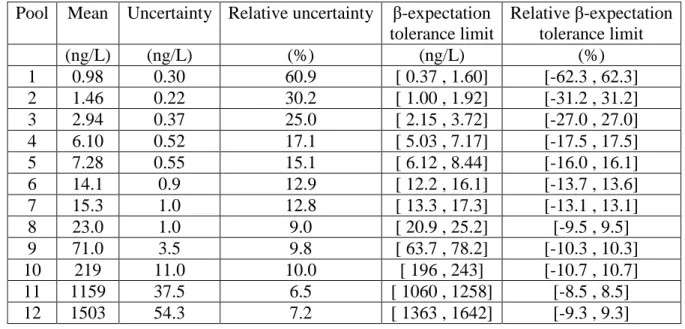
to be linear until the 1/10 dilution. Measurement uncertainty and β-expectation tolerance 20
limits observed on the 12 pools studied is presented in Table 2. Measurement uncertainty was 21
comprised between 25.0 and 7.2%. 22
The β-expectation tolerance intervals were computed at each concentration level with a 23
probability β=95%. This means that, on average, 95% of the future results that will be 24
generated by this method will be included in the computed tolerance intervals. Indeed, 25
tolerance interval methodology is predictive. The method will provide accurate results if the 1
95% β-expectation tolerance interval at each concentration level is fully included in the 2
acceptance limits that were settled at ±20%. Figure 2 illustrates this through an accuracy 3
profile. As shown on this Figure, the method provided accurate results from 5.3 to 1513 ng/L. 4
These two concentration values are the lower and upper quantitation limits, respectively. They 5
thus define the dosing range of the method. Indeed, it is the guaranteed that each future result 6
will be included in the ±20% with a probability of 95%. 7
Among the 14 samples from patients treated by complete thyroidectomy and irradiation, 13 8
presented undetectable (<1 ng/L) levels of CT, one only presenting a value of 1.15 ng/L. 9
We did not observe any hook effect with samples presenting values up to 1 million ng/L, but 10
there was a carry-over, with a blank sample presenting a value of 8 ng/L after being assayed 11
after the 1 million ng/L sample. 12
We had selected 3 samples that presented spurious elevated values with the first version of the 13
kit (17, 43 and 91 ng/L) due to HAMA interference. Indeed, after treatment with the 14
Scantibodies heterophile blocking tubes (HBT: Scantibodies, Santee, CA), their levels 15
returned to <10 ng/L and when determined with the Cisbio kit, these three samples presented 16
a value of respectively 9.3, 2.7 and 0.1 ng/L. In these 3 samples, the Liaison Calcitonin II Gen 17
gave also spurious results (10.1, 71 and 113 ng/L), that returned below 5 ng/L after HBT 18
treatment. 19
3.3 Comparison with Cisbio h-CT 20
We compared the two methods on 250 consecutive patients with the Bland and Altman plot 21
(Figure 3). As can be seen on this figure, there was no systematic bias between the two 22
methods (mean difference = 0.1 ng/L) and the standard deviation of the differences was found 23
to be 2.0 ng/L. We did not find any significant difference with the Wilcoxon test (Median 24
(95% IC): Liaison: 1.62 ng/L (1.32 – 2.03) and Cisbio: 1.53 ng/L (1.31 – 2.0)). In the 45 25
samples obtained after pentagastrin stimulation (range: 9.3 – 838 ng/L), the Bland-Altman 1
plot showed a mean difference of 11.1±49.3 ng/L. No statistical difference was observed 2
between the two methods. 3
4
4. Discussion. 5
We presented here the results of the analytical validation of the DiaSorin Liaison 6
Calcitonin_II-Gen assay. Our results show that this method is sensitive and precise. We also 7
established the measurement uncertainty and we have shown that between 5.3 and 1513 ng/L, 8
95% of the results will be in the ±20% maximum allowable total error. The results of the 9
Liaison Calcitonin_II-Gen are in accordance with those obtained with the Cisbio h-CT, which 10
is the method that had been used to develop the different interpretative guidelines. The 11
Calcitonin_II-Gen is correctly calibrated against the 2nd IS 89/620. However, this new version 12
of the kit is still sensible to HAMA interference: samples presenting values higher than 10 13
ng/L should be treated to remove this interference. 14
In 2007, Bieglmayer et al. had checked the specificity of the first version of the Liaison CT 15
kit by using 15 samples from patients treated by complete thyroidectomy and found 16
detectable calcitonin levels in 9 of them. They concluded that this former assay was prone to 17
non-specific effects causing incorrect CT detection in patients free of thyroid tissue (14). We 18
found here that 1 among 14 thyroidectomized patients presented detectable CT levels. This 19
patient had actually recently been diagnosed as suffering from a seronegative form of 20
polyarthritis. Our tests for RF or HAMA interference are inconclusive at such a low CT level 21
and we could not thus conclude if we observed an analytical interference or a lack of 22
specificity of the assay for this particular patient. Nevertheless, we can conclude that the 23
specificity of the new Liaison CT assay is greatly improved compared to the former one. 24
According to d’Herbomez et al. (15), we defined our “normal” population as a population of 1
adult men and women presenting normal levels of TSH, free T4, and calcium levels. These 2
patients did not present anti-thyroglobulin antibodies and did not suffer from renal 3
insufficiency. Unfortunately, we had no information on the smoking status of these patients. 4
As expected, the results observed were much lower in women, compared to those observed in 5
men. Even if 95% of our “normal” patients presented CT levels below 7.4 ng/L – and thus 6
below 10 ng/L – the 95th percentile of the women population was very low, at 4.0 ng/L. The 7
Liaison Calcitonin_II Gen is thus still lacking sensitivity, as more than 95% of the values 8
observed in women will be responded as “<5.3 ng/L”. 9
Machens et al. have recently claimed for gender-specific CT thresholds to screen for occult 10
MCT (16). On the other hand, Rink et al. have advocated that a cut-off of 15 ng/L (as 11
established with the IBL Calcitonin IRMA or Medipan Calcitonin-IRMA magnum) instead of 12
the “traditional” 10 ng/L for basal CT was able to detect all MTC and reduced false-positive 13
cases (17). The debate on the use of a “clinical” cut-off value or cut-off values derived from 14
apparently healthy people for MTC screening is thus still ongoing. Our study was purely 15
analytical and neither designed nor powered to establish CT “clinical” cut-offs. However, in 16
the light of our results, it could be interesting to re-evaluate the “10 ng/L “cut-off in a large 17
multicentre prospective study, across a wide spectrum of well-validated CT assays. This point 18
is particularly important as the transposition of clinical cut-offs established with one method 19
to other methods have shown important limits (see PTH cut-offs in the former KDOQI 20
Guidelines or GH cut-offs in the diagnosis of growth-hormone deficiency). 21
Finally, whatever the cut-off value(s) to be used, one should not forget that basal serum CT 22
concentrations should always be interpreted according to the clinical context. Indeed, it 23
presents a low predictive positive value of 15.4%, reflecting many false-positive results, 24
potentially leading to unnecessary surgery (18). Nevertheless, CT measurement is still 25
recommended by the European Thyroid Cancer Taskforce in the initial diagnostic evaluation 1
of thyroid nodules (19) and a recent American study concluded that routine CT screening for 2
MTC in the patients with thyroid nodules could be as efficient as widely accepted screening 3
programs, like measurement of TSH, colonoscopy and mammography screening (20). 4
5 6
Conflicts of interest: none to declare. 7
8 9 10 11
Table 1: Precision observed on twelve serum pools. 1
Pool n Mean Within-run Total
(ng/L) SD CV(%) SD CV(%) 1 30 0.98 0.27 27.6 0.29 29.6 2 30 1.46 0.19 13.0 0.21 14.4 3 30 2.94 0.27 9.2 0.35 11.9 4 30 6.10 0.51 8.4 0.51 8.4 5 30 7.28 0.42 5.8 0.52 7.1 6 30 14.1 0.8 5.7 0.9 6.4 7 30 15.3 1.0 6.5 1.0 6.5 8 30 23.0 1.0 4.3 1.0 4.3 9 30 71.0 3.4 4.8 3.4 4.8 10 30 219 9.2 4.2 10.5 4.8 11 30 1159 10.5 0.9 34.4 3.0 12 30 1503 18.9 1.3 50.0 3.3 2
Table 2: Measurement uncertainty and β-expectation tolerance limits observed on 12 pool 1
samples. 2
3
Pool Mean Uncertainty Relative uncertainty β-expectation tolerance limit Relative β-expectation tolerance limit (ng/L) (ng/L) (%) (ng/L) (%) 1 0.98 0.30 60.9 [ 0.37 , 1.60] [-62.3 , 62.3] 2 1.46 0.22 30.2 [ 1.00 , 1.92] [-31.2 , 31.2] 3 2.94 0.37 25.0 [ 2.15 , 3.72] [-27.0 , 27.0] 4 6.10 0.52 17.1 [ 5.03 , 7.17] [-17.5 , 17.5] 5 7.28 0.55 15.1 [ 6.12 , 8.44] [-16.0 , 16.1] 6 14.1 0.9 12.9 [ 12.2 , 16.1] [-13.7 , 13.6] 7 15.3 1.0 12.8 [ 13.3 , 17.3] [-13.1 , 13.1] 8 23.0 1.0 9.0 [ 20.9 , 25.2] [-9.5 , 9.5] 9 71.0 3.5 9.8 [ 63.7 , 78.2] [-10.3 , 10.3] 10 219 11.0 10.0 [ 196 , 243] [-10.7 , 10.7] 11 1159 37.5 6.5 [ 1060 , 1258] [-8.5 , 8.5] 12 1503 54.3 7.2 [ 1363 , 1642] [-9.3 , 9.3] 4
Figure 1: Box-and-whisper plot of the calcitonin values observed in our reference population 1
(267 Individuals) with the Liaison Calcitonin_II-Gen. The central box represents the 2
values from the lower to upper quartile (25 to 75 percentile). The middle line represents 3
the median. The “10 ng/L” cut-off is highlighted by a solid line 4 5 20 15 10 5 0 A ll C a lc it o n in (n g /L ) 6
Figure 2: Accuracy profile of the Liaison Calcitonin_II-Gen assay. When the β-1
expectation limits (broken lines) are comprise between the maximum total allowable 2
error (settled here at ±20%), the method is considered as valid. 3 4 5 . 6 Amount (ng/L) 7
Figure 3: Bland and Altman plot for calcitonin results obtained in 250 consecutive patients
1
with the Liaison Calcitonin II Gen and the Cisbio h-CT. Results are given in ng/L.
2 3 4 5 0 5 10 15 20 25 15 10 5 0 -5 -10
AVERAGE of Liaison Calcitonin II Gen and CIS h-CT
L ia is o n C a lc it o n in I I G e n C IS h -C T Mean 0,1 -1.96 SD -3,9 +1.96 SD 4,0
Legend of the Figures: 1
Figure 1: Box-and-whisper plot of the calcitonin values observed in our reference population 2
(267 Individuals) with the Liaison Calcitonin_II-Gen. The central box represents the values 3
from the lower to upper quartile (25 to 75 percentile). The “10 ng/L” cut-off is highlighted by 4
a solid line. 5
Figure 2: Accuracy profile of the Liaison Calcitonin_II-Gen assay. When the β-expectation 6
limits (broken lines) are comprise between the maximum total allowable error (settled here at 7
±20%), the method is considered as valid. 8
Figure 3: Bland and Altman plot for calcitonin results obtained in 250 consecutive patients
9
with the Liaison Calcitonin II Gen and the Cisbio h-CT. Results are given in ng/L.
10 11 12 13 14 15
1
Reference List 2
3
1. Barbot N, Calmettes C, Schuffenecker I, Saint-Andre JP, Franc B, Rohmer V et al. 4
Pentagastrin stimulation test and early diagnosis of medullary thyroid carcinoma using 5
an immunoradiometric assay of calcitonin: comparison with genetic screening in 6
hereditary medullary thyroid carcinoma. J Clin Endocrinol Metab 1994;78:114-20. 7
2. Elisei R, Bottici V, Luchetti F, Di CG, Romei C, Grasso L et al. Impact of routine 8
measurement of serum calcitonin on the diagnosis and outcome of medullary thyroid 9
cancer: experience in 10,864 patients with nodular thyroid disorders. J Clin Endocrinol 10
Metab 2004;89:163-8. 11
3. Motte P, Vauzelle P, Gardet P, Ghillani P, Caillou B, Parmentier C et al. Construction 12
and clinical validation of a sensitive and specific assay for serum mature calcitonin 13
using monoclonal anti-peptide antibodies. Clin Chim Acta 1988;174:35-54. 14
4. Wion-Barbot N, Schuffenecker I, Niccoli P, Conte-Devolx B, Lecomte P, Houdent C et 15
al. Results of the calcitonin stimulation test in normal volunteers compared with 16
genetically unaffected members of MEN 2A and familial medullary thyroid carcinoma 17
families. Ann Endocrinol (Paris) 1997;58:302-8. 18
5. Niccoli P, Wion-Barbot N, Caron P, Henry JF, de MC, Saint Andre JP et al. Interest of 19
routine measurement of serum calcitonin: study in a large series of thyroidectomized 20
patients. The French Medullary Study Group. J Clin Endocrinol Metab 1997;82:338-41. 21
6. Vierhapper H, Raber W, Bieglmayer C, Kaserer K, Weinhausl A, Niederle B. Routine 22
measurement of plasma calcitonin in nodular thyroid diseases. J Clin Endocrinol Metab 23
1997;82:1589-93. 24
7. Karges W, Dralle H, Raue F, Mann K, Reiners C, Grussendorf M et al. Calcitonin 25
measurement to detect medullary thyroid carcinoma in nodular goiter: German 26
evidence-based consensus recommendation. Exp Clin Endocrinol Diabetes 27
2004;112:52-8. 28
8. Cavalier E, Carlisi A, Chapelle JP, Delanaye P. Analytical quality of calcitonin 29
determination and its effect on the adequacy of screening for medullary carcinoma of 30
the thyroid. Clin Chem 2008;54:929-30. 31
9. Ramachandran R, Benfield P, Dhillo WS, White S, Chapman R, Meeran K et al. Need 32
for revision of diagnostic limits for medullary thyroid carcinoma with a new 33
immunochemiluminometric calcitonin assay. Clin Chem 2009;55:2225-6. 34
10. EURACHEM / CITAC Guide CG 4; Quantifying Uncertainty in Analytical 35
Measurement, Second Edition. 2000. 36
Ref Type: Patent 37
11. International Organization for Standardization (ISO). ISO/DTS 21748 Guide to the use 38
of repeatability, reproducibility and trueness estimates in measurement uncertainty 39
estimation. 2003. Geneva. 40
12. Viswanathan CT, Bansal S, Booth B, DeStefano AJ, Rose MJ, Sailstad J et al. 1
Quantitative bioanalytical methods validation and implementation: best practices for 2
chromatographic and ligand binding assays. Pharm Res 2007;24:1962-73. 3
13. Horowitz GL. CLSI/NCCLS C28-A3: Defining, Establishing, and Verifying Reference 4
Intervals in the Clinical Laboratory; Approved Guideline, Third Edition, C28A3E. 1-5
11-2008. 6
Ref Type: Data File 7
14. Bieglmayer C, Vierhapper H, Dudczak R, Niederle B. Measurement of calcitonin by 8
immunoassay analyzers. Clin Chem Lab Med 2007;45:662-6. 9
15. D'Herbomez M, Caron P, Bauters C, Cao CD, Schlienger JL, Sapin R et al. Reference 10
range of serum calcitonin levels in humans: influence of calcitonin assays, sex, age, and 11
cigarette smoking. Eur J Endocrinol 2007;157:749-55. 12
16. Machens A, Hoffmann F, Sekulla C, Dralle H. Importance of gender-specific calcitonin 13
thresholds in screening for occult sporadic medullary thyroid cancer. Endocr Relat 14
Cancer 2009;16:1291-8. 15
17. Rink T, Truong PN, Schroth HJ, Diener J, Zimny M, Grunwald F. Calculation and 16
validation of a plasma calcitonin limit for early detection of medullary thyroid 17
carcinoma in nodular thyroid disease. Thyroid 2009;19:327-32. 18
18. Hasselgren M, Hegedus L, Godballe C, Bonnema SJ. Benefit of measuring basal serum 19
calcitonin to detect medullary thyroid carcinoma in a Danish population with a high 20
prevalence of thyroid nodules. Head Neck 2010;32:612-8. 21
19. Pacini F, Schlumberger M, Dralle H, Elisei R, Smit JW, Wiersinga W. European 22
consensus for the management of patients with differentiated thyroid carcinoma of the 23
follicular epithelium. Eur J Endocrinol 2006;154:787-803. 24
20. Cheung K, Roman SA, Wang TS, Walker HD, Sosa JA. Calcitonin measurement in the 25
evaluation of thyroid nodules in the United States: a cost-effectiveness and decision 26
analysis. J Clin Endocrinol Metab 2008;93:2173-80. 27
28 29