HAL Id: hal-01587280
https://hal.archives-ouvertes.fr/hal-01587280
Submitted on 14 Sep 2017
HAL is a multi-disciplinary open access
archive for the deposit and dissemination of
sci-entific research documents, whether they are
pub-lished or not. The documents may come from
teaching and research institutions in France or
abroad, or from public or private research centers.
L’archive ouverte pluridisciplinaire HAL, est
destinée au dépôt et à la diffusion de documents
scientifiques de niveau recherche, publiés ou non,
émanant des établissements d’enseignement et de
recherche français ou étrangers, des laboratoires
publics ou privés.
Refining visual activity recognition with semantic
reasoning
Nathan Ramoly, Vincent Vassout, Amel Bouzeghoub, Mounim El Yacoubi,
Mossaab Hariz
To cite this version:
Nathan Ramoly, Vincent Vassout, Amel Bouzeghoub, Mounim El Yacoubi, Mossaab Hariz. Refining
visual activity recognition with semantic reasoning. IEEE 31st International Conference on Advanced
Information Networking and Applications (AINA 2017), Mar 2017, Taipei, Taiwan. pp.720 - 727,
�10.1109/AINA.2017.98�. �hal-01587280�
Refining Visual Activity Recognition with Semantic Reasoning
Nathan Ramoly, Vincent Vassout, Amel Bouzeghoub, Mounim A. El Yacoubi, Mossaab Hariz SAMOVAR
T´el´ecom SudParis, CNRS, Universit´e Paris-Saclay Evry, France
{nathan.ramoly,amel.bouzeghoub,mounim.el yacoubi,mossaab.hariz}@telecom-sudparis.eu [email protected]
Abstract—As elderly care is getting more and more impor-tant, monitoring of activity of daily living (ADL) has become an active research topic. Both robotic and pervasive computing domains, through smart homes, are creating opportunities to move forward in ADL field. Multiple techniques were proposed to identify activities, each with their features, advantages and limits. However, it is a very challenging issue and none of the existing methods provides robust results, in particular in real daily living scenarios. This is particularly true for vision-based approaches used by robots. In this paper, we propose to refine a robot’s visual activity recognition process by relying on smart home sensors. We assert that the consideration of further sensors and the knowledge about the target user together with the semantic by means of an ontology and a reasoning layer in the recognition process, has improved the existing works results. We experimented through multiple activity recognition scenarios with and without refinement to assess the relevance of such a combination. Although our tests reveal positive results, they also point out limits and challenges that we discuss in this paper.
Keywords- Ontology; Activity recognition; Vision; Robot; Smart home; Pervasive environment
I. INTRODUCTION
It is a global tendency for population to age, therefore the need for elder care at home has become a significant and trending topic. In current years, we observe two main trends in the attempt to help elderly in their everyday life: the usage of smart homes and/or the adoption of personal robots. Smart devices, such as smart fridges, TVs, cameras but also sensing carpets or motion sensors are becoming increasingly popular. Such devices are used by many appli-cations, however healthcare is undoubtedly a core applica-tion of this domain. Having said that, robots for domestic applications are not yet common, but multiple companies, including Asus (zenbo.asus.com) or Blue Frog Robotics (www.bluefrogrobotics.com), are entering this market.
The purpose of these robots is to keep company, inform, monitor and perform simple tasks. Understanding what the user is doing is an essential feature for medical staff, as they would know what is happening and when to intervene, for instance, if the user has fallen over. Monitoring activities of daily living (ADL) of users by a robot within a smart home is a main issue of this work.
As a matter of fact, monitoring activities is currently a significant challenge. Many solutions and methods were proposed to identify users’ activity in various situations. Some contributions deal with raw data from a specific sensor while others work on reasoning with heterogeneous types of sensors data. One of the methods to recognize activities is vision, which is a quite interesting issue from a robot perspective. Indeed, robots cameras (2D or 3D) seem to be the best option to recognize an activity as they are the main and most common sensors. However, activity recognition techniques are rarely perfectly accurate in real life scenarios and can lead to erroneous results – in particular vision-based approaches, since, depending on the camera orientation and/or the light intensity, the exploitation of a video sequence may be simply impossible. To address this issue, two directions may be followed: the first one is to improve the existing vison-based algorithms, while the second is to enhance the vision-based recognition with further data and analysis. This work focuses on the latter direction. The main idea is based on a collaboration between a robot and a smart home in order to improve the efficiency of the activity recognition. Our contribution may be summarized as following: we aim to improve the human activity recognition made by a robot, using both data coming from the available sensors and the knowledge about the user. Indeed, instead of working by itself, the robot communicates with a home’s server that gathers and processes data provided by smart devices. This server communicates with various types of sensors and uses an ontology to carry the knowledge and infer further data.
The combination between a robot and a smart home was experimented in an equipped room and a Nao robot with sev-eral individuals. It aims to measure not only the performance of the activity recognition of the robot by itself, but also the gain obtained by enhancing its results. These experiments provided promising results however simultaneously pointed out limits and challenges to overcome.
The rest of the paper is organized as follows: Firstly, in order to illustrate our needs and the problematic, we set up four scenarios that are presented in section II. Our contri-bution is detailed in section III, followed by an explanation
of our experiments and a discussion of obtained results in section IV. A short state of the art is then presented in section V. Finally, a conclusion and some future prospects end the paper.
II. MOTIVATING SCENARIOS
In order to illustrate the limit of vision-based activity recognition and the advantage of the usage of our approach, we set up a scenario divided in four scenarios to underline the problem a robot could encounter during its lifetime. Firstly, let us settle the context of the scenario: Johan is 65-years-old-men. He lives in a smart apartment with his personal robot, Nono. The house is equipped with motion sensors, door opening sensors and a central server. Further-more, Johan’s phone can communicate with the server. Nono helps Johan in his everyday life and monitors his activities for medical observation. Nono is able to recognize the following activities by looking at Johan’s gestures:phoning, applauding, remote controlling, opening door, walking, closing door, falling, drinking and sitting. However, in some cases, the robot has difficulties to identify properly what its master is doing. Nevertheless it can rely on the smart environment.
In this context, we present the four scenarios that could occur.
A. Scenario 1: confusion between ”phoning” and ”drink-ing”
Johan wants to call his best friend, thus, he takes his phone and put it to his ear. Nono is watching Johan while trying to figure out what he is doing. However, Nono is not sure if Johan raised his arm for ”phoning” or for ”drinking”. It is not able to decide properly on its own. However, the phone informs the server that it has perceived a movement. Nono asks the server to correct the robot’s analysis. With the phone data, Nono confirms the recognition of the ”phoning” activity.
B. Scenario 2: confusion between ”remote controlling” and ”phoning”
Johan is a social network addict. He checks his no-tifications on his phone (included in ”phoning” activity). However, the gesture he does is interpreted as a ”remote controlling” activity by Nono, as the gestures are similar. Johan can be located thanks to the motion sensors positioned in the house. As he is currently in the corridor, and not in the living room (i.e. there is no TV nearby) the server is able to invalidate Nono’s interpretation.
C. Scenario 3: confusion between ”opening door” and ”walking”
Johan is opening the kitchen’s door as he wants to go out. To do so, Johan walks towards the door. This is confusing for Nono, as it cannot choose between the ”opening door” and
”walking” activities. The door is equipped with an opening sensor. By asking the server, Nono obtains the proper interpretation: as the door’s sensors has been triggered, Johan is ”opening door”. If not, he would be considered to be ”walking”.
D. Scenario 4: activities enrichment
By reinforcing an activity recognition process with data from the environment, it is not only possible to correct the identification, but it is also possible to recognize new and more precise activities that are not distinguishable otherwise. The following scenario illustrates this feature:
Johan is sitting and Nono detects this activity. However, this activity is quite broad, for example, Johan can be sitting in order to watch TV or having a lunch. The house’s server carries Johan’s agenda and knows his habits. Nono tells the server that Johan is ”sitting”. Knowing that, the server also noticed that Johan is located in the kitchen and that he usually eat around 8:00pm, the current time. Thus, it concludes that Johan is ”eating” and it sends this updated result to Nono.
III. CONTRIBUTIONS
In this section, we describe the core of our solution. Our approach relies on a server that centralizes data from sensors and other sources. This server uses an ontology to carry its acquired knowledge and to refine activity recognition from the robot.
Our system operates with three main components:
• The robot: it observes the user and notifies him/her if necessary. It embeds the recognition algorithm pro-posed by Yacoubi et al.[1].
• The sensors and other data sources: this includes motion sensors, cellphone, user’s calendar, the time, etc. Each of these sources provides data about the current context of the environment.
• The server: it centralizes information from the robot and data sources in order to refine the robot’s analysis. It runs on a dedicated computer. To interact with other components, the server relies on specific interfaces along with the multiple devices.
The overall system can be described as a seven step process, as depicted in Figure 1:
1) Observation: The robot looks at the user’s gesture and captures a short video.
2) Providing activity probability distribution: The robot analyzes the video and classifies it into activities using a state of the art vision-based activity recogni-tion solurecogni-tion [1]. It sends the result, i.e. activities asso-ciated with probabilities, to the server for refinement. 3) Acquiring context data: As soon as the server re-ceives the information from the robot, it starts the refinement process and queries the data sources. These
sources provide context data that are received, format-ted and stored in the ontology. Note that the sources are working in pull mode: they do not provide data when not being asked to, in other words, they are used only when the robot enters the process of activity recognition and they can be used for other applications in the meantime.
4) Storing in the ontology: Context data and activities provided by the environment and the robot are format-ted and inserformat-ted in an ontology.
5) Reasoning: By using rules, reasoning is applied to en-hance the context knowledge. This feature is discussed in Section III-E.
6) Refining activity distribution: By using the context knowledge carried by the ontology, probabilities are adjusted and sent back to the robot. This process is described in a section III-F.
7) Notification: The robot notifies the user or the medical staff of the activities it believes the user is doing after the correction using the context information.
Figure 1: The architecture of our proposition From a technical point of view, communications are obviously working as a client/server architecture, where the devices (including the robot) are clients. They use the TCP protocol to ensure the reliability of the communication. The server relies on multiple threads to interface with the devices. In particular, one thread is specifically dedicated to the robot to handle communications in both ways. The server launches one thread for each data source. The way the context data is provided is described in the next sections.
The following sections will discuss and describe in detail each step.
A. Observation
This section describes how the robot analyzes the user’s activities from his/her gesture. It corresponds the step 1 in Figure 1.
In this work, we have used the proposition of El-Yacoubi et al [1], [2] that consists of a vision-based process to recognize activity from video stream obtained from robots’ 2D cameras. It analyzes the gesture of the user and assigns it to possible activities. It uses a video stream as an input
and provides as a result a list of activities each associated with a probability. The aforementioned solution is a four step process that relies on several supervised learning algorithms: 1) DenseTrack is an algorithm that analyses an image
stream to provide pixel trajectories (tracking). 2) K-means algorithm is used to group the trajectories
into a fixed set of prototypes or clusters.
3) Bag of words algorithm is used to compute the frequency of ’visual word’ thanks to the clusters generated by K-means.
4) Support Vector Machine (SVM) The bags are clas-sified using a trained SVM.
This approach gave decent results on benchmarks, but it en-counters difficulties in more realistic scenarios, as observed in our experiments (see Section V). As this is not the core of this work, we won’t describe this approach here, you can however find out more information in these papers [3], [1], [2].
It is important to notice that our approach could work with any other activity recognition solutions providing a probability distribution of activities.
B. Providing activity probability distribution
The previously presented vision-based algorithm provides and sends a list of activities to the server. It is depicted as number 2 in Figure 1. Each activity is associated with a probability. The list is formatted as an array of pair activity and probability. For example: {(eating, 0.05), (phoning, 0.1), (walking, 0.01), ...} .
C. Acquiring context data
This section corresponds to the step 3 in Figure 1. Once the server receives the robot’s recognition results, it enters the refining process and it immediately queries all the sources it is connected to in order to acquire the current context knowledge. Sources are various and include sensors, user profile and/or clock.
Moreover, sensors are also diverse. During our work, we used cellphone, motion sensors and door opening sensors, however other types of sensors, such as microphone or beacons are usable. Such a variety of sensors can gen-erate a problem of heterogeneity: each sensor have its own technology and protocol, thus they require a dedicated integration. In our work, motion and opening sensors use ZigBee technologies1 and provide data that cannot be used as is: they only send a ’signal’ (or event) when triggered. Therefore, we set up a dedicated computer equipped with a ZigBee antenna with a program interfacing our system with the sensors. This program interacts with the sensors, gets the raw events, transforms them and communicates the values to our system’s server. The cellphone was much
easier to use as it can communicate through the WiFi. We designed an application that monitors the phone’s inertial unit and communicates directly with the server when a raising movement is detected. As for user profile and clock, they are actually provided by programs running on the same computer as the server, but they could be deported, if necessary, since they communicate through TCP/IP protocol, similarly as the sensors. The user profile relies on an expert defined knowledge base.
Sources transmit the observed data to the server by sending a name and a value. The name allows to identify the parent sensor and the type of the data. Please note that we only consider one sensor for each type, thus, in our case, the name of the sensor is actually equivalent to its type, for example a sensor name hence also the type is ”motion sensor”. As a consequence, the type of the data can be found thanks to the name of the sensor which had sent it. The value, if exists and/or is required, corresponds to its name. For example, for a inertial unit the value is a double number, bounded between 0 and 1. Once received, the server transforms this information as RDF triples (see Figure 3) and stores them in the ontology. The structure of the ontology and its role are addressed in the next section.
D. Storing in the ontology
This section discuss the step 4 in Figure 1.
Figure 2: Class hierarchy of the ontology with data prop-erties
By the term context we refer to any information that can be used to char-acterize the situation of an entity, where an entity can be a person, a place or a (physical or compu-tational) object [4]. Con-sidering that a context is a specific type of knowl-edge, it can be modeled as an ontology. Indeed, ontology-based models of context have several fea-tures: (i) enable representing complex context knowledge, (ii) provide a formal semantics to context knowledge, which supports the sharing and/or integration of context informa-tion and (iii) support reasoning to infer higher level data. For these reasons, we use an ontology to store the context. We designed an ontology with Prot´eg´e2 software. The structure of the ontology is depicted in Figure 2.We defined multiple classes each with their properties. Moreover, the representation includes activities with their name and prob-ability, context data (sensor) and user habits.
2http://protege.stanford.edu/
Figure 3: Examples of in-serted RDF subgraphs
All of these data are pro-vided at the runtime: at the beginning of the refine-ment process the ontology is empty, i.e. with no instances. The ontology is filled due to the data received by the server from the robot and sources. The server’s inter-faces transform the received data into RDF triples (i.e. subgraphs) and add these new instances in the ontology. Examples can be found in Figure 3, for the insertion of both the activity Phoning and the context data Phone linear acceleration.
E. Reasoning
Reasoning process is represented as step 5 in Figure 1. Once the ontology is filled, it is possible to reason on it in order to generate new data. To do so, we apply rules to check conditions and add content accordingly. In our work, we mainly use these rules to infer new and more specific activities that the robot could not identify. By using more data on top of the initial work of the robot, it is possible to detect more precise activities. They are actually derivations of activities, for example, ’sitting’ can be refined into ’watching TV’ or ’eating’, as depicted in scenario 4. Rules are used to infer these more precise activities in order to be inserted in the ontology. Simplified rules written in Jena3 can be found in the following examples:
• If ”sitting” is the most reliable activity and the user is located in the living room (through a motion sensor), then the user is ”watching TV”:
rule1: (?act is-a Activity) (?act a label ”sitting”) (?act a proba ?prob) (?anyact a proba ?anyprob) greaterThan(?prob ?anyprob) (?usr located-in ?room) (?room is-a RoomTV) → (?newAct is-a Activity) (?newAct a label ”watching TV”)
• If ’sitting’ is the most reliable activity, the user is
located in the kitchen (through a motion sensor) and the current time matches the user schedule for dinner/lunch, then the user is ”eating”:
rule2: (?act is-a Activity) (?act a label ”sitting”) (?act a proba ?prob) (?anyact a proba ?anyprob) greaterThan(?prob ?anyprob) (?usr located-in ?room) (?room is-a RoommMeal) (?meal time meal ?time) equal(”cur time” ?time) → (?newAct is-a Activity) (?newAct a label ”eating”)
With the data stored and improved, our system can analyze the context to refine probabilities of the activities.
F. Refining activity distribution
The described process matches the step 5 in Figure 1. In order to correct the probabilities, the context is ana-lyzed and activities are adjusted accordingly. This is done
by applying rules. In our work, we consider three cases that match our scenarios:
• If the phone’s inertial unit exceeds a given threshold – increase ”phoning” probability,
• If a movement was detected through a motion sensor located in a room with a TV – increase ”remote controlling” probability,
• If the opening door sensor was triggered – increase ”opening door” probability.
Obviously, further rules can be added. The probabilities adjustments and the rules are provided by the designer.
G. Notification
Once the probabilities are updated and new tasks are added (if applicable), the server sends back the result to the robot, as depicted in step 6 of Figure 1. The results are formatted as a list of activities associated with a probability, using the format utilized by the robot during the first recog-nition phase. With this new distribution the robot selects the most reliable activity and notifies the operator who is in charge of monitoring the user.
IV. EXPERIMENTS
In this section we describe how the experiments were conducted and discuss the results. These tests aim to measure the performance of the vision-based activity recognition and to confirm it can be improved by refining activity identification with sensors. Firstly, we detail our testing environment. Then, we briefly describe our protocol. Finally, we present and discuss our results.
We made our experiments using the Hadaptic platform4. This platform consists of a room equipped with multiple sensors and devices. Within Hadaptic platform, we used the following devices for our tests: 3 motion sensors, 1 opening sensors, Android based phone (multiple phones where used, but only one at the same time), 2 computers, one for our system’s server, the other to manage ZigBee-based sensors, 1 ZigBee antenna, to communicate with motion and opening sensors, WiFi hotspot, for communication between robot, computers and phones.
Concerning the robot, we used the famous Nao H25 robot [5]. It embeds the activity recognition software presented in Section II-B. Concerning the test subjects, we asked 12 volunteers from the laboratory to participate in our experiments. Volunteers profile are various and each one has his/her own way to execute the demanded actions.
A. Protocol
Experiments were conducted as follows. The robot was installed in the room, in most cases it was sitting (as in Fig-ure 4) and facing the scene where the action was performed.
4http://hadaptic.telecom-sudparis.eu/fr/introduction/
Figure 4: Example of experiments for a ”remote controlling” scenario Please note that for
these experiments, the robot was not moving (similar experiments were conducted with a legless T14 Nao). Each volunteer was asked to come
in front of the robot and to do a gesture matching one scenario. The participants were asked to make a gesture for each of these three actions (corresponding to the three scenario presented in section II) : 1) make a phone call (cf. Figure 5); 2) activate the remote control (cf. Figure 4) ; 3) open the door.
One test iteration consists of the following protocol: 1) The Nao opens the process by telling when the process
starts and when the video acquisition starts.
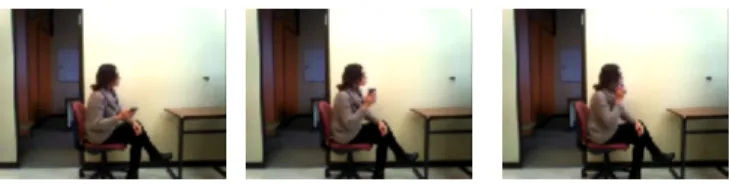
2) Once Nao announced the beginning of the record, the user does the gesture. A two-second video of the action is captured by the robot. An example of a recording can be found in Figure 5.
3) Nao applies its own activity recognition algorithm. This step can take up to 15 seconds due to the heavy process of the visual recognition. Once Nao finishes, it will send its result to the server.
4) The server stores the result and queries the sensors in order to refine the activity recognition.
5) Once all data are collected, the server computes a new activity distribution and provides it to Nao.
6) Nao announces the identified activity, with and without refinement. All results are stored in the server to be recovered for analysis (see next Section).
You can find video-examples through the link: http://nara.wp.tem-tsp.eu/vision-activity-recognition/
Figure 5: Example of a video recorded and used for activity recognition by Nao
The process is repeated 10 times per scenario and per volunteer. In other words, each volunteer participates in 3 ∗ 10 instances. On the overall, 120 records were obtained for each gesture. In every case, the results (with and without refinement) were analyzed and are reviewed in the next Section.
B. Results and discussions
The experiments helped to understand the performance of the vision-based recognition algorithm and the impact of our approach.
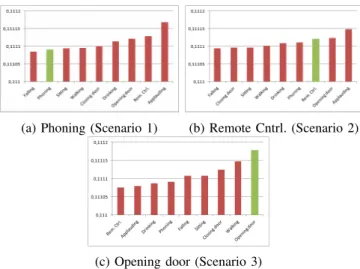
(a) Phoning (Scenario 1) (b) Remote Cntrl. (Scenario 2)
(c) Opening door (Scenario 3)
Figure 6: Average resulting distribution without refinement The green column matches the observed action
(a) Phoning (Scenario 1) (b) Remote Cntrl. (Scenario 2)
(c) Opening door (Scenario 3)
Figure 7: Average resulting distribution after refinement The green column matches the observed action
Firstly, let us look at the result of the activity recognition without refinement. Figure 6 depicts the average activity distribution, provided by the robot without refinement for one given scenario. The charts show the ordered probability for each activity. The activity to recognize (i.e. the one matching the user action) is associated with the green col-umn. Firstly, it is noticeable that the distribution is very tight: provided probabilities are close to each other. This result points out the difficulty for the vision-based algorithm to have a clear and strong classification by itself. Nevertheless, differences are observable to a certain scale and they provide an order between activities. Having said that, it is important to note that it may not be enough – Figure 8 shows the successful recognition rates: with 6.40% for the ”remote controlling” scenario, 53.97% for the ”opening door” and 6.35% for the ”phoning” one. The results are quite poor, but have to be put in the perspective. Results are varying
according to the scenario. The ”opening door” scenario provides the best results. As we can see in Figure 6c, in most cases the robot identifies properly the activity, but still makes confusion in one out of two cases. With only 6.40% successful recognition rates, the robot seems to have difficulty to recognize the ”remote controlling” activity. However, in Figure 6b, in average, the proper activity is recognized in third place, behind the ”opening door” and ”applauding” activities. This is clearly due to a gesture confusion: all top three activities are illustrated by the rise of an arm and thus the difference can be tricky to distinguish. The phone scenario has very poor results. As we can see in Figure 6a, it is almost the last activity in the distribution while being the one to be observed. This result underlines the unreliability of the vision-based recognition in some cases. We suppose that the robot was not trained enough for this scenario and thus we emphasize the importance and the difficulty of learning of a proper vision-based activity recognition algorithm. Compared to previous works, it is important to notice that the experiments are not based on a given data set: gestures are varied, unpredictable and close to real case scenarios. Through these results, we can clearly see the weaknesses of this approach. We will now study the results obtained after applying the refinement process.
Figure 8: Successful activity recognition rate per scenario Blue: without refinement Red: with refinement
Figure 7 shows the activity distribution pro-vided by the server af-ter refinement with fur-ther context data. As we can see, for each sce-nario, after adjustment the observed activity is on average the most prob-able one, but with a much higher probability. This difference can be explained in two ways. Firstly, as expressed in the previous paragraph, raw activity distribution is very tight: every adjustment on a different scale can lead to such differences. In a more complete scenario, we can imagine a more disparate distribution due to the impact of multiple sensors at the same time, but in such a case, the role of the vision-based recognition seems weak. The second explanation is the ”semantic” carried by the sensors. In fact, sensors themselves can give strong hint about what is going on. For example, the opening door sensors imply themselves almost certainly that the door is open. Thus, it greatly impacts the probability (Figure 7c). The same goes for the ”phoning” activity, as we can notice in Figure 7a. The correlation between sensors and activities explains the gap of probability. Moreover, in the ”remote controlling” scenario (Figure 7b), the motion sensor has less impact as it is not specifically linked to this activity. Concerning the ”opening door” and the ”remote controlling”
scenario, the refinement allows to confirm the detected activity and/or to remove an ambiguity. However, as for the ”phoning” scenario, while the vision provided a bad distribution, the refined result is actually correct. Thus in this case, we can assert that the activity recognition can be actually performed without the vision process. This finding raises the question of the relevance of using vision-based algorithm when other solutions are available. Putting aside the gap between refined and non-refined probabilities, the results show that refinement allows a proper recognition.
Figure 8 shows the activity recognition success rate for both cases – with and without refinement. As previously ex-plained, raw vision-based activity recognition had mediocre results while The refined ”remote controlling” scenario has 71% successful recognition rate. The two others were almost reaching 100% of recognition (when correction was ap-plied). This is again explained by the impact of the sensors. These results have also to be put into perspective – in a real complete scenario, these rates would not be equally good. In this experiment, we aimed to test the refinement facing one single action with a few sensors. In a real application with much more context data that can be conflicting, confusion would be more present. Nevertheless, it shows the gain we can have by combining and/or relying on smart sensors.
Figure 9 presents the noise, silence, recall and precision of the refinement process. These notions are defined as follows:
• Noise: Number of incorrect results provided, divided by the total number of results. Opposite of the precision.
• Silence: Number of correct results not provided, di-vided by the total number of existing correct results. In our case, it is the proportion of distribution that were not refined due to missing data.
• Recall: Number of correct results provided, divided by the total number of existing correct results. It can be seen as the success rate considering the case the correction was not applied.
• Precision: Number of correct results provided, divided by the total number of results. It is almost similar to the success rate depicted in Figure 8.
Although correction is efficient, there were some instances where it has not been applied properly, in particular for the ”remote controlling” and ”phoning” scenarios, which have respectively a recall of only 67% and 77%. In fact, we observed that the sensors sometimes do not detect the action: even if they are reliable for activity recognition, they are not flawless. This points out an issue that was not addressed in this paper, namely sensors uncertainty.
To summarize these experiments, we can assert that combining vision and sensors from the environment allows to provide more reliable results. But, our main conclusion is that using both approaches at the same time is not always the best solution. In some cases, the vision process could be avoided, preventing huge costs in time and resources. In fact, we believe that selecting a method to recognize
activities instead of combining them in any case would be a better solution. Typically in this case, the robot could select either the vision, the smart environment, or both of them, depending on the current case. This is obviously a challenging, yet promising, issue to tackle.
Figure 9: Noise, Silence, Re-call and Precision per scenario Nevertheless,
vision-based recognition is essential for robots that operate autonomously and where sensors are not always available. However, as we have seen through the experiments, they require a strong training that has to be adapted to the
environment the robot evolves in: learning from a dataset may not be enough and having a learning process at runtime in the robot’s house seems essential. Using sensors can allow an unsupervised learning at runtime. In fact, as some sensors, for example a phone, are highly correlated to one particular activity, such as ”phoning”, they could indicate to the robot what activity is occurring, allowing the robot to adjust its knowledge with the new labeled video samples. In other words, using the smart environment to enhance the robot vision learning process is an interesting issue.
Lastly, as we pointed out, both the vision-based and the sensor-based approaches are not perfect and sometimes are prone to mistakes. In pervasive environments, uncertainty is a key issue. Hence, we need to reinforce our work towards this direction. The state of the art provides multiple solutions we could use to enhance our combination.
V. RELATED WORK
In the literature, Ye et al.[6] provided a large and complete review of activity/situation recognition techniques. They divided the techniques into two categories: learning based approaches and specification based approaches. The first relies on the learning algorithm, supervised or unsupervised, in order to determine how to classify activities. These techniques mostly rely on low level or raw data, thus, they can also be seen as ’data driven’ techniques. They include the following: Bayesian Models, Markov Models, Decision Tree, Artificial Neural Networks, Support Vector Machine and others. The solution proposed by El-Yacoubi et al.[1] enters in this category. On the other hand, specification based techniques use a knowledge provided by an expert. In most cases, the semantic of the data is high and rea-soning friendly. They can be seen as ’knowledge-oriented’ techniques. Among these methods, you can find ontology-based approaches, Logic or evidence theory. Ye et al.[6] analyzed and discussed all these techniques. One of their main conclusion was the need for hybrid approaches. In fact, each category of the techniques has its advantages
and limits. Proposing combination, i.e. a hybrid approach, would be beneficial by using the advantages of both methods while overcoming their limits. Yet, such methods are not commonly addressed. Our work is exactly positioned as a hybrid approach: it combines a learning based technique, using vision-based algorithm, with reasoning and rules (i.e. a specification based method). We will now review some other hybrid approaches.
COSAR [7], [8] is a context aware mobile application that combines a statistical learning-based technique with reason-ing through an ontology. To identify the current activity, COSAR first uses its trained statistical model to have a first result, then calls its ontology to refine this recognition. Their core application is based on worn sensors. In our case, we consider having a robot and a smart environment, that are separated. The robot could work on its own, but can also improve its results by asking the sensors if available, while COSAR is a single process.
FallRisk [9] is another combination of learning and spec-ification based techniques. The main objective of this work is to detect falls of elderly in smart homes. It relies on a platform that uses multiple learning-based fall detection systems. The results of these systems are filtered and put into an ontology that carries the context knowledge. The knowledge, including contextual information about the user, is then used to refine the fall detection. The strength of this approach, besides the combination of both techniques, is the compatibility with any fall detection technique. However, it solely deals with fall detection.
FABER [10] is a pervasive system designed to detect ab-normal behaviors for medical applications. It first computes events and actions from the available context data by using simple reasoning on an ontology. They are then injected into a Markov Logic Network (MLN). This trained MLN is used to determine the start and/or end time of activities based on the received data. Computed boundaries, actions and events are sent to the knowledge-based inference engine. This last module is in charge of identifying abnormal behaviors by applying rules extracted from a medical knowledge base. FABER actually offers a three-techniques combination and it is noticeable that the learning-based technique uses inferred data, unlike most learning based techniques that use raw or low level data. FABER also takes the temporal features into account which is an interesting issue. Our work is a bit different: we aim to detect normal activities that a robot is used to see in order to integrate them properly in an everyday life routine.
VI. CONCLUSION
In this paper, we presented a refinement of an activity recognition solution for domestic robots, a vision-based algorithm in our work, by using the sensors and data sources available in the environment. Our system relies on a server that communicates with the robot, gathers the context data
and proposes an enhancement to recognized activities. Our proposition was tested with a Nao robot in a smart room on 12 different persons. Our results showed a significant gain by combining the two techniques, however they mainly pointed out that it is not always pertinent. Furthermore, they underline the dependence of the vision algorithm on a strong learning phase and the necessity to tackle uncertainty issues. In future work, we aim to tackle challenges underlined in the experiments, in particular the problem of selecting what activity recognition method to use depending on the situation. Moreover, experiments using real case scenarios and comparing our approach to existing human activity recognition approach should be performed. We plan to use the Evident5 and Hadaptic6 platforms with a mobile robot in real life configurations.
REFERENCES
[1] M. A. El-Yacoubi, H. He, F. Roualdes, M. Selmi, M. Hariz, and F. Gillet, “Vision-based recognition of activities by a humanoid robot,” International Journal of Advanced Robotic Systems, vol. 12, 2015.
[2] M. E.-Y. Mouna Selmi and B. Dorizzi, “A two-layer discrim-inative model for human activity recognition,” IET Computer Vision, 2016.
[3] M. Selmi, “Reconnaissance d’activit´es humaines `a partir de s´equences vid´eo. (human activity recognition from video sequences),” Ph.D. dissertation, Telecom & Management Sud-Paris, ´Evry, Essonne, France, 2014.
[4] A. K. Dey, “Understanding and using context,” Personal Ubiquitous Comput., vol. 5, no. 1, pp. 4–7, Jan. 2001. [Online]. Available: http://dx.doi.org/10.1007/s007790170019 [5] D. Gouaillier, V. Hugel, P. Blazevic, C. Kilner, J. O. Mon-ceaux, P. Lafourcade, B. Marnier, J. Serre, and B. Maisonnier, “Mechatronic design of nao humanoid,” in Robotics and Automation, 2009. ICRA’09. IEEE International Conference on, 2009, pp. 769–774.
[6] J. Ye, S. Dobson, and S. McKeever, “Situation identification techniques in pervasive computing: A review,” Pervasive and mobile computing, vol. 8, no. 1, pp. 36–66, 2012.
[7] D. Riboni and C. Bettini, “Context-aware activity recognition through a combination of ontological and statistical reason-ing,” in International Conference on Ubiquitous Intelligence and Computing, 2009.
[8] ——, “Cosar: hybrid reasoning for context-aware activity recognition,” Personal and Ubiquitous Computing, vol. 15, no. 3, pp. 271–289, 2011.
[9] F. De Backere, F. Ongenae, F. Van den Abeele, J. Nelis, P. Bonte, E. Clement, M. Philpott, J. Hoebeke, S. Verstichel, A. Ackaert et al., “Towards a social and context-aware multi-sensor fall detection and risk assessment platform,” Comput-ers in biology and medicine, vol. 64, pp. 307–320, 2015. [10] D. Riboni, C. Bettini, G. Civitarese, Z. H. Janjua, and
R. Helaoui, “Fine-grained recognition of abnormal behaviors for early detection of mild cognitive impairment,” in Perva-sive Computing and Communications (PerCom), 2015 IEEE International Conference on. IEEE, 2015, pp. 149–154.
5evident.telecom-sudparis.eu 6hadaptic.telecom-sudparis.eu