Reorganization of tree assemblages over the last century in the northern hardwoods 1
of eastern Canada 2
Running title: Post-settlement tree assemblages 3
4
Raphaële Terrail1, Sébastien Dupuis1, Victor Danneyrolles1, Marie-Josée Fortin2, Yan 5
Boucher3, Dominique Arseneault1, * 6
7
1: Département de biologie, chimie et géographie, Centre d'études de la forêt and Chaire 8
de Recherche sur la Forêt Habitée, Université du Québec à Rimouski, 300 Allée des 9
Ursulines, Rimouski (QC), Canada, G5L 3A1 10
2: Department of Ecology, and Evolutionary Biology, University of Toronto, 25 11
Willcocks Street, Toronto (ON), Canada, M5S 3B2 12
3: Direction de la recherche forestière, Ministère des Ressources naturelles du Québec, 13
2700 Einstein, Québec (QC), Canada, G1P 3W8 14
15
Correspondence: 16
Dominique Arseneault, Département de biologie, chimie et géographie, Université du 17
Québec à Rimouski, 300 Allée des Ursulines, Rimouski (QC), Canada, G5L 3A1 18 Email:dominique_arseneault@uqar.ca 19 20 Funding Information: 21
This study was funded by the Fonds de recherche Nature et technologies (FRQNT), the 22
Chaire de Recherche sur la Forêt Habitée (CRFH) and by the Université du Québec à 23
Rimouski (UQAR). 24
25
Conflict of interest statement: 26
The authors declare no conflict of interest 27
Abstract 29
Question: How has European settlement of Eastern North America modified tree species 30
assemblages? 31
Location: The northern temperate forests of the Lower St. Lawrence region (Québec, 32
Canada). 33
Methods: Changes in relative prevalence of tree taxa were reconstructed with early land 34
survey records (1821-1900) and modern forest inventories (1980-2010). Forest 35
composition reconstructions were then used to analyse changes in tree taxa assemblages 36
at the landscape scale and test for potential landscape homogenization. 37
Results: Our results show important maples (Acer saccharum and A. rubrum) and poplar 38
(Populus tremuloides and P. balsamifera) encroachment, shifting from the 6th to the 2nd 39
positions of relative prevalence and from the 7th to the 5th positions, respectively, 40
resulting in a significant shift in tree assemblage. Maples have spread throughout the 41
whole landscape and have tended to become the most abundant taxa in community where 42
it was already present in pre-settlement times. Poplars also widely spread throughout the 43
landscape but rarely became the most abundant taxa. Accordingly, deciduous 44
encroachment clearly engendered a spatial homogenization of composition at the 45
landscape scale. 46
Conclusion: Considering that both red maple and trembling aspen are opportunist early-47
successional species, the increased relative prevalence of both species, as well as the 48
consequent reorganization of tree taxa assemblages and landscape homogenization 49
probably, resulted from the regional convergence toward an early successional state. 50
Along with restoration of long-lived shade-tolerant conifer populations, land and forest 51
managers should aim to increase heterogeneity of forest stand composition to improve 52
forests resilience to future global changes. 53
54 55
Keywords: conifer decline, early land survey records, encroachment of deciduous 56
species, landscape homogenization, post-settlement forest composition, relative taxa 57
prevalence, eastern Canadian temperate forest 58
Introduction 59
In North America, settlement has caused major changes in the composition, structure, and 60
dynamics of forested landscapes. Several studies have shown that an increase in the 61
frequency and spatial extent of disturbances rejuvenated forests and modified their 62
composition toward a more homogeneous landscape (White, & Mladenoff 1994; Jackson, 63
Pinto, Malcolm, & Wilson, 2000; Black, & Abrams, 2001; Schulte, Mladenoff, Crow, 64
Merrick, & Cleland, 2007; Thompson, Carpenter, Cogbill, & Foster, 2013). Small-scale 65
disturbances, such as windthrow and insect epidemics (Lorimer, 1977; Lorimer, & White, 66
2003; Boulanger, & Arseneault, 2004), were replaced by larger disturbances that were 67
more severe at the site scale such as logging and anthropogenic fires (Boucher, 68
Arseneault, & Sirois, 2006; Boucher, Arseneault, & Sirois, 2009a; Boucher, Arseneault, 69
Sirois, & Blais, 2009b; Dupuis, Arseneault, & Sirois, 2011; Boucher, Grondin, & Auger, 70
2014). 71
In the northern temperate forests of eastern North America, the presettlement forests were 72
often dominated by long-lived, shade tolerant species, most notably conifers such as 73
white, black and red spruce (Picea glauca (Moench) Voss; P. mariana (Mill.) BSP and P. 74
rubens Sarg), white cedar (Thuja occidentalis L) and balsam fir (Abies balsamea (L)
75
Mill). Deciduous species, including sugar and red maple (Acer saccharum, Marsh; A. 76
rubrum L), and white and yellow birch (Betula papyrifera Marsh; B. alleghaniensis Britt)
77
were also present, but were less frequent and less dominant than conifers (Lorimer 1977, 78
Cogbill, Burk, & Motzkin, 2002; Dupuis et al. 2011; Danneyrolles, Arseneault, & 79
Bergeron 2016a). In contrast, the present-day forested landscapes possess a much greater 80
proportion of deciduous trees (White, & Mladenoff, 1994; Foster, Motzkin, & Slater, 81
1998; Jackson et al. 2000, Black, & Abrams, 2001; Dupuis et al. 2011; Danneyrolles et 82
al. 2016a). This encroachment is characterized by an increase in opportunist pioneer 83
species that take advantage of openings in the forest canopy and include red and sugar 84
maples, as well as shade-intolerant species that are favoured by stand-replacing 85
disturbances, such as trembling aspen (Populus tremuloides, Michx) and white birch 86
(Siccama 1971; Schulte et al. 2007; Dupuis et al. 2011; Thompson et al. 2013; 87
Danneyrolles et al. 2016a). In contrast, amongst the conifers, cedar appears to be one of 88
the most vulnerable species to human disturbances and has shown strong decreases in 89
frequency and dominance in eastern Canada (Jackson et al. 2000; Dupuis et al. 2011; 90
Danneyrolles et al. 2017) and in northern Maine (Lorimer 1977; Thompson et al. 2013). 91
In the context of the ecosystem-based forest management, an evaluation of the changes 92
that occurred over the 20th century is required, to help understand how to maintain or 93
improve resilience to disturbances and climate change (Millar and Stephenson 2015; 94
Johnstone et al. 2016), particularly in the regions that have been heavily logged/exploited 95
and transformed, such as the temperate forest zone of eastern North America (Boucher et 96
al. 2009a,b). Changes in the frequency and dominance of species, as well as the spatial 97
structure of the major types of forest stands (coniferous, mixed, deciduous) at the 98
landscape scale are well documented and show a rapid transformation of conifer-99
dominated, uneven-aged forests to young even-aged forests with a larger proportion of 100
deciduous trees (White, & Mladenoff, 1994; Foster et al. 1998; Boucher et al. 2009b; 101
Dupuis et al. 2011). However, to what extent forest rejuvenation and deciduous 102
encroachment have impacted tree communities at the landscape scale is less evident. 103
More particularly, reorganization of relative taxon abundance as a consequence of maples 104
and poplars encroachment has not been specifically addressed. Forest composition 105
(Boucher, Auger, Noël, Grondin, & Arseneault, 2016; Flinn, Mahany, & Hausman, 2018) 106
and spatial structure (i.e. spatial homogenization or heterogenization; Schulte et al. 2007; 107
Hanberry, Palik, & He, 2012b; Thompson et al. 2013; Danneyrolles, Arseneault, & 108
Bergeron, 2018) represent decisive knowledge for ecosystem-based forest management 109
plan. 110
In North America, the pre-settlement forest composition has been mostly reconstructed 111
using archives of the earliest surveys conducted in order to divide the land for settlement, 112
particularly during the 19th century (Whitney 1994; Vellend, Brown, Kharouba, McCune, 113
& Myers-Smith, 2013). The most frequently used data type consists in species 114
determination of individual witness trees, systematically distributed at grid points 115
(Vellend et al. 2013). A second data type consists in taxon lists, which are ranked tree 116
species enumeration at point or along segments of surveyed lines (e.g., Jackson et al. 117
2000; Scull, & Richardson 2007; Flinn et al. 2018). In eastern Canada, tree taxon lists are 118
generally the only available data type (Dupuis et al. 2011; Terrail, Arseneault, Fortin, 119
Dupuis, & Boucher, 2014; Danneyrolles et al. 2016a; Laflamme, Munson, Grondin, & 120
Arseneault, 2016) and recent studies pointed out that relative metrics (i.e. relative ranks) 121
of taxon abundance obtained with taxon lists are more reliable than absolute metrics 122
(Terrail et al. 2014; Larsen, Tulowiecki, Wang, & Trgovac, 2015). In this study, we use a 123
dataset comprising 22555 tree taxon lists over an area of 8910 km2 to reconstruct changes 124
in position of relative order of prevalence for the principal tree taxa as a consequence of 125
maple and poplar expansion. A portion of this dataset (8500 taxon lists from the western 126
half of the study area) has already been analyzed for change in absolute metrics of taxa 127
prevalence and dominance (Dupuis et al. 2011), but not for the reorganization of the 128
relative order of taxa prevalence. We also analyse how deciduous encroachment impacted 129
tree community assemblages at the landscape scale and assess potential homogenization 130
or heterogenization of community composition. 131
132
Study region 133
The study area is located on the southern shore of the St. Lawrence River in eastern 134
Canada (Fig. 1). This region is part of the Appalachian geological formation and is 135
composed principally of sedimentary rocks (Robitaille, & Saucier, 1998). The 136
Appalachian Plateau has a mean altitude of 500 m and is comprised of local summits up 137
to 600 m along with valleys of variable depth. The surface deposits are primarily from 138
glacial and alteration origins. The region is under a temperate continental climate, with 139
mean annual temperatures of 3.1 °C (-12.3 °C in January and 17.5 °C in July), and a 140
mean annual precipitation of 929 mm, with 37% falling in the form of snow. The 141
growing season varies from 140 to 170 days and corresponds to 1500 degree-days above 142
5°C (Robitaille, & Saucier, 1998; Environment Canada, 2018). 143
The study region constitutes a transition zone between the northern temperate zone and 144
the boreal zone of eastern North America. According to Québec’s ecological land 145
classification system, the forests in the west of the study area belong to the balsam fir-146
yellow birch bioclimatic domain, while those in the easternmost section belong to the 147
balsam fir-white birch domain (Robitaille, & Saucier, 1998). Nowadays, the most 148
frequent tree species are balsam fir, white spruce, white birch, aspen, and red and sugar 149
maples. 150
Forest history 151
The European occupation of the Lower St. Lawrence region began in the 17th century 152
with the arrival of the first European settlers along the shores of the St. Lawrence River. 153
However, it was not until the start of the 19th century that forest industry developed and 154
triggered the true colonization of the region. Beginning in 1820, the Price Brothers 155
Company logged large timber species such as spruce and red pine (Pinus resinosa 156
(Aiton)). A significant development in agriculture accompanied logging and led to a 157
subsequent increase in the population starting around 1830 and a slow progression of 158
settlement from the St. Lawrence Lowlands towards the Appalachian Plateau in the 159
interior. The forest industry concentrated primarily on saw wood located within a few 160
hundred metres of the waterways up until the 20th century. The mechanization of the 161
forest industry and the construction of large pulp mills and sawmills then allowed logging 162
to rapidly develop inland (Fortin et al. 1993; Boucher et al. 2009b). 163
164
Materials and methods 165
Pre-settlement and modern data 166
In Québec, the public land division was implemented in the form of townships of around 167
16 km × 16 km (10 miles × 10 miles), that were subdivided into parallel ranges 1.6 km 168
deep (1 mile) and lots 261 m (13 chains; 1 chain equals 20.1 m) wide. In total, the study 169
region includes 91 townships that were covered by 153 field surveys made by 58 170
surveyors between 1821 and 1900. Surveys were conducted along range lines and 171
township boundaries and included the precise measurement of distances between 172
successive observations. Various observations on forest composition can be found in the 173
surveyor's notebooks, such as taxon lists (e.g. spruce, fir, birch, cedar, and a few maple) 174
and specific cover types (e.g. maple stand, cedar stand, etc.). In this study, specific cover 175
types were considered equivalent to pure stands of the corresponding taxon. General 176
cover types (e.g. mixed wood, hardwood) are also frequent but were not considered here. 177
For the analysis, we classified these observations into two geometric types, line or point, 178
according to the surveyors' notes. Lines could be clearly associated with both a starting 179
and an ending position along a range line whereas points could be clearly located, but 180
with no precise beginning or ending along a range line. When combining all observations 181
into the final database, each point observation was weighted by its mean spacing (mean 182
of the distances to the previous and next observations), whereas each line observation 183
was weighted by its length. Observations were georeferenced as points or lines over a 184
governmental cadastral map built from early land surveys. 185
In order to evaluate changes between the pre-settlement and present-day vegetation, we 186
used the last three decadal forest inventory programs conducted in the 1980s, 1990s, and 187
2000s by the provincial government. These inventories were conducted using 0.04 ha 188
sampling plots randomly stratified according to forest stand types (MFFP, 2016). Only 189
the plots located less than 1.6 km from a survey observation were considered, as this 190
distance also corresponds to the spacing between surveyed range lines. Each tree within a 191
plot was reported according to its species and diameter (using 2 cm DBH classes), which 192
allowed the total basal area (m2 ha-1) for each species in a plot to be calculated. 193
In total, over the entire study area, 22 555 taxon lists from the survey archives were 194
compared with 14 895 modern plots. Reclassification was required in order to compare 195
the two datasets. Spruces (white spruce, red spruce, black spruce), maples (sugar maple, 196
red maple) and poplars (trembling aspen, balsam poplar) were grouped to the genus level 197
for the two datasets as surveyors did not distinguish species for these genera. Only taxa 198
that occurred in more than 5% of survey observations or more than 5% of modern plots 199
were considered for this study, which includes four conifers (balsam fir, spruces, white 200
cedar, and pines) and four deciduous taxa (white and yellow birches, maples, and 201
poplars). 202
Relative taxa prevalence and spatial analysis 203
In a previous study, we have compared the reconstruction of forest composition obtained 204
with forest inventories from the early 20th century (i.e. reconstruction based on taxa basal 205
area) and early land survey taxon lists (Terrail et al. 2014). This showed that taxon lists 206
are highly accurate for reconstructing pre-settlement composition, and particularly when 207
using relative metrics (Terrail et al. 2014; Larsen et al. 2015). Thus, we computed relative 208
prevalence positions of the eight retained taxa in order to describe the vegetation for each 209
period. We first computed Pi, a measure of absolute taxa prevalence using the following 210
equation: 211
Pi = (ni/Mi) × 100 , (eq.1)
212
where ni is the number of observations where the taxon i is present and Mi is the total 213
number of observations. The relative prevalence positions of taxa were then determined 214
from their absolute prevalence. The taxon with the highest absolute prevalence was 215
assigned a relative prevalence of 8, while a value of 1 was given to the taxon with the 216
lowest absolute prevalence. Taxa relative prevalence were firstly computed for the entire 217
study area and second, in order to analyse the spatial patterns of relative prevalence and 218
their reorganization between the two epochs, the relative prevalence was computed for 219
each cell of a grid with 412 cells of 5 km × 5 km (25 km2) across the study area. Cells 220
containing less than 5 observations for either of the epochs were excluded from the 221
analysis. We tested several cell sizes and determined that a size of 25 km2 permitted 222
retention of the maximum number of cells with well-distributed observations. On 223
average, the cells contained 50 taxon lists and 33 modern plots. We created relative taxa 224
prevalence maps for the 8 retained taxa (Appendix S1). 225
Taxa relative prevalence at the 25-km2 grid scale were finally used to conduct two 226
distinct analyses. First, we regrouped cells according to community composition using a 227
k-means clustering analysis, which maximizes extra-group variance and minimizes
228
intergroup variance. We clustered data of each of the 412 cells from both periods in a 229
single run to allow direct comparison of communities between periods. An optimal 230
number of four groups was identified using a simple structure index (SSI) criterion. 231
Second, we tested for landscape homogenization or heterogenization using a multivariate 232
dispersion analysis (Anderson, Ellingsen, & McArdle, 2006). The relative prevalence of 233
taxa from each of the 412 cells from both periods were first used to compute a principal 234
coordinate analysis(PCoA), where the Bray-Curtis distance between cells was reduced to 235
eight principal coordinates (i.e., axes). PCoA analysis gives the advantage of using non-236
Euclidian dissimilarity measures (e.g. Bray-Curtis dissimilarity). The multivariate 237
dispersion was calculated as the multivariate distance from each cell to its group 238
centroids (i.e. time periods). We performed a paired permutation test (999 permutations) 239
to detect significant homogenization or heterogenization between the two periods. This 240
approach is particularly well appropriate for assessing differences in β-diversity among 241
different areas or groups of samples (Anderson, Ellingsen, & McArdle, 2006). k-means 242
cluster and multivariate dispersion analyses were performed in R using the cascadeKM 243
and betadisper functions, respectively, which are both included in the vegan R package 244
(Oksanen et al. 2017). 245
Results 246
Reorganization of relative taxa prevalence 247
For the entire study area, conifers such as spruces, balsam fir, and cedar were the most 248
common taxa found on the pre-settlement landscape and occupied the highest relative 249
prevalence positions of 8, 7, and 5, respectively (Table 1). In contrast, the pines were 250
rare, occupying the position of 1 (Table 1). White birch was the most prevalent hardwood 251
and occupied the position of 6. Yellow birch, maples, and poplars occupied positions of 252
4, 3, and 2, respectively (Table 1). 253
The expansion of hardwoods since the pre-settlement period was characterized by an 254
increase in the absolute prevalence of maples by more than 45% and close to 25% for 255
poplars throughout the entire study region. Maples now occupy the second highest 256
position in relative prevalence, corresponding to an increase of 4 positions since the pre-257
settlement era (Table 1). At the cell scale, maples have become the most abundant taxa in 258
more than the half of the cells (Fig. 2, Appendix S1). The relative prevalence of poplars 259
increased by two positions throughout the entire study region (from 2 to 4; 5.2% to 260
30.6%; Table 1) and is now ranked in positions 5 to 3 in 68% of cells (Fig. 2, Appendix 261
S1). While the absolute prevalence of white birch increased by 4.3 % during this 262
encroachment period, its relative prevalence decreased slightly from 6 to 5. Yellow birch 263
was the single hardwood species to experience a decrease in both absolute and relative 264
prevalence. Although these changes were slight at the regional scale (position 4 to 3; 265
Table 1), yellow birch underwent an important decrease in relative prevalence with more 266
than 50% of 25 km2 cells that recorded a decrease of two or more positions of prevalence 267
(Fig. 2, Appendix S1). 268
Overall, the increase in the prevalence of hardwoods was counterbalanced by a decrease 269
in conifers. The most significant decrease was for cedar, with an absolute prevalence 270
decrease of 16 % and a loss of 3 positions in relative prevalence at the regional scale 271
(positions 5 to 2; Table 1). At the landscape scale, cedar occupied one of the four highest 272
position (i.e. positions 5 to 8) in 60 % of cells in pre-settlement times and is now ranked 273
positions equal or smaller than 3 in 83 % of the cells (Fig. 2, Appendix S1). The spruces 274
decreased by 10% in absolute prevalence and by 1 position in relative prevalence 275
throughout the entire study region (positions 7 to 6; Table 1). In pre-settlement times, 276
spruces ranked one of the two highest position in 70 % of the 25 km2 cells while is now 277
ranked positions equal or smaller than 6 in 72 % of the cells (Fig. 2, Appendix S1). The 278
two remaining conifers, balsam fir and pines, were stable and were the most prevalent 279
(balsam fir; position 8 to 8; Table 1) and the less prevalent (pines; position 1 to 1; Table 280
1) taxa for the two periods. 281
Reorganization of tree taxa assemblages 282
Cluster analysis reveals that encroachment by maples and poplars resulted in an 283
important reorganization of tree taxa assemblage at the landscape scale (Fig. 3). While 284
the analysis identifies the existence of similar landscape assemblage in both periods (i.e. 285
cells within the four groups are found in each periods), there is a clear difference of 286
groups distribution between the two periods. In pre-settlement times more than 85 % of 287
cells belonged to groups 2 and 4, while in modern times 76 % of the cells are in group 3 288
and 18 % in group 1 (Fig. 3a). Balsam fir, spruces and white birch shows high and 289
comparable relative prevalence in all cluster groups, which are mostly differentiated by 290
the relative prevalence of cedar, yellow birch, maples and poplars (Fig. 3b). Pre-291
settlement dominant groups (i.e. 2 and 4) showed higher relative prevalence of cedar and 292
yellow birch compared to modern dominant groups (i.e. 1 and 3). Groups 2 and 4 mostly 293
differentiated by higher prevalence of maples in groups 4 along with the almost complete 294
absence of this taxon in group 2. In addition, the relative prevalence of maples and 295
poplars is higher in modern dominant groups compared to pre-settlement dominant 296
groups 2 and 4 (Fig. 3b). Groups 1 and 3 are mostly separated by the prevalence of 297
maples and yellow birch. Maples is the most prevalent taxon (i.e. relative prevalence rank 298
of 8) in more than 50% of group 3 cells, which also show higher yellow birch prevalence 299
than to group 1. Yellow birch is almost totally absent in group 1 and relative prevalence 300
of poplars is slightly higher. 301
Results of groups transition (Fig. 3c) provide an important insight into the dynamic 302
trajectories of tree communities at the landscape scale. Very few cells in pre-settlement 303
dominant groups (i.e. groups 2 and 4) have maintained in the same groups in modern 304
times. Almost half of the study area (48 % of the cells) followed a transition from group 305
4, which exhibited an important relative prevalence of maples in pre-settlement times, to 306
group 3 in which maples is nowadays the most prevalent taxa. Nearly all cells in group 3 307
in pre-settlement times have stayed in groups 3 (10 % of the study area). Cells currently 308
in groups 1 mostly originated from groups 2 and 4 (8 % and 6% of the study area, 309
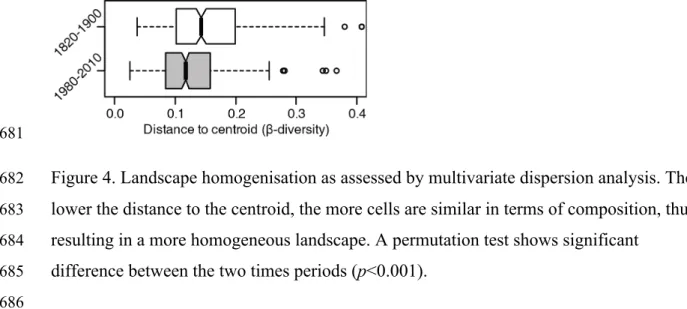
respectively). Together, these changes resulted in a significant landscape homogenization 310
(Fig. 4). During pre-settlement times, mean cells distance to centroid was 0.16 and has 311
decreased to 0.12 in modern times, indicating that composition of cells is more similar in 312
modern compared to pre-settlement times. Our permutation test shows that this 313 homogenization is significant (p<0.001). 314 315 Discussion 316
The results of this study are consistent with the majority of similar studies conducted in 317
the temperate zone of eastern North America that recorded a significant encroachment by 318
maples and poplars as a result of land use activities since pre-settlement times (e.g. 319
clearing for agriculture, anthropogenic fires, logging, farmland abandonment) (Whitney 320
1994; Jackson et al. 2000; Friedman, & Reich, 2005; Thompson et al. 2013; Danneyrolles 321
et al. 2016a; Flinn et al. 2018). Our study also agrees with works that recorded a 322
landscape homogenization as a consequence of these changes (Schulte et al. 2007; 323
Hanberry, Dey, & He, 2012; Hanberry, Palik, & He, 2012; Thompson et al. 2013). In this 324
context, our most important contribution here was to document the consequent 325
reorganization of relative taxon abundance. Although no taxon has been excluded or 326
introduced at the regional scale, the relative order of taxa prevalence has been reshuffled 327
for almost all taxa in all cells due to the regional expansion of maple and poplar 328
(Appendix S1). Because relative taxa prevalence condenses values of absolute prevalence 329
to a few discrete ranks, it provides easier to interpret and apply management targets for 330
ecosystem-based forest management. In the following sections we discuss the cause of 331
deciduous encroachment and resulting taxa reshuffling as well as the management 332
implications of our findings. 333
Causes of maples and poplars encroachment 334
Maples, the taxon that has increased the most throughout the study area corresponds to 335
both sugar and red maples since surveyors did not differentiated these two species. The 336
relative abundance of the two maples species in modern plots (Appendix S2) reveals that 337
red maple tends to be omnipresent across the modern landscape, while sugar maple is 338
more clustered. Red maple is known to be an opportunist early-successional, fast-339
growing and short-lived species (Walter, & Yawney 1991; Abrams 1998) which has 340
benefited from disturbances and fire suppression in the eastern U.S.A. (Fei, & Steiner 341
2007, 2009; Nowacki, & Abrams 2008). Moreover, at its northern range limits, red maple 342
may even be favoured by stand-replacing fire (Zhang, Bergeron, Zhao, & Drobyshev, 343
2015). As such, it is very likely that red maple benefited from both stand-replacing and 344
partial disturbance (agricultural clearing, fire, clear-cutting, partial cutting, insect 345
outbreaks) from the last century in our study area. While sugar maple is generally 346
considered as very shade-tolerant late-successional species (Godman, Yawney, & Tubbs, 347
1991), studies near its northern range limit have shown that the species may also become 348
dominant quickly after stand-replacing disturbance such as clearcutting and fire (Nolet, 349
Bouffard, Doyon, Delagrange, 2008; Nolet, Delagrange, Bouffard, Doyen, & Forget, 350
2008; Pilon, & Payette 2015). By any means, sugar maple ability to maintain a vigorous 351
seedling banks and its strong response to canopy release allow it to take a substantial 352
advantage of low severity disturbances such as partial cutting and insect outbreaks 353
(Boucher et al. 2006; Danneyrolles, Arseneault, & Bergeron, 2016b). 354
Concerning poplars, trembling aspen certainly accounts for a very large proportion of the 355
increase in poplar prevalence in our study area (Appendix S2). Trembling aspen is 356
considered as an early-successional, fast-growing and short-lived species (Perala, 1991). 357
More particularly, its capacity to vigorously regenerate by roots-suckering after 358
disturbance makes trembling aspen particularly adapted to the severe or frequent 359
disturbances that have followed European settlement (Bergeron, & Charron, 1994; 360
Boucher et al. 2014; Danneyrolles et al. 2016a). 361
Spatial reorganization of tree communities 362
Our cluster analysis also provides important insight into spatial reorganization of 363
community composition. One particularly striking pattern is that cells in which maples 364
are currently the most abundant taxa predominantly came from groups with the highest 365
abundance of maples in pre-settlement times. Indeed, maples have tended to become 366
dominant (i.e. taxon with the highest relative frequency) mainly in area where they were 367
already present (Appendix S3). Moreover, areas where maples became dominant 368
corresponds to area in which both sugar and red maples are currently present, while area 369
where maples became present but not dominant correspond to areas where only red 370
maple is currently present (Appendices S2 and S3). This is not surprising since red maple 371
produce each year a large amount of wind-dispersed seeds that easily colonize recently 372
disturbed area (Walter, & Yawney, 1991; Abrams, 1998) where population can establish 373
quickly (Fei, & Steiner 2009). By contrast, sugar maple seed production is more irregular 374
and the species has typically poorer abilities than red maple to colonize new area but has 375
better capacity to become dominant in stands where it is already present (Abrams, 1998; 376
Caspersen, & Saprunoff, 2005; Nolet et al. 2008b). 377
Trembling aspen has a high potential to colonize new area both by long seed dispersal 378
and vegetative reproduction (Perala, 1991), which explain its ubiquitous expansion across 379
the landscape (Figs 3, S1, S3). However, contrarily to maples, aspen is infrequently the 380
most abundant taxa in 25 km2 cells. This may reflect the fact that aspen establishment is 381
more dependent to severe stand-replacing disturbance such as fire or clear-cut (Bergeron, 382
& Charron, 1994), and thus, within one cell, aspen may have become very abundant in 383
severely disturbed plots while remaining totally absent from others. 384
Spatial reorganization was also characterized by the landscape homogenization of forest 385
communities. Such a forest composition transformation in Northeastern North America 386
has been associated with the convergence of regional forest toward younger successional 387
states (Schulte et al. 2007; Hanberry et al. 2012b) and with a loss of influence of 388
environmental gradients in youngest forests (Hanberry et al. 2012a; Thompson et al. 389
2013). In our study area, landscape homogenization has been primarily driven by the 390
encroachment of maples and poplars. While balsam fir and spruces were omnipresent 391
across the pre-settlement landscape, heterogeneity was mainly determined by the 392
clustered distribution of maples (Appendix S1) that differentiated the two dominant 393
cluster groups in pre-settlement times (Fig. 3). Before European settlement maples 394
occurred mostly as small isolated stand on hilltops (Boucher et al. 2006; Dupuis et al. 395
2011). Conversely, maples tend to be omnipresent across the modern landscape, as 396
illustrated by the current large predominance of the maples-dominated group 3. This 397
ubiquitous distribution is likely linked to red maple present-day distribution (Appendix 398
S2). Considering than both red maple and trembling aspen are opportunist early-399
successional species, landscape homogenization probably resulted from the regional 400
forest rejuvenation (i.e. convergence toward an early successional state). However, 401
because our analysis is limited to the 25 km2 grid scale, it is not excluded that 402
disturbances of the last century have at the same time led to spatial heterogenization at a 403
finer scale (i.e. plot-to-plot variation within 25 km2 cells; Thompson et al. 2013; 404
Danneyrolles et al. 2018). 405
Management implications 406
Spatial heterogeneity contributes to forest resilience to insect outbreaks and to broader 407
global changes (Knops et al. 1999; Turner, Donato, & Romme, 2013) and has been 408
weakened by landscape homogenization of the last century. Considering that ecosystem-409
based forest management has recently become a priority in the province of Québec 410
(Gouvernement du Québec, 2015), our results (mainly Fig. 2) should be considered, 411
along with additional criteria of sustainable forest management, to identify reference 412
conditions of relative taxon abundance at large spatial scales (i.e., for spatial units of 413
about 25 km2) in order to restore heterogeneity and resilience. Because repeated 414
disturbance associated with settlement and forest management is the most likely process 415
that has increased and maintained high relative prevalence of maple and poplar, forest 416
managers should avoid systematically increasing the prevalence of these two taxa at the 417
expense of late-successional conifers. Maple and poplar dominance (i.e. frequency as the 418
more prevalent taxon) and prevalence should be decreased and heterogenized among 419
sites. Conversely, cedar and white and red spruces, as well as yellow birch, should be 420
actively restored to higher ranks of relative prevalence through planting whenever 421
possible. At the same time, it is encouraging that balsam fir, the most dominant and 422
prevalent taxon of the study area, has been sufficiently resilient to high rates of 423
anthropogenic disturbances and insect outbreaks of the 20th century that no specific 424
action is needed to manage its relative prevalence. 425
Although climate change is likely to affect the ability of forest management to reduce 426
gaps between current and pre-settlement forest composition, our results would still 427
provide functional targets for forest management (Boulanger et al. 2019). For example, 428
growth rate, longevity, and shade-tolerance of species can be considered in order to 429
maintain functionally diverse and spatially heterogeneous stands and landscape, similar 430
to the ones that prevailed before European settlement. 431
432
Acknowledgments 433
We thank Catherine Burman-Plourde and Pierre-Luc Morin for their help in building the 434
database. Luc Sirois provided constructive comments at several stages of the study. 435
436
Authors' contributions 437
All authors designed the study and methodology. RT and VD analyzed the data and wrote 438
the manuscript with inputs from DA, MJF and YB. 439
440
Data accessibility 441
Historical data are available from the corresponding author upon request. Modern forest 442
data are freely available from the Ministère des Forêts, de la Faune et des Parcs du 443
Québec website: (https://mffp.gouv.qc.ca/le-ministere/acces-aux-donnees-gratuites/). 444
445
References 446
Abrams, M. D. (1998). The Red Maple Paradox. BioScience, 48, 355– 447
364. https://doi.org/ 448
10.2307/1313374. 449
Anderson, M. J., Ellingsen, K. E., & McArdle, B. H. (2006). Multivariate dispersion as a 450
measure o f beta diversity. Ecology Letters, 9, 683–693. https://doi.org/ 451
10.1111/j.1461-0248.2006.00926.x. 452
Bergeron, Y., & Charron, D. (1994). Postfire stand dynamics in a southern boreal forest 453
(Québec): a dendroecological approach. Ecoscience, 1, 173–184. https://doi.org/ 454
10.1080/11956860.1994.11682241 455
456
Black, B. A., & Abrams, M. D. (2001). Analysis of temporal variation and species-site 457
relationships of witness tree data in southeastern Pennsylvania. Canadian Journal 458
of Forest Research, 31, 419–429. https://doi.org/ 10.1139/x00-184.
459
Boucher, Y., Arseneault, D., & Sirois, L. (2006). Logging-induced change (1930-2002) 460
of a preindustrial landscape at the northern range limit of northern hardwoods, 461
eastern Canada. Canadian Journal of Forest Research, 36, 505–517. 462
https://doi.org/ 10.1139/x05-252. 463
Boucher, Y., Arseneault, D., & Sirois, L. (2009a). Logging history (1820–2000) of a 464
heavily exploited southern boreal forest landscape: Insights from sunken logs and 465
forestry maps. Forest Ecology and Management, 258, 1359–1368. https://doi.org/ 466
10.1016/j.foreco.2009.06.037. 467
Boucher, Y., Arseneault, D., Sirois, L., & Blais, L. (2009b). Logging pattern and 468
landscape changes over the last century at the boreal and deciduous forest 469
transition in Eastern Canada. Landscape Ecology, 24, 171–184. https://doi.org/ 470
10.1007/s10980-008-9294-8. 471
Boucher, Y., Auger, I., Noël, J., Grondin, P., & Arseneault, D. (2016). Fire is a stronger 472
driver of forest composition than logging in the boreal forest of eastern Canada. 473
Journal of Vegetation Science, 28, 57-68. https://doi.org/ 10.1111/jvs.12466.
474
Boucher, Y., Grondin, P., & Auger, I. (2014). Land use history (1840–2005) and 475
physiography as determinants of southern boreal forests. Landscape Ecology, 29, 476
437–450. https://doi.org/ 10.1007/s10980-013-9974-x. 477
Boulanger, Y., & Arseneault, D. (2004). Spruce budworm outbreaks in eastern Quebec 478
over the last 450 years. Canadian Journal of Forest Research, 34, 1035–1043. 479
https://doi.org/ 10.1139/x03-269. 480
Boulanger, Y., Arseneault, D., Boucher, Y., Gauthier, S., Cyr, D., Taylor, A. R., …, & 481
Dupuis. S. (2019). Climate change will affect the ability of forest management to 482
reduce gaps between current and presettlement forest composition in 483
southeastern Canada. Landscape Ecology https://doi.org/10.1007/s10980-018-484
0761-6 485
Caspersen, J. P., & Saprunoff, M. (2005). Seedling recruitment in a northern temperate 486
forest: the relative importance of supply and establishment limitation. Canadian 487
Journal of Forest Research, 35, 978–989. https://doi.org/ 10.1139/x05-024.
488
Cogbill, C. V., Burk, J., & Motzkin, G. (2002). The forests of presettlement New 489
England, USA: spatial and compositional patterns based on town proprietor 490
surveys. Journal of Biogeography, 29, 1279–1304. https://doi.org/ 491
10.1046/j.1365-2699.2002.00757.x. 492
Danneyrolles, V., Arseneault, D., & Bergeron, Y. (2016a). Pre-industrial landscape 493
composition patterns and post-industrial changes at the temperate-boreal forest 494
interface in western Quebec, Canada. Journal of Vegetation Science, 27, 470–481. 495
https://doi.org/ 10.1111/jvs.12373. 496
Danneyrolles, V., Arseneault, D., & Bergeron, Y. (2016b). Long-term compositional 497
changes following partial disturbance revealed by the re-survey of logging 498
concession limits in the northern temperate forest of eastern Canada. Canadian 499
Journal of Forest Research, 46, 943–949. https://doi.org/
10.1139/cjfr-2016-500
0047. 501
Danneyrolles, V., Arseneault, D., & Bergeron, Y. (2018). Anthropogenic disturbances 502
strengthened tree community-environment relationships at the temperate-boreal 503
interface. Landscape Ecology, 33, 213–224. https://doi.org/ 10.1007/s10980-017-504
0591-y. 505
Danneyrolles, V., Dupuis, S., Arseneault, D., Terrail, R., Leroyer, M., de Römer, A., …, 506
& Ruel, J.-C. (2017). Eastern white cedar long-term dynamics in eastern Canada: 507
Implications for restoration in the context of ecosystem-based management. 508
Forest Ecology and Management, 400, 502–510. https://doi.org/
509
10.1016/j.foreco.2017.06.024. 510
Dupuis, S., Arseneault, D., & Sirois, L. (2011). Change from pre-settlement to present-511
day forest composition reconstructed from early land survey records in eastern 512
Québec, Canada. Journal of Vegetation Science, 22, 564–575. https://doi.org/ 513
10.1111/j.1654-1103.2011.01282.x. 514
Environment Canada. (2018). Canadian Climate Normals and Averages 1981-2010. 515
Meteorological Service of Canada. Available online from 516
http://climate.weather.gc.ca/climate_normals/index_e.html#1981 (accessed 517
September 2018). 518
Fei, S., & Steiner, K. C. (2007). Evidence for increasing red maple abundance in the 519
eastern United States. Forest Science, 53, 473–477. https://doi.org/ 520
10.1093/forestscience/53.4.463 521
Fei, S., & Steiner, K. C. (2009). Rapid capture of growing space by red maple. Canadian 522
Journal of Forest Research, 39, 1444–1452. https://doi.org/ 10.1139/X09-065.
523
Flinn, K. M., Mahany, T. P., & Hausman, C. E. (2018). From forest to city: Plant 524
community change in northeast Ohio from 1800 to 2014. Journal of Vegetation 525
Science, 29, 297-306. https://doi.org/ 10.1111/jvs.12621.
526
Fortin, J., Lechasseur, A., Morin, Y., Harvey, F., Lemay, J., & Tremblay, Y. (1993). 527
Histoire du Bas-Saint-Laurent. Institut québécois de recherche sur la culture, 528
Québec. 529
Foster, D. R., Motzkin, G., & Slater, B. (1998). Land-Use History as Long-Term Broad-530
Scale Disturbance: Regional Forest Dynamics in Central New England. 531
Ecosystems, 1, 96–119. https://doi.org/ 10.1007/s100219900008.
532
Friedman, S. K., & Reich, P. B. (2005). Regional legacies of logging: departure from 533
presettlement forest conditions in northern Minnesota. Ecological Applications, 534
15, 726–744. https://doi.org/ 10.1890/04-0748. 535
Godman, R. M., Yawney, H. W., & Tubbs, H. T. (1991). Acer saccharum Marsh. Sugar 536
Maple. In Silvics of North America. Edited by R. M. Burns and B. H. Honkala. 537
U.S. Dept. of Agriculture, Forest Service, Washington. pp. 194–215. 538
Hanberry, B. B., Dey, D. C., & He, H. S. (2012a). Regime Shifts and Weakened 539
Environmental Gradients in Open Oak and Pine Ecosystems. PLoS ONE, 7, 540
e41337. https://doi.org/ 10.1371/journal.pone.0041337. 541
Hanberry, B. B., Palik, B. J., & He, H. S. (2012b). Comparison of historical and current 542
forest surveys for detection of homogenization and mesophication of Minnesota 543
forests. Landscape Ecology, 27, 1495–1512. https://doi.org/ 10.1007/s10980-544
012-9805-5. 545
Jackson, S. M., Pinto, F., Malcolm, J. R., & Wilson, E. R. (2000). A comparison of pre-546
European settlement (1857) and current (1981-1995) forest composition in 547
central Ontario. Canadian Journal of Forest Research, 30, 605–612. 548
https://doi.org/ 10.1139/x99-242. 549
Johnstone, J. F., Allen, C. D., Franklin, J. F., Frelich, L. E., Harvey, B. J., Higuera, P. E., 550
…, & Turner, M. G. (2016). Changing disturbance regimes, ecological memory, 551
and forest resilience. Frontiers in Ecology and the Environment, 14, 369–378. 552
https://doi.org/10.1002/fee.1311. 553
Knops, J. M. H., Tilman, D., Haddad, N. M., Naeem, S., Mitchell, C. E., Haarstad, J., …, 554
& Groth, J. (1999). Effects of plant species richness on invasion dynamics, 555
disease outbreaks, insect abundances and diversity. Ecology Letters, 2, 286–293. 556
https://doi.org/ 10.1046/j.1461-0248.1999.00083.x. 557
Laflamme, J., Munson, A., Grondin, P., & Arseneault, D. (2016). Anthropogenic 558
Disturbances Create a New Vegetation Toposequence in the Gatineau River 559
Valley, Quebec. Forests, 7, 254. https://doi.org/ 10.3390/f7110254. 560
Larsen, C. P. S., Tulowiecki, S. J., Wang, Y.-C., & Trgovac, A. B. (2015). Predicting 561
historic forest composition using species lists in presettlement land survey 562
records, western New York. Applied Vegetation Science, 18, 481–492. 563
https://doi.org/ 10.1111/avsc.12165. 564
Lorimer, C. G. (1977). The Presettlement Forest and Natural Disturbance Cycle of 565
Northeastern Maine. Ecology, 58, 139–148. https://doi.org/ 10.2307/1935115. 566
Lorimer, C. G., & White, A. S. (2003). Scale and frequency of natural disturbances in the 567
northeastern US: implications for early successional forest habitats and regional 568
age distributions. Forest Ecology and Management, 185, 41–64. https://doi.org/ 569
10.1016/S0378-1127(03)00245-7. 570
MFFP. (2016). Placettes-échantillons temporaires: normes techniques placettes-571
échantillons temporaires. Available from 572
http://collections.banq.qc.ca/ark:/52327/2748267 [accessed 27 September 2018]. 573
Millar, C. I., & Stephenson, N. L. (2015). Temperate forest health in an era of emerging 574
megadisturbance. Science, 349(6250), 823–826. 575
https://doi.org/10.1126/science.aaa9933. 576
Nolet, P., Bouffard, D., Doyon, F., & Delagrange, S. (2008a). Relationship between 577
canopy disturbance history and current sapling density of Fagus grandifolia and 578
Acer saccharum in a northern hardwood landscape. Canadian Journal of Forest
579
Research, 38, 216–225. https://doi.org/ 10.1139/X07-160.
580
Nolet, P., Delagrange, S., Bouffard, D., Doyon, F., & Forget, E. (2008b). The 581
successional status of sugar maple (Acer saccharum), revisited. Annals of Forest 582
Science, 65, 208–208. https://doi.org/ 10.1051/forest:2007091.
583
Nowacki, G. J., & Abrams, M. D. (2008). The Demise of Fire and “Mesophication” of 584
Forests in the Eastern United States. BioScience, 58, 123–138. https://doi.org/ 585
10.1641/B580207. 586
Oksanen, J., Blanchet, F. G., Friendly, M., Kindt, R., Legendre, P., McGlinn, D., …, & 587
Wagner, H. (2017). vegan: Community Ecology Package. Available from 588
https://CRAN.R-project.org/package=vegan. 589
Perala, D. A. (1991). Populus tremuloides Michx. Quaking Aspen. In Silvics of North 590
America. Edited by R. M. Burns and B. H. Honkala. U.S. Dept. of Agriculture, 591
Forest Service, Washington. pp. 1082–1115. 592
Pilon, V., & Payette, S. (2015). Sugar maple (Acer saccharum ) forests at their northern 593
distribution limit are recurrently impacted by fire. Canadian Journal of Forest 594
Research, 45, 452–462. https://doi.org/ 10.1139/cjfr-2014-0322.
595
Robitaille, A., & Saucier, J.-P. (1998). Paysages régionaux du Québec méridional. 596
Gouvernement du Québec, Ministère des ressources naturelles, Québec. 597
Schulte, L. A., Mladenoff, D. J., Crow, T. R., Merrick, L. C., & Cleland, D. T. (2007). 598
Homogenization of northern U.S. Great Lakes forests due to land use. Landscape 599
Ecology, 22, 1089–1103. https://doi.org/ 10.1007/s10980-007-9095-5.
600
Scull, P., & Richardson, J. L. (2007). A method to use ranked timber observations to 601
perform forest composition reconstructions from land survey data. American 602
Midland Naturalist, 158, 446–460. https://doi.org/
10.1674/0003-603
0031(2007)158[446:AMTURT]2.0.CO;2. 604
Siccama, T. G. (1971). Presettlement and Present Forest Vegetation in Northern Vermont 605
with Special Reference to Chittenden County. American Midland Naturalist, 85, 606
153–172. https://doi.org/ 10.2307/2423919. 607
Terrail, R., Arseneault, D., Fortin, M.-J., Dupuis, S., & Boucher, Y. (2014). An early 608
forest inventory indicates high accuracy of forest composition data in pre-609
settlement land survey records. Journal of Vegetation Science, 25, 691–702. 610
https://doi.org/ 10.1111/jvs.12142. 611
Thompson, J. R., Carpenter, D. N., Cogbill, C. V., & Foster, D. R. (2013). Four centuries 612
of change in northeastern United States forests. PLoS ONE, 8, e72540. 613
https://doi.org/ 10.1371/journal.pone.0072540. 614
Turner, M. G., Donato, D. C., & Romme, W. H. (2013). Consequences of spatial 615
heterogeneity for ecosystem services in changing forest landscapes: priorities for 616
future research. Landscape Ecology, 28, 1081–1097. https://doi.org/ 617
10.1007/s10980-012-9741-4. 618
Vellend, M., Brown, C. D., Kharouba, H. M., McCune, J. L., & Myers-Smith, I. H. 619
(2013). Historical ecology: Using unconventional data sources to test for effects 620
of global environmental change. American Journal of Botany, 100, 1294–1305. 621
https://doi.org/ 10.3732/ajb.1200503. 622
Walter, R. S., & Yawney, H. W. (1991). Acer rubrum L. Red Maple. In Silvics of North 623
America. Edited by R.M. Burns and B.H. Honkala. U.S. Dept. of Agriculture, 624
Forest Service, Washington. pp. 60–69. 625
White, M., & Mladenoff, D. (1994). Old-growth forest landscape transitions from pre-626
European settlement to present. Landscape Ecology, 9, 191–205. https://doi.org/ 627
10.1007/BF00134747. 628
Whitney, G. G. (1994). From coastal wilderness to fruited plain: a history of 629
environmental change in temperate North America, 1500 to the present. 630
Cambridge University Press, Cambridge; New York. 631
Zhang, Y., Bergeron, Y., Zhao, X.-H., & Drobyshev, I. (2015). Stand history is more 632
important than climate in controlling red maple (Acer rubrum L.) growth at its 633
northern distribution limit in western Quebec, Canada. Journal of Plant Ecology, 634 8, 368–379. https://doi.org/ 10.1093/jpe/rtu029. 635 636 637 638 639 640 641 642
List of appendices 643
644
Appendix S1: Position of relative prevalence for the eight taxa in each 5 km × 5 km cell for 645
the preindustrial and modern time periods. 646
647
Appendix S2: Relative ranks of basal area in each modern plot (1980-2010) for species that 648
were regrouped at the genus level. 649
650
Appendix S3: Changes in taxa presence and dominance status between preindustrial and 651
modern times. 652
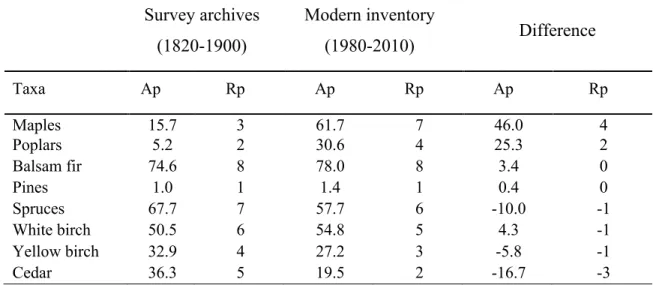
Table 1. Absolute and relative prevalence of the tree taxa across the entire study area for 653
the two-time periods and their differences (Modern minus Archives). Ap: Absolute 654
prevalence; Rp: Relative prevalence. 655 656 Survey archives (1820-1900) Modern inventory (1980-2010) Difference Taxa Ap Rp Ap Rp Ap Rp Maples 15.7 3 61.7 7 46.0 4 Poplars 5.2 2 30.6 4 25.3 2 Balsam fir 74.6 8 78.0 8 3.4 0 Pines 1.0 1 1.4 1 0.4 0 Spruces 67.7 7 57.7 6 -10.0 -1 White birch 50.5 6 54.8 5 4.3 -1 Yellow birch 32.9 4 27.2 3 -5.8 -1 Cedar 36.3 5 19.5 2 -16.7 -3 657 658
659 660 661
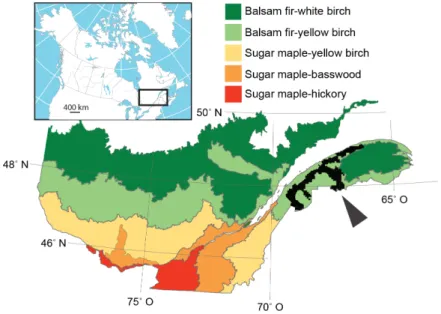
662
Figure 1. Location of the study area in eastern Québec (black) in relation to the 663
bioclimatic domains. 664
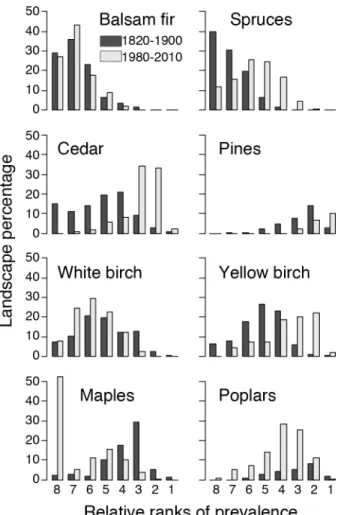
666
Figure 2. Percentage of cells occupied by each position of relative prevalence for each 667
taxon and each time period. 668
670 671
672
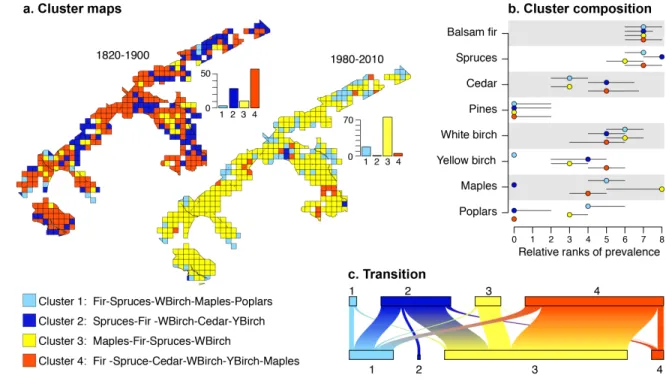
Figure 3. Forest communities identified by k-means clustering of the 25 km2 grid cells. 673
(a): Maps of the clusters for the two time periods with histograms showing the percent of 674
cells in each cluster for the two periods; (b): diagram of cluster composition with points 675
representing the median relative ranks of frequency and error bars displaying the first and 676
third quartiles; (c): diagram quantifying cell transition among cluster groups from 677
preindustrial (above) to modern (below) time periods (width of each box is proportional 678
to the corresponding number of cells). 679
681
Figure 4. Landscape homogenisation as assessed by multivariate dispersion analysis. The 682
lower the distance to the centroid, the more cells are similar in terms of composition, thus 683
resulting in a more homogeneous landscape. A permutation test shows significant 684
difference between the two times periods (p<0.001). 685