Pnocnnss Rnponr II
SNowpownn
I r,t
N o v.t rt v n I w-s
t ra S N o w Pd mu s rn n S s w s nv e S ys rr pt
AuowNe Accuntrt C.tunnqrtor or
RnnnoratvSeNsno
Dtr,a
ro n I rupno vr o F o nnc.ts rI NG o F
Hvono PownnRzsouncns
PnoCnNSS REPORT II
CONTRACT No: NNE
5/2000/25
I
PROJECT No z NNE 5/2 5 1/2000
ACRONYMI SNOWPOWER
TITLE: 'Innovative In-situ Snow Purameter
Sensing
System
Allowing Accurate Calibration of Remotely Sensed
Duta
for Improved Forecasting of Hydro Power Resources'
PROJECT CO-ORDINATOR:
o FZK- Forschungszentrum
Karlsruhe GmbH, Germany (partner 1)
PARTNERS (order according
to contract):
o KTH - Kungliga Tekniska Hôgskolan,
Sweden
(partner 2)
o SLF - Swiss Fed. Inst. for Forest, Snow, and Landscape Research
as Part of Swiss
Federal Research
Institute WSL (partner 3)
. HQ - Hydro-Québec,
Canada (partner 4)
o INRS - Institute National de la Recherche
Scientifique,
Canada (partner 5)
o SOM - Sommer GmbH & Co. KG, Austria (partner 6)
REPORTING PERIOD : FROM 2002-01-09T0 2003-31-08
PROJECT START DATE z 2001-01-09
DURATION : 36 Month
Date of issue
of this report z 2003-04-01
Project funded by the European Community
under the '5tn Framework' Programme
(1998-2002)
EU-RTD
Projecrl$
,t, ill$iiïS,fftIdc b rechenhe roântnqeSNOWPOWER
,lY&faau,
d,ii#
Table of contents
1. EXECT]TIVE PT]BLISHABLE SIJMMARY ...2
2. OBJECTIVES AIID STRATEGIC ASPECTS.... 2.1. SOCIO-ECONOMIC OBJECTIVES AND STRATEGIC ASPECTS ...3
2.2. ScreNrrnrcirBcrrNor.oclcAI- oBJECTIVES ...3
3. SCTENTTFTC Al[D TECHNrCAL PERFORMANCE... ...5
3.1 SUMMARYoFTHESPECTFICPROJECTOBJECTIVESFORTHERELEVANTPERIOD...5
3.2. OvBnvrEW oF THE TECHNICAL pRocR8SS... ...5
3.3. CoMPARISoN oF PLANNED ACTIVITIES AND ACTUAL WORK BY THE PARTNERS ... ...22
3.4. Srern oF THE ARTREVTEw ...24
3.5. Pr-ANNBD ACTVITIES FORTHENEXTPEzuOD. ....,..,...,25
4. LIST OF DELIVERABLES
5. DISSEMINATION AND USE OF TIIE RESULTS , 1
7. GLOSSARY
EU-RrD
Projecqp
tt, mËff*fd. '.,Eheh. ki.ntnqwSNOWPOWER
,1&u
soÀr"-'er
{--$}
' Hydroj, Québec1. EXECUTIVE PUBLISHABLE ST]MMARY
Improving the energy production from renewable resources is an important global goal. Hydro power facilities fulfil this demand attractively and at the same time help to meet the Kyoto objectives of CO2 reduction. Efficient energy management of hydro power resources requires accurate forecasting of water capacity from snow melt and run-off. Yet the filling prognoses from snow melt for hydro power reservoirs is insufficient, because the calibration of remotely sensed data e.g. from satellite or aircraft is inaccurate. The objective ofthis project is to increase the precision offilling prognosis to at least 20%by calibrating the remotely sensed data with ground truth data determined by new snow measurement methods. As an example of potential benefits, a l0o gain in forecast precision at the 'La Grande Rivière'-catchment in Quebec (320.000 lcn2) would correspond to a yield of 2,2 TWh or 45 M€ or 1,6 TWh respectively 32 M€ for Switzerland.
By now a new electromagnetic cable sensor and prototype device for snow moisture and density measurements allowing a monitoring of an area of up to 2000 m2 and evaluation software has been developed in the laboratory. The software integrates an air gap correction algorithm and a reconstruction code that allows the determination of a moisture and density profile of the snow pack along the cable sensors.
Field measurements during two winter periods (2001/20A2 and 200212003) were carried out both at measurement sites in Switzerland (Davos) and Canada (Quebec). Data were evaluated and compared to reference measurements in the conceming snow packs with excellent and promising results. The measurements also help to improve snow hydrological models. Based on the results and experiences, a bench scale instrument has been developed and tested.
An output of the project will be an industrial device suitable for field application.
EU-RTD
Projec
tt, iffUi#,ffiid. r. rxh..<rr (!.nrtnq*SNOWPOWER
',i,"tfar*,
eiili{*
2. OBJECTIVES AND STRATEGIC ASPECTS
2.1. SOCIO-ECONOMIC OBJECTIVES AND STRATEGIC ASPECTS
The main objective of the SNOWPOWER project is the efficiency enhancement of hydro power stations, which generate energy from snow melt water. It belongs as the central relevance to EU Key action 'Renewable
energies' (5.2.5) and it will contribute to the increase of the share of renewable energy in the European and global energy balance in producing electricity at a cost far under 0,15 €/kwh. Seven countries of the EU plus Switzerland and Norway operate hydro power stations where the catchments are under snow cover in winter. Several other countries of the world have the same situation, especially in Canada where some of the world largest hydro power stations are fed with snow melt. Electricity from water is the cleanest energy transformation among the renewable sources. So, it addresses also the Key action 6.5.4 (Improving the efficiency of new and renewable energy sources). Hydro power generation avoids emissions, any kinds, especially green house gases. Their efficiency enhancement is the best contribution to the global CO2 reduction as required by the Kyoto agreements. The project will contribute to the consumer satisfaction and quality of life by increased electricity production without air pollution. The hydro power stations already have a high technical efficiency without severe consequences to the environment. This potential will be remarkably enhanced by the water management improvement as result of the project. It is a special possibility to improve an already good energy generation with excellent social acceptance.
The proposed solution for efficiency enhancement is suitable for new and existing plants without any restrictions. It does not need any hardware installations in the power plant itself. By this way the sustainable management and quality of water can also be improved. In this sense it contributes to the EU policy of sustainable use of water resources at catchment scale. A certain synergy effect will be expected to this policy. In case of project success Europe will have a good competition position for the industrial marketing of the technology and the Canadian partners will benefit directly from use of the technology and from exploitation in North America. In addition a new market will be created for the equipment and Europe will benefit by the increased demand for skilled employment.
The Society will also benefit from better flood prediction and avalanche warning as well as better management of drinking water resources that are fed by snow covered catchments.
2.2. SCnNTTT.IdTBCTTNOLOGICAL OBJECTVES
Water authorities often limit the by-pass water flux for the electric energy generation, in order to feed the natural environment with more water. An enhancement of the efficiency in such cases can compensate this water reduction. This situation is relevant in the alpine regions of, Austria, France, Germany, Italy and Switzerland as well as in the Nordic regions of Scandinavia.
The proposed method is innovative not only on the level of each single sensor but on method and system levels also. Beside the enhanced remote data calibration and better snow water equivalent (SWE) prediction, we expect an overall improvement of the satellite data driven hydrologic computation.
Advances in hydrological and climatological modelling can be expected also. We want to get a better understanding of the start and development of snow melting processes and a better conversion of the
EU.RTD
P
tt, iffiffi'S,Strd" !r ræhrrcfc *rcntmqcSNOWPOWER
*'&t'
sof,t*er Wf
't Hvdro; , - A u é b e c
measured physical data into snow properties distribution. It is obvious that we will get synergetic results for the avalanche warning and flood prediction as well as a better prediction of drinking water resources from snow covered areas. Finally the intended field installations and instrument fabrications including a remote control network will help to make data collecting much easier.
:u>\Fqa
8rf
}|]{F
F o r s c h u n g s z e n t r u m K a r l s r u h e T e c h f i k L r n d U m Æ A
EU-RTD
Projec
tt, m$i;gf f *fd" b'xh.Gh. sr.^tl! 6SNOWPOWER
,1&^. /'""*t^{r rtt-"J' t$H Hvdro 'j-, -Québec3. SCIENTIF'IC AND TECHNICAL PERT'ORMANCE
3. 1 . SUMMARY oF THE SPECIFIC PROJECT OBJECTIVES FOR THE RELEVANT PERIOD.
In the relevant period two different work packages that had already been started were continued (WP 4 and 5) and one work package was started (WP6).
In WP 4 the hydrological models and the corresponding forecast strategies for hydro power optimisation are to be developed. This WP started already in the first year and will last until the end of the project. Mainly the measurement results of the field campaign in WP 7 will be the input for the models and comparisons. It is expected that the extended hydrological model together with the ground and RADARSAT data will significantly improve the water reservoir filling prediction. Valuable data of the first two winter field campaigns were already integrated in the hydrological models and yielded very promising results.
The objectives of WP 5 are the development and building of a bench-scale instrument including a sensor network. It is planned to develop and build a weather-proof bench-scale instrument with an accuracy comparable with the laboratory instruments but with much less weight and energy consumption. The bench-scale instrument will be equipped with remote data transmission for easy integration into data acquisition networks. This shall be the third milestone.
h WP 6 a second field campaign is intended which will include the test of the bench-scale instrument. This WP was extended with some more field experiments to clarifu some nev/ aspects that rose during the first winter field campaign, especially conceming the installation of the sensors.
3.2. OVERVIEW oF THE TECHNICAL PROGRESS
WP 4 'Hydrological modelling'- After intensive discussions, the Canadian parûrers INRS and HQ proposed that the hydrological model likely to be used with the future SNOWPOWER instrument and EQeau (RADARSAT-I) spatial distribution of snow water equivalent is HYDROTEL. Comparison will be eventually made with the global hydrological model presently used by HQ, as mentioned in the description of the work to be done. The HYDROTEL model is a distributed model which, at the time of writing this report, is able to update its spatial distribution of SWE from a network of snow survey stations. So, SWE and thickness of snow pack derived from SNOWPOWER data could immediately be used instead of the actual snow survey data or in conjunction with them.
A new SWE updating option will be added to the model to accept the spatial distribution as estimated from SNOWPOWER and EQeau (RADARSAT-1 data).
Besides, using data in the same Northern Quebec environment as it is hoped to use the SNOWPOWER probes, we have been able to obtain avery good calibration of the CROCUS model. As a matter of fact, the model was able to simulate accurately the temporal evolution of the snow pack thickness as measured by a laser probe at three sites for three winter periods. Also, for each field campaign (twice a year) we were able to get good comparisons of measured and simulated values for SWE. The comparison of density and temperature profiles for each field campaign was also good. There is good reason to be
:u>l'Pqt
nr*5ç
EU.RTD
P
t, mffirffid"b'Krw.h. sbnrmq*SNOWPOWER
,+&"6
sob\"çJ'
{s,$
Hydro' - ' Q u é b e c
confident to use the CROCUS model to simulate the SNOWPO\MER data. The CROCUS model will also be used as a reference to verifu new options to be added to the snowmelt sub-model of the HYDROTEL model.
Although the contribution of WSL/SLF to WP 4 was planned only for the third year, some preliminary work was already started because of the strong interest of the Swiss group in hydrological modeling. The work first focused on calibrating models of different sophistication and the evaluation of the long-term performance of one of these models using a 25-year long data series. The following models were tested:
o A simple multiple regression model (Stâhli et al., 2002, Annals of Glaciology) - not physically based - with daily inputs of air temperature and snow precipitation.
o A simple single-layer snow model (Pellicciotti et a1.,2002, Geophysical Research Abstracts) with a temperature-index melt model including daily inputs of air temperature, precipiktion and albedo.
o A more complex singleJayer model (COllP, Jansson and Karlberg,200l, KTH Stockholm) with process description ofsoil frost, snow cover development, and a surface energy balance approach. (5 input variables; daily or hourly time resolution)
o A very detailed multiple-layer snow model (SNOWPACK, Lehning et al., SLF Davos) with sophisticated descriptions of snow accumulation, settling and melt - normally used for avalanche risk assessment. (5 or 6 input variables; hourly or 30 min time resolution).
The results from the different model tests can be summarized as follows:
A purely statistical regression model, including attributes of topography and forest density, as well as snow precipitation and positive air temperatures was not able to reproduce the temporal development of a sub-alpine snow pack accurate enough. For the WFJ site, the temperature-index model (Pellicioti et al.) did not significantly improve the snow melt simulation by including albedo due to the fact that the albedo was quite uniform during most of the winter. The two models with a more detailed physical description (COUP, SNOWPACK) performed pretty well the accumulation and ablation of the snow pack at WFJ/Davos. For the three winter seasons 1999-2002, COUP was able to simulate the snow depth with a coefficient of determination (.R2) of 0.95 (daily measured snow depth; n:950) and timed the end of melt season very well. These simulations also showed that with regard to snow depth and snow pack outflow the multiple-layer approach (SNOWPACK) was not superior to the singleJayer approach (COUP). As a consequence for our future modeling, we will mainly concentrate on a singleJayer model, which describes the snow hydrological properties well-enough and at the same time reduces the complexity of the model. This will be of special importance when we proceed to larger scales.
Il/P 5 'Development of bench scale instrument - The project team of the firm Sommer first assessed the theoretical aspects of the technical realisation of measurements in the snow. To determine both density and water content of snow two elecfonic measurement techniques are needed: a.) low-frequency Impedance Analysis and b.) high frequency Time Domain Reflectometry Analysis
With these assumptions a measurement system was designed to especially fulfil the requirements that are necessary when dealing with snow: wide range of temperature, low energy consumption and adequate for field use, i.e. easy and portable.
^ . \ Y ,
-Phl\rh< f-V *I>h-r'K
l{
ffiflS,Ïi*ia" b rehsch. kr.^trth*
EU.RTD
P
SNOWPOWER
soft#er
'ffi i:i:Ymb".
dffi#
The system consists of the following modules shown in Figure 5.
Figure 5 - Planned modules for the bench-scale instrument
Conceming the Low-frequency Impedance-Analysis, the first step for the development of the entire measurement system was the start of the design and configuration of the low-frequency impedance analyser. After investigation of different measurement methods for low-frequency impedance analysis, the following concept was established:
Concerning the mode of operation, the measurement frequency will be adjustable by software command and is generated by the DDS-method (direct digital synthesis). This measurement frequency is transformed to a measurement bridge, which is connected to the sensor cable. Lr the control unit, the magnitude and phase of the resulting voltage in the bridge is evaluated, digitalised and calculated and displayed via an interface.
The technical specifications are as follows:
Power supply: 12 V dc Operating temperature: - 40 oC +40oC
Measurementfrequency: 1kh2...3001<hz Measurement range: 10 pF...4000 pF
Data display: Magnitude and phase of complex capacitance
Parameteization: Remote control of measurement program via serial interface.
A detailed sketch of the planned set-up for the Impedance analyser module is shown in Figure 6.
F o r s c h u n O s z ê n t l u m Xarlsruhe
ï e c l r r t f , u c d l - l m w e l l
Multi-plexer
Impedance
Analyser
Controll Unit
Datacolletion
Comunication
+
Sensor
Cable
TDR
A,nalyser Time Domain ReflectometerPower Supply
EU-RTD
Projecfl
t t immp,ffiid"r.'(h*hrri. trrq*SNOWPOWER
: "'" ', HYdro-QuébecFigure 6 - Detailed sketch of impedance analyser module.
The first step for the development was the start of the design and configuration of the low-frequency impedance analyser. After investigation of different measurement methods for low-frequency impedance analysis, the following concept was established:
Concerning the mode of operation, the measurement frequency will be adjustable by software command and is generated by the DDS-method (direct digital synthesis). This measurement frequency is transformed to a measurement bridge, which is connected to the sensor cable. L: the control unit, the magnitude and phase of the resulting voltage in the bridge is evaluated, digitalised and calculated and displayed via an interface.
After the compilation of the concept of the measurement principle, the development of the impedance analyser was started. A test set up for experiments for the signal processing is being conducted. Also experiments with the measurement bridge in relation to measurement object-frequency-measurement are carried out.
A suitable TDR module was chosen and tested for application for the bench scale instruments. After suitable configuration of the module, it was tested in the field.
It was impossible to have the bench-scale instrument ready at the start of the second project winter (200212003} and also the plan to test the device at the Davos test site during the melting season in May 2003 could not be realized. But it was possible to test the bench scale instrument in the field at Sommer company.
At the mid-term meeting it was also discussed, if it makes sense to design a low-cost version of the bench-scale instrument, which only includes an impedance analyser and where only two selected
low-dlm
F o r s c h u n g s e e n t r q m Karlsruhe T ê c f f r l r r d l l m w e n Impedance AnalyserControl-Unit
Control
Data processing
DDS - sinus Oscillator 1 kHz-300 kHzPowersupply
EU-RTD
Projec
tt, iim,ffi f d. r. rxts.hc rl'ntnqwSNOWPOWER
{.,i!'8iîa0".
e
frequencies are used for signal evaluation. To achieve this, two sloping cables with different angles would be necessary and a profiling of density and moisture on the cable would not be possible anymore. It was decided to test this new set-up within work package 6 during the rest of winter 2003.
w/P 6
'Field test Davos and Alptal' - At the beginning of month 15 FZK and SLFMSL set up an 8 m sloping flat band cable sensor at Davos, Weissfluhjoch (WFJ)-test site (CH) at an elevation of 2550 m for monitoring vertical variations in the snow properties in the run of the winter and to test a new installation method. To keep the band stable also during situations of heavy wind and massive snow load this time no poles were used but the cable was mounted with a steeper sloping angle and with a specially designed brake suspension. Three additional flatband cables were laid out horizontally during winter and were covered by snowfall.
An installation of a second sloping cable was carried out in April 2003 at Davos before the melting season with the aim of testing a different installation fixation and testing a new measurement algorithm which needs two sloping cables with different angles. Unfortunately one sloping cable was damaged shortly after installation and therefore no simultaneous data of the two sloping cables could be evaluated and the algorithm could not be tested.
During the test at Weissfluhjoch we closely inspected the behaviour of the snow band cable and the electronic system under harsh alpine winter conditions. In particular, the following critical components of the system were examined:
o Suspension and set-up of the sloping cable
The original suspension, consisting of a wooden fastener attached with ropes to two iron springs, failed twice during the first winter: after a heavy wind storm in the second half of January, and towards the end of the winter season, when the snow load (maximum snow water equivalent: 740 mm) became too heavy and a spring broke. Consequently, an improved suspension was designed for the second winter consisting of a cylinder with a mechanical brake (Fig. 5), which kept a constant pressure on the cable. The suspension adjusted continuously when the snow load increased, by releasing the cable.
The slope angle of the cable sensor is one of the key-factors for the formation of an air gap around the flat-band cable, as well as for the bending of the cable inside the snow pack.
In the first winter we set up the cable at an angle of 30o to the ground surface and tried to keep it in its original position by fixing it on 3 vertical poles. Such poles, however, proved to have negative impacts during the snowmelt by preferentially melting the snow and generating air gaps around the pole. Also a sharp bend of the cable formed at the head of the mid-pole after snow pack settling during the melting period (Fig. 6). In addition, the poles were not stable enough to withstand the heavy snow load and bent considerably towards the end of the season. Consequently, for the second winter we decided to set up the cable at a steeper angle (45') and to omit the supporting poles. The steeper installation reduced the snow load on the cable, and the cable was kept in its original position during the whole winter. However, we noted increased flickering of the cable in moderate to high wind speeds in the absence of supporting poles. These movements of the cable most likely generated the large air gaps observed at the surface, and
:h'^r\Y'rk
ilr>ldF
EU-RTD
Projecns-
l{ jffi*grffio. b ilh.rhr rt nttttq.,SNOWPOWER sohôer
w Ql'affi'".effi#
may have caused a cable failure during a snow storm in January 2003. A further complication was a 90o trryist of the cable around its own axes, which may have increased the water flow along the cable (Fig 6). Apart from these problems we believe that the new suspension at a steeper angle has improved the installation, and could be further improved by the combination with springs to reduce the lateral movements of the cable.
Figure I : Suspension of the snow cable sensor for winter 2001102 (left) and winter 2002103 (right). o Air gap
Air gaps along the flat-band cable are highly undesirable since they both falsifu the electonic signal and may- also tansfer melting water preferentially along the cable. The influence of an air gap on the measurement results can be partially corrected with our correction method, but with respect to a potential preferential water fransport along the cable it was crucial to thoroughly inspect the size of the air gap and evaluate its importance as water flow path.
At both sites the air gap showed up in different sizes and shapes, depending on wind speed, wind direction and melting intensity (Fig. 7). The assumption of a symmetric air gap, which is made in the correction algorithm, was not appropriate for many situations. There were dates (27 Feb,2003; Alptal) where an up to 5 cm opening formed on one side of the band-cable, whereas the other side was in close contact with the snow. At the Weissfluhjoch site the air gap was mostly generated by wind. Hence, the compass orientation of the flat band cable was decisive for the shape of the air gap. We also observed that air gaps were able to fill up again when the wind conditions had changed. Our overall conclusion was that the shape of the air gap at the snow surface was very dynamic and unpredictable. Inside the snow pack, we did not find evidence for significant voids around the cable when we excavated the flat-band cable at the sub-alpine site, Alptal, on March 1't, 2003. This was at a stage when the snow pack had settled to a density of 290 kg m-' and liquid melt water had penetrated to the bottom of the snow pack (Fig. 8). Close inspection of the flat-band cable was also carried out to examine whether the snow-band had conducted melt-water preferentially during the snowmelt. A dye tracer had been applied 15 days earlier (prior to the snowmelt) on the snow surface (area indicated in Fig. 8). A vertical profile was excavated along the cable and perpendicularly atthe lower end of the cable. No stained water was detected at the
ttt mffififfid" b '"dnîrn
d."fi rr
EU.RTD
SNOWPOIVER
Qlltf;*.
dffi#
lower end of the cable whereas to the left and right of the cable end considerable stained areas were detected originating from lateral water tansport along snow layers. There is evidence that some dye did follow the oable for some distance before finding alternative flow paths to the side of and below the cable, but we did not find indications of extensive lateral water flow expressed in terms of intensely stained areas following the direction of the cable. We think that \ile can oonclude in general that water flow along the cable is not greater than the natural lateral water flow in the snow pack'
Concerning thermal effects of the sensor on the sunounding snow, we formd some thermal radiation effects of a horizontal cable only once, shortly after it was laid out on the snow surface and the coverage by fallen snow was only very shallow. But as soon as the cable was covered with more than 10 cm of snow, this effect was not found anymore.
Figure 2 : (left) Preferential melting around the supporting poles and formation of a sharp bend at the head of the pole in winter 2001t02, (right) Large air gap at the air-snow-interface of the twisted sloping cable in
winter 2002103.
Weissfluhjoch Weissfluhjoch Weissfluhioch
12-Jan,2003 12'Jan,2003 2GFeb,2003
sensor
1
sensor2
Figure 3 : Observations ofair gaps at the snow surface in the vicinity ofthe snow cable sensor.
1 1
FoEchun g$n|lum K.d!7qho
EU-RTD
Projecr{-SNOWPOWER
tt,
il1æ,ïï,#fifii'd. b r&hr,.(hs xr{nrmquc
Hydro
Auébac
Qu*{+
Uppêr end of the flat-bând cable Trec.rapplicâiion /
areg ,''iffi6;"
dùûry
Figure 4 : Dye tracer indicating the water flow paths during a melt event at the Alptal-site. (left) Front view at the cable end showing no dye tracer in close vicinity of the cable. (right) Vertical cross-section along the
flat-band cable. Terrain slope-direction is indicated.
o The electronic system
The system uptime was high also in the second winter (80%). The automatic start of the measurements occasionally failed at the interface between the controlling PC unit and the Tektronix. Since this happened mainly at very low temperatures, we think this is a temperature problem of the electronic components of the Tektronix device, which was not built to operate urder such low temperatures.
e Comparison of snow sensor measurements with manual measurements
Dielectric constant, bulk snow density, and liquid water content of snow pack (mean value along the cable) were calculated from the raw signals and the moisture distribution along one of the horizontal cables was reconstructed for different stages of the winter. The natural settling of the sno\ry cover was reflected nicely in the horizontal cable measurements (Fig. 9). The snow density increased from initially
100-200 kg -'to approximately 500 kg --'at the end of the winter season, which was in accordance with manual snow density measurements of the corresponding snow layers. The two cables located at two different depths of the snow pack also reproduced correctly a higher density in the lower part of the profile in February (cable 1) and a faster compaction in the upper part during the snowmelt (cable 2). However cable 2 seems to have systematically underestimated density, which we think may be explained by spatial differences in the measurement spots of cable and manual density measurements.
No liquid water was detected with the horizontal cables until the end of April, after that the snow pack had reached its maximum depth (Fig. l0). This is supported by the automated snow temperature measurements, which indicate dry snow conditions and temperatures well below zero before this period' Once the snowmelt set in, we measured the steadily increasing liquid water content with the horizontal cables indicating the downwards penetration of the wetting-front. The upper cable (no. 2) not only reflected an earlier and faster increase in liquid water content than the lower cable, it also reacted more clearly to the diurnal variation caused by melting during the day and refreezing during the night.
EU-RTD
Projecrl$-
ttt iiËffi;fr,ïfifd, b'Éh.nh. rl.nrnqhSNOWPOWER
soÊr\'qer
W
KTH(J."'8[?r".
effi#
With regard to the spatial variation of liquid water, the horizontal flat-band cable nicely demonstrated the formation of preferential water flow paths adjacent to the cable (Fig. 11), which is the natural process of water transport in a melting snow pack. The horizontal cable at about I m below the snow surface indicated in mid May an emerging water conducting zone at 14 m from the cable end, as well as a newly developing flow finger at 8 m from the cable end.
The measurement results yielded good correspondence of the snow pack density with manual reference measurements taken twice a month at the measurement site. Also, the determination of liquid water content from measurements of the dielectric constants according to Tiuri and others (1984) gave plausible results, both compared to lysimeter data taken on the test field and with regard to the spatial variation of flow fingers that we normally experience in a natural snow pack..
We leamed that the suspension of the cable sensors is a crucial point in the measurement. For successful measurements it is indispensable to reduce the following sources of error:
o Air gaps between cable sensor and surrounding snow must be minimized, although it is possible to correct for minor effects.
r The suspension of the cable sensors must allow the cable to settle with the snow pack, but at the same time must be robust enough to withstand heavy winds and snow loads.
'Field test Quebec'- Although not planned in WP 6, INRS and HQ made additional field tests in winter 200212003 to improve the installation method, to get experiences of the system in an additional but different snow pack and to study algorithms for relating non-polarimetric (RADARSAT-I) and polarimetric radar data (RADARSAT-2) with point measurements (i.e. snow density, SWE). Also the EQeau model will be adapted to make use of the data from the cable sensor.
Again the J.-C. Chapais Experimental Farm of Agriculture and Agri-food Canada,located in an open field near Quebec city, P.Q., Canada (46"46'18"N, 7l'12'15"W) was chosen as research site (figure 1). The field has a mostly flat surface with a slope of 0-0.5o/o. An automated weather station installed on the site records different meteorological parameters such as air, snow and soil temperatures, etc.
F o r s c h u n q s z a n t r u m x a r l s r u h c
EU-RTD
Projecrf-SNOWPOWER
I
' " - - r . \
Figure 5 : Study site location.
Installation design
The physical installation of the sensor in Canada was developed around three objectives: (1) to test different support types and to find the most suitable one for this environment; (2) to acquire data on a larger surface for inputs into hydrological models and comparison with remote sensing images and (3) to get a diversified dataset in order to better validate the measurements.
Four 10 m flat band cables were installed at the experimental site in the fall of 2002. Two thick cables and two thin cables were tested. It was also envisaged to test which of the two cable types was best suited for the measurements. To obtain data on the larger area possible, a "star shaped" installation was designed, using three sloping cables (two thick and one thin) starting from a central point, 1.5 m above the ground, oriented in opposite directions at a l20o angle and ending to the ground level (Figure 2). The covered area was approximately 300 m'. The other thin cable was installed horizontally (horizontal cable) at 25 cm above the ground.
Through 32 m coaxial cables, each sensor was hooked up to a multiplexer into a heated shelter (15"C). Each cable was sequentially selected for Time Domain Reflectometry (TDR) and impedance analyzer measurements, a computer controlled process.
u'r'llo"1
er {;
,r,
imili;,*,ttrd. b ?(hdch. (ranrnrqu.
Hydro
Auébec
*l >çy*
Êti7T^rrs
EU-RTD
Projecf-r$-
tt, m$',ô,Ë#id. r.'(h*hr Kr.nr*rq'SNOWPOWER
sdrdbr
ffi) ff,ai?a".ei[l#
Figure 6 : SNO\ilPO\ilER sensor installation at the Canadian experimental site Data acquisition
From December 18th, 2002 to March 20th,2003, weekly measurements (high and low frequencies) were made. From March 20fr to April 14tr (melting season), data have been collected almost daily. Throughout the season, concurrent field data have been acquired. Every week, 12 snow cores were collected to measure snow depth (cm), snow water equivalent (SWE, mm) and the mean snow pack density (kg --') around the cables. A weekly snow profile was also done at the test site. During the melting season, at the time of the measurements, another snow profile was done near cable #3, giving the snow temperature, density and liquid water content at every l0 cm.
Results and discussion
During winter season 2002-2003, no significant rain or melting event had happened, leaving the snow cover relatively dry from the beginning of January through mid-March (Figure 3). fluring that period, the diurnal air temperature stayed generally below the freezing point. On March 20ù, the melting period began with an increase of air temperafures steadily above zero, combined with significant rainfall events and no refreezing period until March 31't. From there through April 9tn, the air temperature dropped back below OoC and the snow pack refroze completely. After that, a cycle of diumal melting followed.
F o r s c h u n 9 s æ n t r u m K a r l s r u h e T ê r h n r l ! r n d 1 . r l J ] w l l
EU-RTDProjec@
ftt ifiS;,iifiid. r..xrq<h. xi.nlnrqÉSNOWPOWER
sohlbr W ff'6i?0". Rill
Prior to March 206, the density of the snow pack had slowly increased by way of metamorphism and compaction of snow. The observed snow density had increased more rapidly during the spring melt period, which is in accordance with other observations made for various climates in Canada.
Considering the heterogeneous spatial distribution of the snow at the test site, we present in Figure 4 an averaged snow density and snow depth for the 3 snow samples near cable #3.
F o r s c h u n g s z a n t r u m K a r l s r u h a - Air tempêrature fC) N Precipltauon (cm) 4 , 5 4 , 0 3 , 5 3 , 0 2 , 5 1 5 1 0 5 0 -5 - 1 0 - 1 5 c C' g c (E CL o 0, È 2 , 0 1 , 5 1 , 0 0 , 5 (J o 0) = lE q, e E o, 0 , 0 -20 | I -25 | I
-30 [r
f,l -35 ûr ôl Q o f! c{ c\t c! c\t c) (Yt c, (v, (q (9 (vt (v) (') (1 (ç) (', (', (9 (') (? (" (f, (t (" Q e Q Q q e e Q Q A A A e e e q a q a q a q Q PP R R
È = 3 È P N R R
R È P R R B P P
R R È * *
C{ N C{ C.l - F F - C.l C\ e.l e{ av' <Y) (9) (9 (9
Date
Figure 7 : Daily variations of air temperature and precipitation
EU-RTD
Projecr$'L
SNOWPOWER
tt, m;#,i#id. r. rchùrh. krcnrmq* Hydro Québeceffiàx{
120 1 0 0 80 = E Ë 6 0 o. o : A N = o tr o20
3? tr -E') J o Ê oo
200
1 0 0
0
ç! (9 (ç) (*' (9 (v) (9 (9 (9 (v) (9 (9 (t (ç) (9 (9 (') (9) (9 (*) ('' ..' Q Q Q Q Q Q E g Q E E E Q E E A E Q E Q E A CO ç\ @ (0 Ë O |\ol, f*tl) ç cl- É f\ @ - C\ .sf O) - 't = Q Q { s I s ? Q = t I Q < q q q q A { e q q < ç ({ - - - F - e{ C\ C.l .'t (9 c.) (*) (9 at, (e, (v) S T Ë Ë É Date --+- Snow depth [cm] - 1 I I Density [kg/m -]Figure 8 : Reference data ofthe sno\ry cover near cable #3
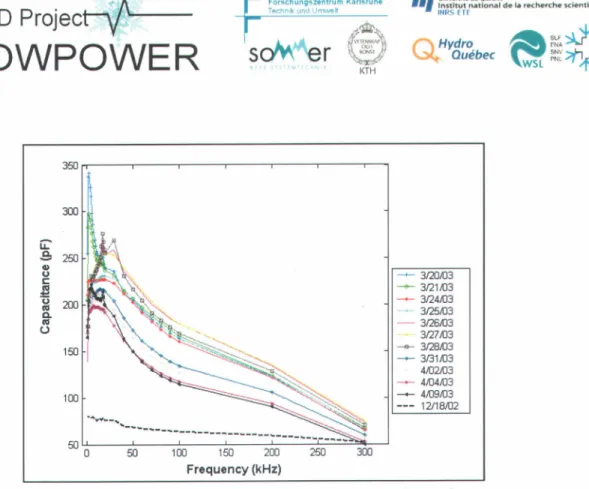
This report focuses on the results obtained during the March 20 to April 9 period (melting and refreeze), with cable #3 (thin cable), which has been previously calibrated.
Low frequency measurements
Figure 5 shows the capacitance values measured with the impedance analyzer for several dates of the melting period. We have included the measurements of l2ll8l02, which corresponds to the beginning of snow accumulation on the ground. We can clearly see two groups of capacitance, corresponding to the melting and refreezing period. Usually the spring melting period starts gently with a diurnal-noctumal thaw-refreeze period, followed by a more intensive melting period (isothermal snow pack state). As we described earlier, the 2002-2003 winter started with an intensive melting period, followed by a thaw-refreeze period.
EU-RTD
Proj
tt, ifrffi;'*,fttrd. b'(hc'ctr rr.ôrmquSNOWPOWER
sof,1'.br
+8'.r ù f ' t(TH f '\ Hydro \.-.{'{., Québec J5U 3m lr tL ^-^ v l)u al I tr .g E 2orl(L aÉ (J 15u 1 0 0 50Figure 9 : Capacitances values for the dates under study
Zooming on the 50 to 100 kHz frequencies (Figure 6) we can see more specifically, three groups of data, corresponding to the following environmental conditions:
- Melting period: From March 20th to March 25s, the air temperatwe was steadily above 0oC. A heavy rainfall event happened from late March 20'n to the next morning. Despite all this incoming water, the wet front advance was limited to the top layers because of the low temperatures in the snow pack. When the water percolates from the surface to the underlying and below zero snow layers, the water front advance tends to create both ice fingers and horizontal ice layers. So the underlying layers stayed relatively cold and dry on March 21" (Figure 7, table l).
- Isothermal state: On March 26th and 27'h, the snow cover was completely in an isothermal state. Another rain event occurred. All snow layers show significant liquid water contents (>3%) and maximum capacitance values.
- Refreezing period : from March 31't to April 9ù, the air temperatures decreased below the freezing point which resulted in gradual refreezing of the entire snow cover (Figure 7), intense snow compaction and a significant drop of the capacitance values (Figure 6).
Q'*
F o 6 c h u n g s æ n l r u m K a r l s r u h .
EU-RTD
Pro
ttt m$.ffifd. b Gh-rtr. rrmtrnq{SNOWPOWER
soÀ$er
fffi
'\r*#KTH
Q'8t?0".
G*in
,rô,.F
??0 ?00 l! rÊn g * o (, .-^ ç r w g (, c 1 r û ! O t2ti t00 8t 60 55 60 65 70 75 80 85 9l 95 lon Froqucncy (kHz)Figure l0 :7,oom on the 50 to 100 kHz frequencies
':r--"--l
I r..dz."m I ï"l
: l > 1
't ,.rr.,l"r.1q ' [ "-*zo',rm ]t
\
l
t > l
I
:
I
- 2 o 2 r Ë : r 1 0 I ! m ! o I t o 1 0 0 l..d| 2f,2m -____.-__-\ -l ./ \ ,/ I t 0 5 7g g) æ t 0 i 5 - 1 . 0 € 5 0 p r.mp.dn fq { 1 0 r + 1 0 s l I 7 0 1 7 0 I.rd2f. ru: t
) :
[ 0 I ro F l , T.mD.ft0[ fq s 70 I..cb l|h, æ s04 :
apn of, zm It
1 1 0 5 rc s 1 0 0 apil oa*,2@ 0Figure 11 : Temperature profiles for dates under study
EU-RTD
Projecrfr
tt, m'Jg,iâid. b .Gh.ft h. xrcilmqÈSNOWPOWER
These data confirm the sensitivity of the probe to snow properties changing. The capacitance values depend on the dielectric constant of the surrounding medium. At low frequency there is an influence of snow crystal shape on the dielectric constant which is a function of temperature, as expressed by equation (6).
High frequency measurements
The high frequency measurements are also sensitive to the snow properties. Figure 8a shows the difference of the wave travel time along the cable and the transition zones between air and snow for selected dates during the melting period. We can notice the difference of the reflection of the TDR signal at the beginning and the end of the sensor cable and the values of the transition point (fravel time) air -snow. It is well-known that at high frequency there is no temperature and frequency dependence on the dielectric constant (Tiuri et al. 1984). Therefore the dielectric constant is mainly a function of snow density and water content. From March 20th to 25e (Figpre 8b), warmer air temperatures and rainfalls caused a decrease of the temperature gradient within the snow cover and snow melt. Liquid water content was present in the top layers and gradually moved downward. Only on March 24*, the liquid water content started to modiff the TDR trace, causing a small bump that appears at the beginning of the curve. On March 26û and 27û (Figure 8c), the remaining snow cover had reached a complete isothermal state. All snow layers showed significant liquid water contents (>3%), which produced significant variations of the voltage pattern at the beginning of the curves and smaller changes at the end of the curves. From March 28th to April 9fr (Figure 8d), temperature dropped back below the freezing point. The snow liquid water content gradually decreased to 0o/o in all layers of the remaining snow cover. The bumps at the beginning of the curves were now related to the intense compaction of the snow pack in this period.
Snow density analysis
As explained in previous sections, the snow density was calculated using the high and low frequency measurements of the sensor (cable #3).
dlll
F o r s ç h u n g s z a n t r u n K a r l s r u h . T ê c h n r k i n d L l m w l l
EU-RTD
Proj
t, iffiffi;,iffid. b'Éhd<h. srcnttnqwSNOWPOWER
sotn'aer
{""îT"\1*&t \rey''"r KTH (-t HYdro b\>( Québec 2.2 2 ; 1 . 8 e G Ë t'u g P r.+ I € r.z E É 1 Trmllimo (t2n8æ) = 5.7æns Tfmhimo (320,'Ug - æ.GnB Træhim. (327I}3) = æ.7738n8 Trælllitr. (t,{}9,113) = 18.0911 ng 150 160 170 180 100 200 210 220 RaltlY. dmo lnslE
Ê, Ê I É I t 50 160 170 180 100 200 210 220 Reletvâ 0me lnslE
o EI É o É o I G 6 É, Rel.tve ûme ln3l - 3126/03 - 3t27t03 0.t 150 160 170 180 190 200 210 220E
É Ê o n E t -'i5o160 1to i8o igo 2oo ?10 22 Relauve tlmo [n3l
*l *Iqt
:ff445
Figure 12 : TDR traces for a) selected dates representing different sno\ry cover conditions, b) melting period, c) isothermal state, d) refreezing period.
Figure 9 shows the comparison between these densities and the field measurements. It also shows the values of the calculated dielectric constant. The mixing rule used here is Looyenga's semi-empirical dielectric formula, which provided the best results. We notice a good agreement between measured and calculated density, which are also correlated with the observed environmental conditions. The correlation coefficient is 9l%. However, it should be noted that the accuracy of the validation data is. dependant on the accuracy (14%-5%) of the density measurement devices. Moreover, on April4'n and 9'n, the refrozen snow was too hard to take reliable manual densitv measurements.
EU-RTD
Proje
ttt ifiS','i Bilid. r' .Ghd(h. sr.nrnrq*SNOWPOWER
soÀ{br
ffi} (}."8t?,".
ei[l{{
500
A Density calculated (g/cm3) + Density sampled (g/cm3) --o- Dielectric constant\
4 , 0 0
3,75
3 , 5 0
3,25
3,00
2,75
2,50
2,25
2,00
1 , 7 5
1 , 5 0
1 , 2 5
1 , 0 0
400
1 0 0
Date
Figure 13 : Validation of SNOWPOWER calculated densities
Conclusion
The validation of the dataset acquired in the temperate snow cover in Chapais during March through April 2003 showed very good results, concordant with the recorded meteorological data. Both high and low frequency measurements were influenced by the metamorphism of the snow properties such as density and liquid water content. The comparison between the calculated snow densities using cable sensors and the manually measured densities showed a correlation coefficient of 0.91 and a Root Mean Square Error (RMSE) of 40Â. For the melting during the isothermal period, the calculated RMSE is as good as 30Â and for the refreezing period, the RMSE is 50Â. This increase of the RMSE is due to the difficulty to get a good sample in the hard refrozen snow. In light of these first results, the SNOWPOWER probes seem to give reliable results and represent an operational tool for continuous monitoring of the snow cover properties.
3.3. CoupnruSoN oFPLANNED ACTIVITIES AND ACTUAL WORK ACCOMPLISHED BY THE PARTNERS.
ll/P 4 is running according to schedule. After HQ and INRS started the adaptation and extension of hydrological models to incorporate the ground truth data from the snow sensors, snow density and snow weùress data acquired in the field tests were used for incorporation into the hydrological models. Although contributions to WP 4 from the Swiss partner was planned only for the 3'o year of the project,
tr o u c o (J (J L u o (l) ô fr E
g 300
h :E v, c oo 200
(f, (f, (f, (f, (f) cf, (f, (f, (., (f, (fJ o c t o o ( f o o o o o oÈ = + b ô È ù = N + ô
c \ t c \ N c { c { c ! N ( f r o o ob ù ù ù ù ù ù ù + + +
F o r Ê c h u n g s z e n l r u m X a i l s r u h e22
EU-RrD
Projecrlf
,tt imiË,ffid" b r-hxh. idê'iltnqsSNOWPOWER pohr*'er
ffi i'J,!'8îîe0".
mffl#
preliminary modeling work was started already in the first year, which aimed at calibrating models of different complexity to a high-alpine test site, as well as to a second research site with milder winter conditions representing the sub-alpine zone. The second goal was mainly an evaluation of the long-term performance of one of these models using a 2i-year long data series.
The work to be undertaken in WP4 is well started and in good progress. Due to the additional field tests in Canada during the first and the second year of the project and the earlier start of the Swiss group to work on this WP, the progress is a lot ftrther than planned.
I(P 5,the development of the bench-scale instrument, was started in month 10 as planned. First the necessary properties and technical specifications were specified according to experiences from the first winter measurement campaign. Based on a study of the used devices the elecfonic design for the low-frequancy impedance analyser, was established and the necessary modules specified and acquired. The development of the hardware was started. In the mean time, a suitable TDR-module ('TDR 100' by Campbell ltd.) as block 2 of bench scale device is tested for possible implementation.
WP 5 could not be finished in time since we had some problems with . '.
WP 6, Since the start of the second winter was very much earlier than the planned manufacturing of the bench-scale instrument, we could not install the bench-scale insfument in the field at the beginning of the second field campaigl. We then planned to install the bench-scale device at the Davos test site at the beginning of the melting season, but also this plan failed, since the development required more time. Preliminary field tests were finally carried out at the Sommer test site near the company.
These tests were started as planned in month 19, but to test it under winter field conditions, this WP must be prolonged and tests will be continued in the 3'winter season of the project.
All in all much more work than planned was carried out in WP 6. Since the bench-scale instrument was not ready in time, we used the measurement set-up of the first winter to collect more data and to improve or knowledge on the measurement of the snow parameters, the installation of the sensors and the interactions of the sensor with the snow pack. kr Switzerland an additional test field at a lower station was equipped with dummy sensors and a facer test was carried out to investigate the influence of the cable on the melt water flow.
Additional tests in Canada were also ca:ried out to increase the experiences in a temperate snow pack and to test both different fixation and orientation methods of the sensors
With our field studies of the second winter we intended to explore the "true conditions" inside the snow pack and, therefore, accepted disturbances ofthe snow pack.
The following questions had to be answered:
o What sloping angle, what suspension and what set-up of supporting poles will be the most favourable to keep the cable in its original position and to prevent sharp bends, contortion and rupture when heavy snow loads or wind forces impact on the flat-band cable?
o Is there an air gap along the sensor? If so, how large and of what shape is it? o Is there a preferential water flow along the sloping cable during the snowmelt?
F o r s c h u n g s z e n t r u m K a r l s r u h ê
tt, im$[ffi'ffifd" h'Ër.*rç xknr,nq&
EU-RTD
P
SNOWPOWER
ffi {*i!,âi,îe.".
effi#
o How do the horizontally installed flat-band cables impact on the natural water flow-paths inside the snow pack?
The following experiments provided answers to the questions above:
Four sloping cables with a new-developed suspension, different slope angles and with/without supporting poles were installed at Weissfluhjoch and Alptal (CH) in October 2002. During the winter we examined the behaviour of the band cables (bending, skewing or breakage). We were also able to compare the measured signals of these sloping cables and conclude about the influence of the set-up on the signals and the accuracy ofthe derived results.
Towards the end of the season - during the snowmelt - a dye tracer was applied on the snow surface where the flat-band cables enter the snow pack. After some days with melting we carefully excavated vertical sections perpendicularly to the flat-band cables and examined if the stained water has moved preferentially along the cable. At the same time, we determined the occurence and nature of air gaps.
At the sub-alpine research site Alptal, a dye tracer experiment was carried out to visualize the water flow paths inside the snow pack and especially around the horizontal cable sensor. The tracer was applied on the snow surface 10 - 20 cm above the cable sensor at the beginning of a snowfall event to ensure that no preferential melting will occur due to the changed albedo. After the first major snow melting we excavated vertical profiles perpendicularly to the cable and photographed the flow pattern as shown by the dye facer.
Again parallel field experiments were carried out in Canada. To make automatic measurements possible, we realized the same measurement set-up (configured laptop+ multiplexer *program for INRSIHQ to run TDR and IA) than in the previous campaign at Davos for Chapais.
The'GetMoisture'program was used to rekieve the snow characteristics from these data. A permanent heated shelter was installed on the Chapais site so as to facilikte measutements and possibly enable automatic data acquisition.
Furthermore, in October (Month l4), a dummy test-site was installed in Northem Quebec by HQ for testing the behavior of the cables under a harsh environment. This was done in preparation for the large scale field installation in the winter 2003-2004 (WP7).
At the end of the winter season 2002/2003, some field tests with the bench-scale instrument were carried out ([,rgebn i sse DWD-Sensttr)
3.4. Srarp OF THE ART REVIEW.
Conceming the cable sensors, the results of the first two winter periods in Switzerland are excellent. TDR measurements were carried out during the whole period without problem. The low frequency measurements made some problems because of a breakdown of the impedance analyser. The device had to be replaced, which was carried out just in-time before the important melting period.
Results to date far exceed of what is available of currantly used measurement methods and data collection.
EU-RTD
Projec
,t, im$tffi fd. b'*r'*h. (lrntrnq ESNOWPOWER
sof,\"qer
W
{-,1!'*,în0".
effi#
3.5. PLANNED ACTVITIES FOR TFIE NEXT PERIOD.
WP 4 - Within the last year of the project, the SNOWPOWER data will be simulated using the French CROCUS snow evolution and melt model. In practice, the CROCUS model will be used to simulate snow depths, SWE and density profiles as would do the SNOWPOWER probes at various sites. These density profiles will be used as input to the EQeau software to get spatial distributions of SWE from RADARSAT-I data. The SWE also obtained from the model will be used to check the spatial SWE distributions derived from RADARSAT-I data. Finally, simulations of continuous snow density and snow wetness data will be used to test their integration into the hydrological models.
WP 5 - The WP will be finishedpresumably nmonth2T
WP 6 - This workpackage is regarded as finished. Further tests of the bench scale instrument are carried out in WP 7.
Il/P 7 -This work package will be started earlier than planned , againbecause of the earlier start of winter compared to the schedule.
On the aspect of combining field data at Chapais with acquisition of RADARSAT-I satellite data, image acquisitions are planned for .... . Furthermore, two airborne missions of the CONVAIR-580 polarimetric SAR (Canadian Space Agency) are planned over the Chapais test site. These data have the same characteristics as what should be available with the Canadian satellite RADARSAT-2 to be launched in 2004. We are still waiting for the confîrmation of the flights. During the next six months, INRS will also study algorithms for relating non-polarimetric I) or polarimetric radar data (RADARSAT-2) with point measurements (i.e. snow density, SWE). When both data sets are available (radar data and SNOWPOWER data) INRS will also adapt its EQeau model to make use of the data from the cable sensor.
WSL/SLF also wants to test further the numerical snow models and extend them to larger scales.
,tt mp,ffid. b'6hdch. *rGntrfiq*
EU-RTD
P
SNOWPOWER
'"tet^sof,l.dgr ,W,I
4. LIST OF' DELIVERABLES
Deliverable No Deliverable title Delivery olanned Delivery issued Nature
1 0
Installation zuide for the sensor systemI 2
24
Ret 6
Bench-scale instrument with detailed description 1 8 Presumably27 Eq
Annex: Nature of deliverable O means computer code, Eq means equipment, Da means data, Me means method, Re means report
Deliverable 10 was delayed since it required experience from an additional winter field campaigr for completion. This was done in WP 6.
Deliverable 16, the bench-scale insfument, tumed out to be more work-intensive and was not ready at the beginning of the second winter for adequate field test, why the issue date was postponed.
F o r q c h u n g s z o n l r u m K a r l s r u h ê
ttt
i#ffi'Ë,ffiId. !'.æh.Khe Klint.rq@
EU-RTD
P
SNOWPOWER
5qb{'$ef
W
ii;Y'g*,".
mffi*
5. DISSEMINATION AI\D USE OF'TIM RESULTS
Parbrers 4 and 5 (HQ and INR) will apply the measurement results of the next field campaign for interpretation of Rr{DAIL{SAT images in the coming season.
Further potential for the dissemination and use of the technique, data and experiences can be found in the fields of water management of drinking water resources with snow covered catchments and in the field of soil moisture measurements and remote sensing over bare soil.
The planned participation of Statkraft-Groner or Sintef (both Norway) in the Snowpower project is postponed due to questions in funding the Norwegian part. Possible installations of sensors in Norway are being investigated.
In the second year of the project, the following publications and conference presentations resulted from the project:
NORGREN, M.: A simple approach to quasiTEM analysis of a planar multi-conductor structure embedded in an elliptically statified environment.- Microwave and Optical Technology Letters.
STACHEDER, M. & BRANDELIK, A. (2002): Schneefeuchtebestimmung - Ziele, Methoden, Ergebnisse.- (Snow moisture determination - Goals, methods, results in german).- in : K. KUPFER & E TRINKS: 11. Feuchtetag2ù0Z, Weimar, pp 197-204.
BRANDELIK, A., HUEBNER, C., SCHUHMANN, R. & STACHEDER, M. (2003): Determination of Snow Densrty and Snow Water Equivalent for Hydro Power Generation.- ISEMA Conference, March 2003, Rotorua (NZL).
STACHEDER, M., SCHLAEGER, S., BRANDELK, A. & NORGREN, M. (2003): A new in-situ sensor for large-scale snow cover monitoring: I. Principle, design, and air gap correction.- Symposium of Int. Glaciolog. Society, June 2003, Davos, CH.
STÂHLI M., STACHEDER M., GUSTAFSSON D., SCHLAEGER S., SCHNEEBELI M. &. BRANDELIK A. (2003): A new in-situ sensor for large-scale snow cover monitoring.- Annals of Glaciology (in press).
NIANG, M., BERNIER, M., GAUTHIER, Y., FORTIN, G., VAN BOCHOVE, E., BRANDELIK, A. & STACHEDER, M. (2003): Integration of polarimetric SAR data and Snowpower probes data into the EQeau model for snow monitoring.- IGARRS 2003 conference, July, France (accepted) STACHEDER, M.; HUEBNER, C.; SCHLAEGER, S. & BRANDELIK A. (2003): Combined TDR and
low-frequency permittivity measurements for continuous snow weûress and snow density determination.- Springer Verlag (in press)
STACHEDER, M.& BRANDELIK, A. (2003): Messungen der Schneefeuchte und Schneedichte fiir die optimierte Auswerhng von Satellitenfemerkundungsaufnahmen (Measurement of sno moisture and
F o r s c h u n g s z € n t r u m K a r l s r u h e T É c h f r k ond l-lm@lt
EU-RTD
Projec
SNOWPOWER
sohser
ffi
i.l,"*;eau.
ffim#
lt,
iffiSfitffifdç b .Él'*h. xr.ntiqw
density for improved evaluation of remote sensing images, rn german).- Proc. ,Innovative Feuchtemessung', SMG-Workshop Karlsruhe (in pre ss).
EU-RTD
Projecfl
SNOWPOWER
ft,
mi$rffiid" r.'(tffi h. srÊnttqs
{tr*,fr.".
effi}k
6. MANAGEMENT AND CO.ORDINATION ASPECTS
6. 1. GENERAL PRoJECT COORDINATION
The Web site http://www.project-snowpower.de is maintained by FZK. Also a web page of the Swiss subproject is available at http://www.wsl.ch/stffimanfred.staehli/snowpower/welcome-en.ehtml.
3'd and thus mid-term project meeting was held from March l4th to l8ù at Davos with all partners present and with guests from StatLcaft-Groner and Sintef, both from Norway.
4fr steering committee meeting will be held on September 25ù and 26ft hosted by KTH in Stockholm.
6.2. PERSONNEL ACTIVITIES
Dr. Alex Brandelik is going to retire in September, but will still be available as consultant for the project. Dr. Markus Stacheder will be responsible for the coordination of the project in future.
6.3. CoNTnnnNCE AND MEETING ATTENDANCES
a a a a a a a
Feuchtetag Weimar, Germany, 18.-19 .09.2002
Mountain Hydrology Workshop, Einsiedeln, Switzerland, 0 1.04.2003 Int. Glaciological Society Conference Davos, Svritzerland, 04.-06.2003 Soil Moisture Group Worlshop Karlsruhe, Germany, 03.-04.07.2003 IGARSS conference, Toulouse, France, 21.-25.07 .2003
Eastem Snow Conference, Sherbrooke, Canada, 03. -04.06.2003
6.4. PueLrcA.TroNS (ADVANCED NoTICE) see point 5
Paper IGS
l|| iffiffi,ffif0" b rchshâ k}*nrtrqs
EU-RTD
Proje
SNOWPOWER
uo&\^soh'er W
l."tfr*",
effi#
7. GLOSSARYAAFC: Agriculture and Agri-food Canada C: capacity
FD: Frequency Domain technique, G: conductivity
GeMoisture: evaluation software for measurement data GHz: Gigahertz,
FIYDROTEL, EQeau, CROCUS, COUP, SNOWPACK: different existing hydrological models IA: Impedance analyser, model I1P4I92A
L: inductivity MHz: Megahertz, ns: nanoseconds,
NSERC: Nahral Sciences and Engineering Council of Canada PE: Polyethylene
Permittivity: dielectric constant (e)
RADARSAT-I: Canadian radar satellite launched in 1995 SAR: synthetic aperture radar,
SWE : Snow water equivalent (depth of water that would cover grormd if snow pack was liquid) TEM: Transversal electomagnetic
TDR: Time Domain Reflectometry, model Tektronix 15028 TWh: Tera Watt hour
WFJ: Weissfluhjoch (measurement site at Davos)
F o r s c h u n g s z € n t r u m X a r l s r u h € T ê c h n r ! rn d l l m s l t
EU-RTD
Projecrlp
SNOWPOWER
soM'%r
ffi
ttt
mffi';SrÎi*fd" l. 'eh.'ch. *icntnq*
,.',,"i!r{,feo*
frt*+k
8. ANIYEXES
Table 1: "Manpower and Progress Follow-up Tableo'.
Some work that could not be carried out in WP3 (installation, interaction of cable with snow), is shifted to WP 6 (parftrer 1,2 and 3), so that WP 6 is extended with the dummy cable experiments.
Table 2: "Budget Follow-up Table".
Table 3: Bar Chart planned work versus achieved for l't year
Table 4: Address-list of participants
8.3 Deliverable 10 (Installation report)
T a b l e I : M a n P o w e r a n d P r o g r e s s F o l l o w - u p T a b l e
M a n - M o n t h - T e c h n i c a l P r o o r e s s % T a s k r s u b t a s k (N'r{ilo} P a r t n o l ( N a m o , a b b r s v . ) P l e n n e d e f f o r t s -a l s t e r t o f p e r l o d ( M M } A c l u a l e ffo ri ( M M } F o r s c a s I offo ri ( M M ) D e Y l e . tton (nu) P l . n n e d A s a o s s e d ' ( % ) D e v t a -tlon (%) C o m m e n t s o n m 2 J o i Y s a r I Y . a J 2 Y . a r 3 T o l a l Y o a r I Y o a r 2 Y e a r 3 T o t a l Totata Y e a r 1 Y e a . 2 Y o a r 3 Y o a r I Yêar ( n o w )m odlflc.tlon s of pta n ned efforts. b o b ' l c l d 1 d ' l - d a + D + c t d ^ / P t ; e n s o r d e v e l o p m e n t FZK K T H S L F / W S L H Q I N R S S O M 1 0 ô 1 06 1 0 c 1 1 0 5 1 't00% 1 0 0 % 1 0 0 % 't00% 1 0 0 %1 0 0 % 1 0 0 %1 0 0 % 209r u P 2 - a b o r a t o r y t r i a l s F Z K K T H S L F / W S L H O I N R S s o M ' t 0 6 1 0 6 8 4 1 0 a - 2 1 0 0 % I 0 0 % 1 0 0 % 1 0 0 % 1 0 0 % 1 0 0 % 8 0 % ^ / P c o u l d n o t b e f i n i s h e d i n i m e d u e t o m o r e w o r k t h a n ) l a n n e d a n d d u e t o p e r s o n n e l ) h o r t a g e o f p a r t n e r 2 . t e s t w i l l b e f i n i s h ê d in y e a r 2 r y P 3 : ield tests K T HF Z K S L F / W S L H O I N R S s o M t 0 6 2 2 l 0 3 6 2 2 1 0 1 0 3 3 3 .3 -3 I I 1 0 0 % 1 0 0 % 1 0 0 % 1 0 0 % 1 0 0 % 1 0 0 % 1 0 0 % ' t 0 0 % 't00% '100% 1 0 0 % 't00% ' t 0 0 % 1 0 0 % ' t 0 0 % ' r 0 0 % 1 0 0 % 1 0 0 % 1 0 0 % V P s u c c e s s f u l l y f i n i s h e d : e w work that could not bè ) a r r i e d o u t m o s t l y d u e t o i e â s o n a l r e a s o n s t r a n s f è r e d o f i e l d c a m p a i g n o f W P 6 I o t a l z 3 N P 4 { y d r o l o g i c a l m o d e l l i n g a n d o r e c a s t i n g F Z K K T H S L F / W S L H Q I N R S S O M 2 4 4 I 8 1 3 l 3 2 . 2 5 a 8 4 . 5 8 1 1 1 0 . 7 5 I - 2 . 2 5 1 5 % ' t 5 % 46%46% 't00% 1 0 0 % 1 0 0 % 25% 14% 21% 63% .3 12.t Progress report I
32
Table 3 :
&erview of planned work vs. achieved
, Bar chart 1st and 2nd reportirg period Sept.2001 -Aug.2002
lær
vl onth s€pt Oct N o v O æ J a n Fob M a r Ap. M a v J U æ Jul A u g
[ ^ r ! ô r . b . . l . a
t DBlon md mddliro of the8msor
-ivorlprcla!a 2: Labotrtory trlalt
-5.SknulaabnotCOap6 and hhomoo{su3 3mwpGfil6. mamsnt3
-i Y o r k D a c l . q a t : F l a l d t a r t r
T.Dosisnand buut|mof mæhslcdsilsorsuppons,lNlrumont ælltrcl andd€tâ@llætion
8. Fiold cmoabn, m6ument compgrison with pold smso
-L Oâta ovrlwtlo n. soGo r æcmcy â33Ê3s m6nt end ctkun6rn o f th€ aaæ mtfftlo n cod€ V o r k D a c k a s a , l : H y d r o l o g l c a l m o d a l l l n o r n d t o t a c a l l l n C
o.combrEtbnof qDunddâr æd RADARSATdat| s hptû tote HhldDloglcslmodel
IDwetomsrtof or€dictlonslr$egl€6 forvder6floirlillim lsvds 8nd æmpaÈonxÂh aclualdatl ?. Evalueûion ofth€ æmmlc advanûao€ of imDmv€d pt€dictbn capabllitles
U o r t o r c k r q a 5 i D c v o l o o m a n t t n d b u t t d l n o g f I b a n c h . a c a h I n a t t u m a n l a a n r o r n 9 t r c l h
Im
Table 4:
Addresslist
Participants EU-Proiect'SnowpoweÉ
Name Address Phone Fax e-mail / http:/
Sommer Sommer GmbH & Co KG +43-5523-55989-0 +43-5523-55989-19 [email protected]
SOM StraBenhâuser 27 www.sommer.al
A-6842 Koblach
Austria Martin
Norgren KTH Royal Inst. Of Technology +46-8-790-7410 +46-8-24 54 31 [email protected]
KTH Teknikringen 31 www.alfuenlab.kth.se SE-10044 Stockholm Sweden David Gustafsson SLF SLF FlUelastr. 11 +41-814170-171 +41-814170-110 [email protected] www.slf.ch CH-7260 Davos Dorf SwiEerland
Manfred Sulhli WSL Swiss Federal Res. Inst. +41-1-739-2472 +41-1-739-2488 [email protected]
SLF Ziircherstr. 111 www.wsl.ch
CH-8903 Birmensdorf
SwiEerland Pierre
Ducharme Hydro-Québec
HQ Innovation Technologique ext. 5500
+1-514-289-2211 +1-514-289-5797 [email protected] www. hvd roquebec. com 10e Etage 15 René-Lévesque Ouest Montréal, QC,H2Z1A4 Canada Luc Martell IREQ
HQ 1800 Boul. Lionel-Boulet +1-450-652-8389 +1-450-652-8309 [email protected] www. hvd roq uebec.com Varennes, QC J3X 151 Canada Monique Bemier INRS-ETE
INRS 2800 rue Einstein
+1-418-6il-2585 +1418-654-2600 monique [email protected] www. I nrs-eau. u0 ueoec.ca
c.P.7500
Sainte-Foy, QC, GIV 4C7
Canada
Jean-Pierre
Fortin INRS-ETE +1418-654-2591 +1418-654-2600 [email protected]
INRS 2800 rue Einstein www.inrs-eau.uouebec.ca
c.P. 7s00
Sainte-Foy, QC, GIV 4C7 Canada
Alexander
Brandelik Forschungszentrum Karlsruhe +49-7247-82-3913 +49-7247-824377 [email protected]
FZK IMK_TRO, Geb.435 www.fzk.de
Posttach 3ô40 www.aquametry.de
D-7 6021 Karlsruhe, Germany
Markus
. Stacheder Forschungszentrum Karlsruhe +49-7247-82-2845 +49-7247-824377 [email protected]
FZK IMK-TRO, Geb.435 www.fzk.de
Postfach 3640 www.proiect.snowoower.de
D-76021 Karlsruhe