Do In‡ation-Targeting Central Banks
Implicitly Target the Price Level?
Francisco J. Ruge-Murciay December 2009
Abstract
This paper reports graphical and statistical evidence that the in‡ation targeting regimes in Canada and the UK— but not in Australia, New Zealand, or Sweden— actually resemble price-level targeting. In particular, the price level closely tracks the path implied by the in‡ation target, and the time-series predictions of the “bygones-are-bygones”version of in‡ation targeting are rejected by the data in favor of those implied by price-level targeting. These results indicate heterogeneity in the actual application of in‡ation targeting across countries and, for Canada and the UK, imply that the characterization of in‡ation targeting as a policy where shocks are accommodated is at odds with the data. Moreover, up to extent that their current policies already resemble price-level targeting, the welfare gains of replacing in‡ation with (explicit) price-level targeting are likely to be small.
JEL Classi…cation: E3, E5
Keywords: In‡ation-targeting; price-level targeting; unit-root tests.
This paper was inspired by a comment by Angelo Melino during the Bank of Canada Economic Conference held in Ottawa in November 2009, and it was written while I was visiting the International Department of the Bank of Canada. I thank the International Department for its hospitality and the Social Sciences and Humanities Research
Council for …nancial support. The views expressed here are those of the author and should not be attributed
to neither the Bank of Canada nor to its sta¤. The data used in this analysis are available at my Web page,
www.cireq.umontreal.ca/personnel/ruge.html.
yDépartement de sciences économiques and CIREQ, University of Montréal, C.P. 6128, succursale Centre-ville,
1.
The Debate
A current and important debate in monetary policy concerns the relative advantages of price-level targeting compared with in‡ation targeting. Under in‡ation targeting, the central bank announces a speci…c quantitative target for the in‡ation rate and directs monetary policy towards that goal. The announcement speci…es the measure of in‡ation to be targeted, whether the target is a single value or a range, and the horizon at which the target applies. Among the countries that currently use in‡ation targeting are Australia, Canada, New Zealand, Sweden, and the United Kingdom. Under price-level targeting, the central bank targets the path of a measure of the price level (for example, a price index). The path may involve an upward trend implying a positive, but presumably low, in‡ation rate. A policy similar to price-level targeting was used in Sweden in the 1930s. The debate is of practical importance because some central banks that have successfully targeted the in‡ation rate in recent years are currently studying the possibility of adopting price-level targets instead.1
An obvious di¤erence between in‡ation and price-level targeting is that the former targets the rate of growth of the price level while the latter targets the price level itself. This means that under price-level targeting, an increase in the price level that is larger than allowed by the stated policy has to be o¤set in subsequent periods. In theory, in‡ation targeting imposes no such an obligation on the central bank and hence, temporary shocks that impinge on the price level may be accommodated. Put di¤erently, under in‡ation targeting “bygones are bygones.” A simple characterization of both policies is plotted in Columns 1 and 2 of Figure 1. (Column 3 will be discussed later.) The top panels plot the path of the targeted variable, whether in‡ation or the price level. The lower panels plot the implied paths for the price level (in the case of in‡ation targeting) or the in‡ation rate (in the case of price-level targeting). In this illustration, the in‡ation target is 2 per cent and the price level target involves a growth trend of 2 per cent.
Consider …rst in‡ation targeting in Column 1. Imagine that a temporary shock takes in‡ation from 2 per cent in period 1 to, say, 3 per cent in period 2 (Panel A). Then, in period 3, the central bank steers in‡ation back to the targeted value of 2 per cent and manages to keep it at precisely this value thereafter. This in‡ation-targeting policy would be considered successful in that in‡ation was returned to its target and the (asymptotic) mean of in‡ation is the target value. The path for the price level implied by this policy (Panel B) shows that the price index grows by 3 per cent between periods 1 and 2 and by 2 per cent thereafter. Notice that the temporary shock
1
For example, in the Renewal of the In‡ation-Control Target: Background Information issued in November 2006, the Bank of Canada announces its intention to research the potential costs and bene…ts of replacing the current in‡ation-targeting policy with a price-level targeting regime.
has a permanent e¤ect on the price level: since the central bank accommodates the shock, bygones are bygones indeed.
Consider now the same shock but under a price-level targeting policy. In Column 2 (see Panel C), the price level grows by 3 per cent between periods 1 and 2, and the price index is, therefore, higher than the value targeted for that period. In order to return to the desired path, the central bank must set monetary policy so that the price level grows by only 1 per cent from period 2 to 3, and by 2 per cent thereafter. This price-level targeting policy would be considered successful in that the price index was returned to its targeted path. In this case, the temporary shock does not have a permanent e¤ect on the price level. In Panel D, note that after an in‡ation rate of 3 per cent in period 1, the policy induces an in‡ation rate of only 1 per cent in period 3 and of 2 per cent thereafter.
Finally, let us consider a slightly di¤erent characterization of in‡ation targeting. In Column 3 (see Panel E), following the temporary shock that takes in‡ation to 3 per cent in period 2, the central bank sets monetary policy so that in‡ation is 1 per cent in period 3, and 2 per cent thereafter. This in‡ation targeting policy would be consider successful in that in‡ation was returned to its target and the mean of in‡ation is the target value. In some sense this version of in‡ation targeting may be regarded as more successful than the one in Column 1 because average in‡ation is the target value in the short-run, rather than only asymptotically. Comparing Columns 2 and 3, it is clear that this policy delivers a price-level path that is identical to that obtained under price-level targeting. In particular, temporary shocks have no permanent e¤ect on the price level. Hence, there is an observational equivalence between in‡ation and price-level targeting. In this …gure, the observational equivalence arises from the purposeful policy action of the in‡ation-targeting central bank, which seeks to deliver average in‡ation rates close to the targeted rate in the short-run. In principle, this equivalence may also arise as a result of symmetric shocks that take in‡ation sometimes above, sometimes below, its target.
Earlier literature …nds that optimal monetary policy under commitment involves a stationary price level. This is so in New Keynesian models (see Woodford, 1999, and Clarida, Gali, and Gertler, 1999) and in models with rational inattention (Ball, Mankiw, and Reis, 2005). Since price-level targeting induces stationarity in the price level while in‡ation targeting does not, this is a powerful argument in favor of the former policy. In models where commitment is not possible, price-level targeting has a number of desirable implications which are welfare improving compared with in‡ation targeting. Most of these implications stem from the fact that forward-looking agents incorporate the future price-level path into their current actions. Svensson (1999) shows that price-level targeting reduces the variance of in‡ation and eliminates any average in‡ation bias.
Vestin (2006) …nds that even if social preferences concern in‡ation, welfare is increased by dele-gating monetary policy to a central banker with an explicit price-targeting objective. Eggertsson and Woodford (2003) and Wolman (2005) …nd that price-level targeting is helpful in overcoming distortions in the neighborhood of the zero lower bound on nominal interest rates, and Amano, Ambler, and Ireland (2007) show that the optimal level of wage indexation is lower under price-level targeting and the resulting real wage ‡exibility is welfare improving. On the other hand, in a setup where some of the agents are backward looking, price-level targeting is not optimal and may be dominated by a policy that allows some price-level drift (Steinsson, 2003).
This paper contributes to the literature by looking at the data. Simple plots show that the in‡ation-targeting regimes in Canada and the UK— but in Australia, News Zealand, or Sweden— actually look like price-level targeting in that the price level closely tracks the path implied by the in‡ation target. Thus, while Canada and the UK look like Column 3 in Figure 1, the other countries look like Column 1. The time-series predictions for the price level of the “bygones-are-bygones”interpretation of in‡ation targeting are formalized and statistically tested against those of price-level targeting. For Canada and the UK, but not for the other countries, the data rejects the predictions of in‡ation targeting in favor of those of price-level targeting. These results suggest that there is heterogeneity in the actual application of in‡ation targeting across countries and, in particular, that the regimes in Canada and the UK are not of the form typically modelled in the literature. For these two countries, up to the extent that their central banks pursue policies that already resemble price-level targeting, the welfare gains of replacing in‡ation with (explicit) price-level targeting are likely to be small.
2.
A Look at the Data
2.1 Five In‡ation-Targeting Countries
The empirical analysis is based on price level indices from Australia, Canada, New Zealand, Sweden, and the United Kingdom. In order to motivate the choice of indices and sample periods used in the analysis, I brie‡y review the speci…c institutional arrangements in each country.
In Australia, the Reserve Bank of Australia (RBA) has had an in‡ation target since early 1993.2 Since 1996 the policy has been formalized in a Statement on the Conduct of Monetary Policy jointly issued by the Government and the RBA. The Statement was renewed in July 2003 and September 2006. The target is a range of 2 to 3 per cent on average “over the cycle,” and initially applied
2Bernanke, Laubach, Mishkin and Posen (1999, p. 220) date the beginning of in‡ation targeting in Australia as
September 1994 when Governor Fraser stated that “[an] underlying in‡ation of 2 to 3 per cent is a reasonable goal for monetary policy.” The conclusions reported here are robust to using either date.
to the growth rate of an “underlying” Consumer Price Index (CPI) that excluded volatile items (for example, petrol, vegetables, and fruits), public-sectors goods, and mortgage interests (see Bernanke et al., 1999, p. 225). Starting in September 1998, the Australian Bureau of Statistics removed interest charges from the CPI, and soon after the Federal Treasurer and the RBA agreed that applying the target to the CPI was consistent with the intent of the original Statement (see Reserve Bank Bulletin, October 1998, pp. 1-5). Thus, for Australia, I use the All Groups CPI taken from the Web site of the RBA (www.rba.gov.au) for the period 1993:Q1 to 2009:Q3.
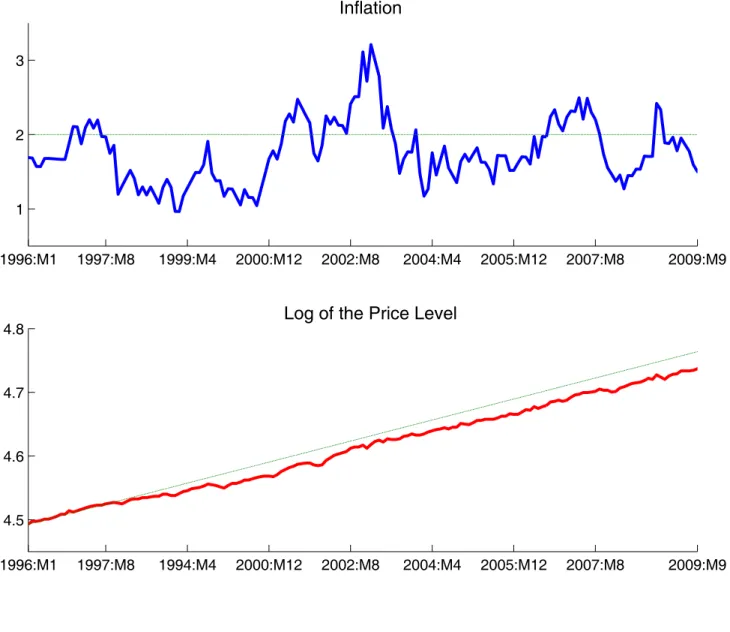
In Canada, the Bank of Canada announced “in‡ation-reduction” targets in February 1991. These targets initially envisaged a reduction in the annual in‡ation rate to 3 per cent by the end of 1992, 2.5 per cent by mid-1994, and 2 per cent by the end of 1995. As in Australia, the in‡ation targeting policy is formalized in a Joint Statement issued by the Government and the central bank. Since January 1996, the in‡ation target is 2 per cent with a tolerance range of plus or minus 1 percentage points. The target is de…ned in terms of the Consumer Price Index but a “core” CPI, which excludes food and energy prices and is adjusted for the e¤ects of indirect tax changes, is used as the operational guide for the policy (see the Joint Statement released in February 1998). More recent Statements issued in May 2001 and November 2006 do not make this distinction between indices, rea¢ rm that the target applies to CPI in‡ation, and, in fact, do not mention the core CPI at all.3 Thus, for Canada, I use the CPI taken from the Web site of Statistics
Canada (www.statcan.gc.ca) for the period 1996:M1 to 2009:M9, but I examine the robustness of the results to using the core CPI (taken from the same source). As in Sweden (see below), the sample excludes the transition period to the new in‡ation targeting policy (in this case, the period of in‡ation-reduction targets between February 1991 and December 1995).
In New Zealand, the …rst Policy Target Agreement (PTA) between the Ministry of Finance and the Reserve Bank of New Zealand (RBNZ) was issued in March 1990 and speci…ed a target range of 0 to 2 per cent for a (new) Consumer Price Index where housing costs were to be measured as imputed rents rather than as actual expenditures. However, a few months later, the PTA of December 1990 re-speci…ed the target in terms of the All Groups CPI. Successive Target Agreements have modi…ed the target range and in‡ation measure. In particular, the PTA of December 1996 increased the width of the range to between 0 and 3 per cent, the PTA of December 1997 speci…ed the target in terms of the All Groups CPI excluding credit services (CPIX), and that of December 1999 in terms of the All Groups CPI, again. Finally, the PTA of September 2002 adjusted the target to between 1 and 3 per cent. Thus, for New Zealand, I use the All Groups CPI taken from
3
On the other hand, the background information on the renewal of the in‡ation targets (see the press releases on 18 May 2001 and 27 November 2006 available at www.bankofcanada.ca/en/press/index.html ) still refers to the core CPI as the operational guide to policy.
the Web site of the Reserve Bank of New Zealand (www.rbnz.govt.nz ) for the period 1991:Q1 to 2009:Q3. The sample excludes the period between 1990:Q2 and 1990:Q4 because I was unable to …nd the price index used to compute the in‡ation measure to be targeted under the PTA of March 1990. Part of the problem is that this index was not among those traditionally produced by Statistics New Zealand and, in fact, the PTA explicitly instructed the RBNZ to produce it. However, since the PTA of December of the same year rede…ned the target in terms of the CPI, which is readily available, and the sample is reduced by only three observations, it seems unlikely that results are a¤ected by the way I have treated the missing observations.
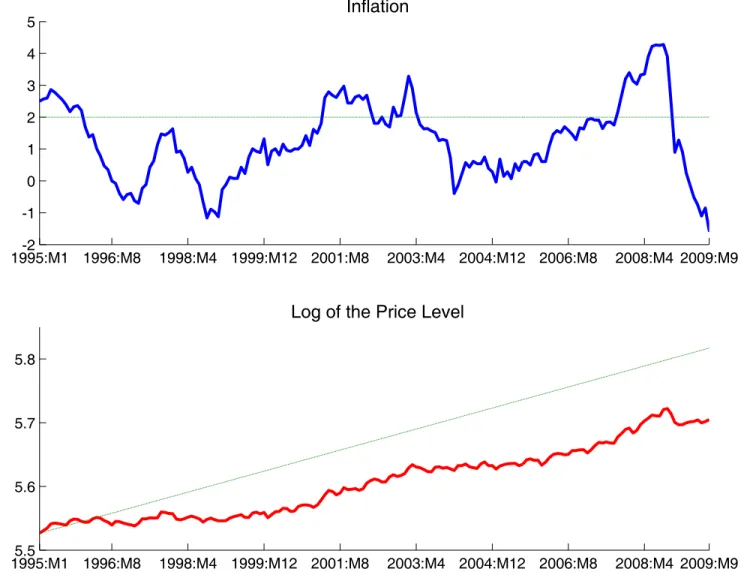
In Sweden, the in‡ation target was announced in January 1993 but the policy was to take e¤ect only from January 1995 onwards. The target is 2 per cent, with a tolerance range of 1 percentage point above and below, and applies to the annual change in the Consumer Price Index with no exclusions. Thus, for Sweden, I use the CPI taken from the Web site of Statistics Sweden (www.scb.se) for the period 1995:M1 to 2009:M9 for Sweden. The sample excludes the transition period to the new in‡ation targeting policy, that is, the period from January 1993 to December 1994 where the (future) targeting policy was known but not yet in e¤ect.
Finally, in the United Kingdom, an in‡ation target range of 1 to 4 per cent was announced by the Chancellor in October 1992 and applied (until 2003) to the Retail Price Index excluding mortgage interest payments (RPIX). Starting in June 1995 the target was interpreted as the mid-point of the above range, with thresholds of plus or minus 1.5 percentage mid-points after May 1997 (see Bernanke et al. 1999, p. 154 and 146, respectively). In December 2003, the target was adjusted to 2 per cent and applied thereafter to the Consumer Price Index. If in‡ation goes below 1 per cent or above 3 per cent, the Governor of the Bank of England must write an open letter to the Chancellor explaining why and proposing corrective policies to take in‡ation back to the target. Thus, for the United Kingdom, I use the RPIX for the period 1992:M10 to 2003:M12 spliced with the appropriately re-scaled CPI for the period 2004:M1 to 2009:M9. As a shorthand, I refer to this index as the RPIX-CPI. These indices were taken from the Web site of the UK National Statistics (www.statistics.gov.uk ). I examine the robustness of the results by using the RPI (taken from the same source), rather than the RPIX, in the …rst part of the sample.
Finally, note that since targets apply to seasonally-unadjusted in‡ation in all countries, the price indices used here are seasonally unadjusted as well.
2.2 Graphical Analysis
Figures 2 through 6 plot the in‡ation rates, price indices, and targets for Australia, Canada, New Zealand the United Kingdom and Sweden, respectively. In each …gure, the upper panel plots the
in‡ation rate and target, and the bottom panel plots the log of the price index used to compute that in‡ation rate and the price-level path implied by the announced in‡ation target. The in‡ation rate is the annual percentage growth in the price index, that is
t= 100(log(Pt) log(Pt 12)); (1)
where tis the in‡ation rate and Ptis the price index. The price-level path implied by the in‡ation
target is
log(Ps+t) = (t=12) log(1 + =100) log(Ps); (2)
where is the in‡ation target and s denotes the period when the in‡ation targeting policy started. In the cases where the data is available at the quarterly frequency (as in Australia and New Zealand) and/or the in‡ation target varies during the sample, de…nitions (1) and (2) are adjusted accordingly. In the case of Australia and New Zealand, where the in‡ation target is a range, I use the mid-point of the range as the empirical counterpart of :
The remarkable observation that follows from Figures 3 and 6 is that the in‡ation-targeting regimes in Canada and the UK look very much like price-level targeting. (To some extent this is also true for Australia in Figure 2, but statistical results reported in Section 2.3 set Australia aside from Canada and the UK.) Under the standard view of how in‡ation targeting works in practice, the central bank accommodates shocks to the price level (bygones are bygones) and, consequently, they have a permanent e¤ect. This implies that the price level should drift away from the path implied by the in‡ation target, as illustrated in Column 1 of Figure 1. Instead what these …gures show is that the price index used to construct the targeted in‡ation rate tracks very closely the path implied by the target, just as one would expect to see in a price-level targeting regime. This is the real-life analog of the observational equivalence between in‡ation and price-level targeting illustrated in Columns 2 and 3 of Figure 1.4 In contrast, the cases of New Zealand (Figure 4)
and Sweden (Figure 5) resemble more the standard view of in‡ation targeting where the price level drifts away from the path implied by the in‡ation target as a result of permanent shocks. This is the real-life analog of the in‡ation targeting policy in Column 1 of Figure 1.
In order to examine the robustness of the results for Canada and the United Kingdom to the price index used, I constructed …gures using the core CPI for Canada (Figure 7) and the RPI for the UK (Figure 8). Figure 7 shows that results for Canada are not robust to using the core CPI,
4
In the case of Canada, plots like Figure 3 (give or take some observations) are also reported by Kamenik, Kiem, Klyuev and Laxton (2008) and Parkin (2009), and discussed by Dodge (2005). Dodge suggests that this observation is due to symmetric shocks and unlikely to persist in the future. Kamenik et al. estimate a reduced-form model by Bayesian methods and conclude that there is a low probability that symmetric shocks account for Figure 3. Parkin carefully examines language used in successive Statements and detects a (perhaps) “unconscious” move to price-level targeting (p. 9). I am indebted to Bob Amano for bringing these references to my attention.
rather than the CPI. This is not surprising because the core CPI excludes items that account for 16 per cent of the CPI and in the presence of trends in relative prices both indexes would have di¤erent trends.5 In any case, even a central bank that explicitly targets the price level would be unable to target two di¤erent price indices with di¤erent trends using only one policy instrument. Figure 8 shows that results for the UK appear robust to using the RPI, rather than the RPIX, in the …rst part of the sample. The mortgage interest payments that are excluded from the RPI have a weight of only 5 per cent and so, compared with the Canadian case, is more likely that both indices share a common trend. However, we will see below that statistical results for the UK are not completely robust to using the RPI.
2.3 Unit-Root Tests
The interpretation of in‡ation targeting as a policy where bygones are bygones generates two speci…c and testable predictions about the price level. First, since shocks have a permanent e¤ect, the price level should have a unit root. Second, since substracting a deterministic trend from a unit root process does not render the resulting series stationary, then it must be the case that the deviation of the price index from the (deterministic) trend implied by the in‡ation target should have a unit root as well. Put di¤erently, this must be so because the permanence of the shocks would make the price index wander arbitrarily away from such a deterministic path. In contrast, price-level targeting generates two alternative predictions for the price level. First, since price level deviations from the targeted path must be o¤set in future periods, the price level should follow a covariance stationary process around a deterministic trend and, second, the deviations should follow a stationary process around a constant (zero).
The natural way to empirically evaluate these implications is by means of unit root tests. Table 1 report results of Augmented Dickey-Fuller (ADF) unit root tests for the log of the price level and for the deviation of the price level from the path implied by the in‡ation target. In the former case, the hypothesis is that the price level follows a unit root process with drift, and the (estimated) alternative is a covariance-stationary autoregression with a deterministic trend and a constant term. For the latter case, the hypothesis is that the price level deviation from the path implied by the target follows a unit root process, and the (estimated) alternative is a covariance-stationary autoregression with a constant term (but not trend). Just to emphasize, the two hypotheses are what in‡ation targeting predicts about the price level and the alternatives are what price-level
5
The core CPI excludes eight components from the CPI. These components are fruits, vegetables, gasoline, fuel
oil, natural gas, mortgage interest, inter-city transportation and tobacco products. The weights of these
compo-nents in the 2005 basket are 1.25 (fruit, fruit preparations and nuts), 1.11 (vegetables and vegetable preparations), 4.49 (gasoline), 0.41 (fuel oil and other fuels), 1.35 (natural gas), 5.16 (mortgage interest costs), 1.09 (inter-city transportation) and 1.33 (tobacco products and smokers’supplies).
targeting predicts. The level of augmentation of the ADF test (that is, the number of lagged …rst di¤erences in the OLS regression) was selected using recursive t -tests, but using the Modi…ed Information Criterion (MIC) proposed by Ng and Perron (2001) delivers basically the same results and supports the same conclusions. Finally, in order to assess the robustness of the results to the test procedure, I also report results using the Phillips-Perron (PP) unit-root test.
For Canada and the United Kingdom, both null hypotheses are rejected in favor of the alter-natives when the price level is measured using the price indices used to construct the targeted in‡ation rate, namely the CPI and the RPIX-CPI. Notice, however, that in the case of the UK results are not always robust to the test procedure used. In particular, the hypotheses are always rejected by the PP, but not by the ADF, tests. One possible reason for this is that the change in the in‡ation target in the UK from 2.5 to 2 per cent in December 2003 induces a break in the deterministic trend, which, as it is well-known, biases the ADF test in favor of the null hypothesis (see Perron, 1989). In order to inspect this possibility, I ran all tests on the RPIX for the restricted sample from 1992:M10 to 2003:M12 where target was 2.5 per cent throughout. Notice that for this subsample, the hypotheses are rejected in all cases. Finally, notice that results are not robust to using other price indices (the core CPI for Canada and the RPI for the UK) whose in‡ation rates are not targeted by the central banks. However, as was noted above, price-level targeting only generates predictions concerning the index that is implicitly or explicitly targeted and is silent about indices that have di¤erent trends as a result of persistent movements in relative prices.
In summary, these statistical results support two conclusions regarding the in‡ation-targeting regimes in Canada and the United Kingdom. First, their policies do not appear to be of the bygones are bygones variety usually modeled in the literature. Instead, second, the actual application of in‡ation targeting in these two countries induces statistical properties in the price level that are essentially those implied by a price-level targeting regime.
In principle, it is possible that the observational equivalence between in‡ation and price-level targeting is the result of symmetric shocks. That is, that the central bank follows a bygones-are-bygones in‡ation targeting policy but symmetric shocks take in‡ation sometimes above, sometimes below, the target and deliver something like of Figures 3 and 6. However, I now argue that the statistical results reported in Table 1 do not support this interpretation. The reason is simply that in this scenario the price level and its deviation from the implied path would still have a unit root. Hence, the rejections reported in Table 1 cast doubt on the view that the observed paths of the price levels in Canada and the UK are solely the result of “luck.” Instead, a most likely explanation is that the actual application of the in‡ation targeting policy itself accounts for the empirical observations reported here.
Finally, in the cases of Australia, New Zealand and Sweden, one cannot reject the null hypothe-ses. Thus, in these countries, the price level and its deviation from the implied path appear to be well described by a unit root process.6 Except for Australia, these results were already anticipated by the Figures reported in Section 2.2. Hence, the statistical properties of the price levels in these countries are consistent with the view that in‡ation target allows shocks to have permanent e¤ects on the price level.
3.
Conclusions
This paper contributes to the ongoing debate about in‡ation versus price-level targeting by looking at the data. Simple graphs show that the in‡ation-targeting regimes in Canada and the UK (but not for Australia, New Zealand, or Sweden) look very much like price-level targeting. The analysis is pursued further statistically by characterizing the time-series predictions of the standard view of in‡ation targeting as a policy where shocks are accommodated and have, therefore, a permanent e¤ect on the price level. Unit-root tests show that for Canada and the UK (but not in Australia, New Zealand, and Sweden) those predictions are rejected in favor of alternatives consistent with price-level targeting. A possible explanation for these results is the manner in which the policy is actually carried out in these countries. Thus, the view incorporated in theoretical models that in‡ation targeting central banks systematically accommodate shocks to the price level is at odds with the data from Canada and the UK, though it may be good representation for other countries. In case of these two countries, up to the extent that their central banks pursue policies that closely resemble price-level targeting, the welfare gains of replacing the current in‡ation-targeting regimes with price-level targeting with the same drift are likely to be small.
It is not completely obvious what accounts for the strikingly di¤erent results for Canada and the UK on one hand, and Australia, New Zealand and Sweden on the other. As argued above, the nature of the shocks received by these countries is unlikely to account for these results. A more plausible explanation are di¤erences in the manner in which the in‡ation-targeting policy itself is applied in these countries. A suggestive observation, Sweden notwithstanding, is that Canada and the UK de…ne their in‡ation targets as a numerical value (with upper and lower bounds), while Australia and New Zealand de…ne their targets as a range only. However, additional research is required to examine this explanation more rigorously.
6
It may be argued that results for Australia and New Zealand re‡ect low test power because their data is only available at the quarterly frequency and, hence, the number of observations is smaller than that of the other countries. However, Shiller and Perron (1985) show that the power of unit root tests depends on the span of the data and not
on the frequency at which the data is sampled. The span for all …ve countries in the sample is approximately the
Table 1. Unit Root Tests
Variable
Deviation from Implied Path Log of the Price Level With Intercept No Intercept
Price Index ADF PP ADF PP ADF PP
Australia CPI 1:956 1:970 1:214 1:208 1:158 1:161 Canada CPI 3:531 3:175y 2:984 2:714y 2:991 2:719 Core CPI 2:921 2:944 1:945 1:718 0:103 0:153 New Zealand CPI 1:109 1:091 0:198 0:006 Sweden CPI 1:841 2:173 2:006 1:386 UK RPIX-CPI 3:479 3:718 2:353 2:940 1:472 2:513 RPI-CPI 2:734 3:021 2:108 2:619y 2:260 2:145 RPIX 3:268y 3:752 3:281 3:781 1:867y 2:545 RPI 2:086 2:887 2:280 2:747y 2:298 2:592
Notes: ADF and PP stand for Augmented Dickey-Fuller and Phillips-Perron, respectively. The level of augmentation of the ADF test was selected using the recursive application of t -tests. The truncation lag of the PP test is three in all cases. For the log of the price index, the alternative is a covariance-stationary autoregression with a constant term and a deterministic trend. For the deviation of the implied path, the alternative is a covariance-stationary autoregression with a constant term. The superscripts and y denote the rejection of the null hypothesis of a unit root at the …ve and ten per cent levels, respectively.
References
[1] Amano, R., Ambler, S., Ireland, P., 2007. Price-Level Targeting, Wage Indexation and Welfare. Bank of Canada, Manuscript.
[2] Ball, L., Mankiw, N. G., Reis, R., 2005. Monetary Policy for Inattentive Economies. Journal of Monetary Economics 52, 703-725
[3] Bernanke, B., Laubach, T., Kishkin, F., Posen, A., 1999. In‡ation Targeting. Princeton Uni-versity Press, Princeton.
[4] Clarida, R., Gali, J., Gertler, M., 1999. The Science of Monetary Policy: A New Keynesian Perspective. Journal of Economic Literature 37, 1661-1707.
[5] Dodge, D., 2005. Our Approach to Monetary Policy: In‡ation Targeting. Remarks to the Regina Chamber of Commerce. Available at www.bankofcanada.ca/en/speeches/spgen05.html
[6] Eggertsson, G., Woodford, M., 2003. The Zero Bound on Interest Rates and Optimal Monetary Policy. Brookings Papers on Economic Activity, 139-211
[7] Kamenik, O., Kiem, H., Klyuev, V., Laxton, D., 2008. Why is Canada’s Price Level So Pre-dictable? IMF Working Paper WP/08/25.
[8] Ng, S., Perron, P., 2001. Lag Length Selection and the Construction of Unit Root Tests with Good Size and Power. Econometrica 69, 1519-1554.
[9] Parkin, M., 2009. What is the Ideal Monetary Policy Regime. C.D. Howe Institute Commentary No. 279.
[10] Perron, P., 1989. The Great Crash, the Oil Price Shock and the Unit Root Hypothesis. Econo-metrica 57, 1361-1401.
[11] Shiller, R. J., Perron, P., 1985. Testing the Random Walk Hypothesis: Power versus Frequency of Observation. Economics Letters 18, 381-386.
[12] Steinsson, J., 2003. Optimal Monetary Policy in an Economy with In‡ation Persistence. Jour-nal of Monetary Economics 50, 1425-1456.
[13] Svensson, L. E. O., 1999. Price-Level Targeting versus In‡ation Targeting: A Free Lunch? Journal of Money, Credit and Banking 31, 277-295.
[14] Vestin, D., 2006. Price-Level versus In‡ation Targeting. Journal of Monetary Economics 53, 1361-1376.
[15] Woodford, M., 1999. Optimal Monetary Policy Inertia. NBER Working Paper No. 7161.
[16] Wolman, A. L., 2005. Real Implications of the Zero Bound on Nominal Interest Rates. Journal of Money, Credit and Banking 37, 273-296.
1 2 3 4 5 6 1 1.5 2 2.5 3 Targeted Variable INFLATION TARGETING A. Inflation 1 2 3 4 5 6 1 1.02 1.04 1.06 1.08 1.1 PRICE-LEVEL TARGETING C. Price Level Targeted Variable 1 2 3 4 5 6 1 1.5 2 2.5 3 Tageted Variable INFLATION TARGETING E. Inflation 1 2 3 4 5 6 1 1.02 1.04 1.06 1.08 1.1 Implied Path B. Price Level 1 2 3 4 5 6 1 1.5 2 2.5 3 Implied Path D. Inflation 1 2 3 4 5 6 1 1.02 1.04 1.06 1.08 1.1 F. Price Level Implied Path
1993:Q1-1 1995:Q2 1997:Q4 2000:Q2 2002:Q4 2005:Q2 2007:Q4 2009:Q3 0 1 2 3 4 5 6 Inflation 1993:Q14.6 1995:Q2 1997:Q4 2000:Q2 2002:Q4 2005:Q2 2007:Q4 2009:Q3 4.8 5 5.2
Log of the Price Level
1996:M1-1 1997:M8 1999:M4 2000:M12 2002:M8 2004:M4 2005:M12 2007:M8 2009:M9 0 1 2 3 4 5 Inflation 1996:M1 1997:M8 1999:M4 2000:M12 2002:M8 2004:M4 2005:M12 2007:M8 2009:M9 4.5 4.6 4.7
4.8 Log of the Price Level
1991:Q1-1 1993:Q2 1995:Q4 1998:Q2 2000:Q4 2003:Q2 2005:Q4 2008:Q22009:Q3 0 1 2 3 4 5 Inflation 1991:Q16.6 1993:Q2 1995:Q4 1998:Q2 2000:Q4 2003:Q2 2005:Q4 2008:Q22009:Q3 6.7 6.8 6.9 7
7.1 Log of the Price Level
1995:M1 1996:M8-2 1998:M4 1999:M12 2001:M8 2003:M4 2004:M12 2006:M8 2008:M4 2009:M9 -1 0 1 2 3 4 5 Inflation 1995:M1 1996:M85.5 1998:M4 1999:M12 2001:M8 2003:M4 2004:M12 2006:M8 2008:M4 2009:M9 5.6 5.7 5.8
Log of the Price Level
1992:M101994:M5 1996:M1 1997:M9 1999:M5 2001:M1 2002:M9 2004:M5 2006:M1 2007:M90 2009:M9 1 2 3 4 5 6 Inflation 1992:M101994:M5 1996:M1 1997:M9 1999:M5 2001:M1 2002:M9 2004:M5 2006:M1 2007:M94.9 2009:M9 5 5.1 5.2 5.3
5.4 Log of the Price Level
1996:M1 1997:M8 1999:M4 2000:M12 2002:M8 2004:M4 2005:M12 2007:M8 2009:M9 1 2 3 Inflation 1996:M1 1997:M8 1994:M4 2000:M12 2002:M8 2004:M4 2005:M12 2007:M8 2009:M9 4.5 4.6 4.7
4.8 Log of the Price Level
1992:M101994:M5 1996:M1 1997:M9 1999:M5 2001:M1 2002:M9 2004:M5 2006:M1 2007:M90 2009:M9 1 2 3 4 5 6 Inflation 1992:M101994:M5 1996:M1 1997:M9 1999:M5 2001:M1 2002:M9 2004:M5 2006:M1 2007:M94.9 2009:M9 5 5.1 5.2 5.3
5.4 Log of the Price Level