HAL Id: hal-02176058
https://hal.archives-ouvertes.fr/hal-02176058
Submitted on 7 Dec 2019
HAL is a multi-disciplinary open access archive for the deposit and dissemination of sci-entific research documents, whether they are pub-lished or not. The documents may come from teaching and research institutions in France or abroad, or from public or private research centers.
L’archive ouverte pluridisciplinaire HAL, est destinée au dépôt et à la diffusion de documents scientifiques de niveau recherche, publiés ou non, émanant des établissements d’enseignement et de recherche français ou étrangers, des laboratoires publics ou privés.
Effects of catchment area and nutrient deposition regime
on phytoplankton functionality in alpine lakes
Coralie Jacquemin, Céline Bertrand, Evelyne Franquet, Stéphane Mounier,
Benjamin Misson, Benjamin Oursel, Laurent Cavalli
To cite this version:
Coralie Jacquemin, Céline Bertrand, Evelyne Franquet, Stéphane Mounier, Benjamin Misson, et al.. Effects of catchment area and nutrient deposition regime on phytoplankton function-ality in alpine lakes. Science of the Total Environment, Elsevier, 2019, 674, pp.114-127. �10.1016/j.scitotenv.2019.04.117�. �hal-02176058�
Effects of catchment area and nutrient deposition regime on phytoplankton functionality in alpine lakes
Coralie Jacquemin1 Céline Bertrand2 Evelyne Franquet1 Stéphane Mounier3
Benjamin Misson4 Benjamin Oursel1 Laurent Cavalli1
1 IMBE - Institut méditerranéen de biodiversité et d'écologie marine et continentale 2 CRIHAM - Centre de Recherche Interdisciplinaires en Histoire, Histoire de l'Art et Musicologie
3 MIO - Institut méditerranéen d'océanologie
4 LMGE - Laboratoire Microorganismes : Génome et Environnement - Clermont Auvergne
Abstract
High mountain lakes are a network of sentinels, sensitive to any events occurring within their waterbodies, their surrounding catchment and their airshed. In this paper, we investigate how catchments impact the taxonomic and functional composition of phytoplankton communities in high mountain lakes, and how this impact varies according to the atmospheric nutrient deposition regime. For two years, we sampled the post snow-melt and the late summer phytoplankton, with a set of biotic and abiotic parameters, in six French alpine lakes with differing catchments (size and vegetation cover) and contrasting nitrogen (N) and phosphorus (P) deposition regimes. Whatever the nutrient deposition regime, we found that the lakes with the smallest rocky catchments showed the lowest functional richness of phytoplankton communities. The lakes with larger vegetated catchments were characterized by the coexistence of phytoplankton taxa with more diverse strategies in the acquisition and utilization of nutrient resources. The nutrient deposition regime appeared to interact with catchment characteristics in determining which functional groups ultimately developed in lakes. Photoautotroph taxa dominated the phytoplankton assemblages under high NP deposition regime while mixotroph taxa were even more favored in lakes with large vegetated catchments under low NP deposition regime. Phytoplankton functional changes were likely
related to the leaching of terrestrial organic matter from catchments evidenced by analyses of carbon (δ13C) and nitrogen (δ15N) stable isotope ratios in seston and zooplankton. Plankton
δ15N values indicated greater water–soil interaction in lakes with larger vegetated catchments,
while δ13C values indicated the effective mineralization of the organic matter in lakes. There
is even more reason to consider the role played by catchments when seeking to determine the vulnerability of high altitude lakes to future changes, as catchments’ own properties will vary under changes related to climate and airborne contaminants.
Keywords
1. Introduction
High altitude lakes are a network of sentinels, sensitive to any events occurring within their waterbodies, their surrounding catchment and their airshed (Adrian et al., 2009; Williamson et al., 2009). Elevation prevents high mountain lakes from being exposed to strong human pressure but increases their exposure to global anthropogenic changes. Over most parts of Europe, 21st century climate change could considerably depend on elevation, with warming amplified at high elevations as a result of decreasing snow-albedo feedback (Kotlarski et al., 2012). Airborne contaminants emitted by human activities, such as nutrients, metals and persistent organic pollutants, have been found to be transported over long distances, intercepted by mountain ranges and finally drained to remote lakes (Battarbee et al., 2009).
Predicting ecological trajectories under future changes is a key challenge for both scientists and conservation managers. Blenckner (2005) has introduced the concept of environmental filters, according to which each lake should be characterized by a set of “Landscape filters” (e.g. geographic position; catchment characteristics; morphometry) and “Internal lake filters” (e.g. biotic and abiotic interaction) whose interplay determines the quality and the strength of the climatic signal reaching the lake. If predictions are to be refined, it is vital to better understand how characteristics of lakes influence biological functioning of lakes and mediate their response to environmental changes.
Phytoplankton is a key biological compartment in lakes, which sustains biogeochemical cycles and fuels the trophic webs. Catchments of lakes determine both the quality and quantity of nutrients lakes receive, as catchments can be a source of terrestrial
elements and can partially retain and transform the elements deposited from the atmosphere. A large stable carbon pool in catchments usually increases the nitrogen (N) retention capacity (Burns, 2004; Curtis et al., 2011; Kopacek et al., 2005) but decreases the phosphorus (P) retention capacity due to the increased leaching of terrestrial organic matter (Kopacek et al., 2011). Phytoplankton composition was shown to vary with catchment characteristics over large geographical scale in the Alps (Tolotti et al., 2006; Tolotti et al., 2003). In these studies, the vegetation cover interacted with N-atmospheric deposition and lake morphology (depth) in regulating the nutrient conditions and the taxonomic composition of phytoplankton in lakes. However, the precise influence of catchments are far to be well understood in these poorly allochtonous systems above the tree line (Rose et al., 2015). Furthermore, during the last century, emissions of N and P related to human activity and/or to climate change greatly altered the modalities of nutrient limitation in lakes. Stronger N deposition rates led to a switch from N- to P-limitation of phytoplankton growth, an increase in phytoplankton biomass, and a shift in phytoplankton composition toward more mesotrophic species in most remote lakes of the northern hemisphere (Bergstrom & Jansson, 2006; Elser et al., 2009; Wolfe et al., 2003). Stronger P deposition rates coupled with warming was shown to affect the trophic relationship between bacterioplankton and phytoplankton, the number of trophic links toward higher trophic levels, and thus the transfer of matter and energy through the plankton food web (Camarero & Catalan, 2012; González-Olalla et al., 2018). As catchment properties will continue to vary under global anthropogenic changes, it would be valuable to better understand the underlying processes of catchment influence that drive phytoplankton composition under different contexts of nutrient deposition regime.
Under climate change, phytoplankton composition should be more predictable in terms of functional composition than taxonomic composition (Litchman et al., 2012). Ability to grow, perennation mechanisms, and capacity to sustain biomass loss processes all depend
on species-specific functional traits under selection of environmental filters and species interactions (McGill et al., 2006; Violle et al., 2007). Phytoplankton deploy diverse strategies to gather and to exploit nutrient resources, involving trade-offs in morphological (e.g. size, surface-to-volume ratios, flagella) and physiological traits (e.g. specific growth rate, half-saturation constant, mixotrophy) (Litchman & Klausmeier, 2008; Naselli-Flores & Barone, 2011; Reynolds, 1988). Functional classifications address the high diversity of potential traits by grouping species according to the traits that best determine ecological performance (Salmaso et al., 2015). The phytosociological work by Reynolds set a milestone in the application of functional approaches to phytoplankton. His functional groups (FG) define species assembly with similar morphological and physiological traits, characterized by robust ecological affinities (Reynolds et al., 2002). Kruk et al. (2011) developed a morphology-based functional classification (MBFC) whose effectiveness in capturing phytoplankton ecology is increasingly recognized (Kruk & Segura, 2012). More recently, Mitra et al. (2016) proposed an interesting revision of the functional classification of aquatic protists that acknowledges the importance of mixotrophy. The study of phytoplankton functionality provides valuable insights into the mechanisms driving the structuring of phytoplankton communities in lakes. Multiple functional classifications can be used in a complementary approach, to explore how environmental conditions, including nutrient conditions, influence phytoplankton communities in lakes.
In this study, we investigate how catchments impact the taxonomic and functional composition of phytoplankton communities in high mountain lakes, and how this impact varies according to the nutrient deposition regime. For two years, we sampled the post snow-melt and the late summer phytoplankton with a set of biotic and abiotic parameters, in six French alpine lakes with differing catchments (size and vegetation cover) and contrasting N
nutrient supply in lakes, our main hypothesis was that a larger catchment area would lead to a shift in phytoplankton functional groups, with best competitors at a lower nutrient level in lakes with small rocky catchments replaced by best competitors at a higher nutrient level in lakes with large vegetated catchments. The objective was to compare such changes under both nutrient deposition regime contexts, and to investigate the environmental parameters related to these changes. Ultimately, our study provides input for the analysis of phytoplankton ecology in high mountain lakes, shedding light on how catchment area may be a factor in their vulnerability to global changes.
2. Material and methods
2.1. Study area, sampling, and data collection
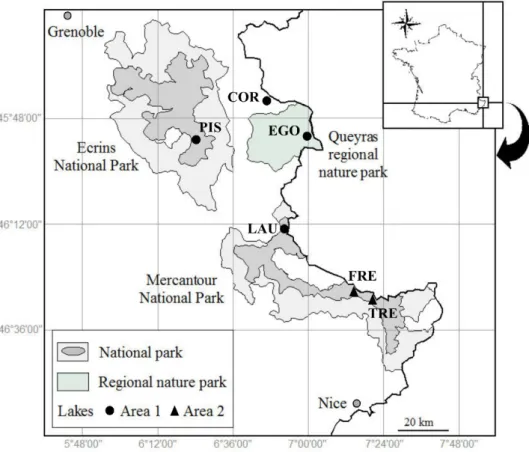
The French Alps contains a wide range of glacially-formed waterbodies, with almost 130 lakes as defined by Rivier (1996) in the protected areas of Ecrins national park, Queyras regional nature park and Mercantour national park, above the tree-line (1800 m < altitude < 2800 m). From the North-West to the South-East, the six French alpine lakes studied were lake Pisses (PIS) in the Champsaur valley, lake Cordes (COR) in the Fonts de Cervières valley, lake Egorgéou (EGO) in the Queyras valley, lake Lauzanier (LAU) in the Ubaye valley, and lakes Fremamorte (FRE) and Trécolpas (TRE), both in the Vésubie valley (Fig.
1).
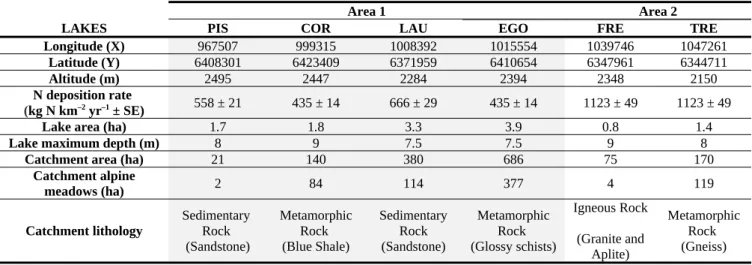
The characteristics of these lakes are summarized in Table 1, divided geographically into two areas with contrasting nutrient deposition regimes. Indeed, according to the data from the European Monitoring and Evaluation Programme (EMEP) (Fagerli et al., 2015), the
more northerly lakes PIS, COR, LAU and EGO were exposed to a lower average nitrogen deposition rate (Area 1: 435 ± 14 to 666 ± 29 kg N km–2 yr–1) than the more southerly lakes
FRE and TRE (Area 2: 1123 ± 40 kg N km–2 yr–1) over the period 2000-2013. Furthermore,
lakes FRE and TRE are on the trajectory of enriched P-dust emitted from the Sahara Desert and the semi-arid Sahelian region, conveyed at altitudes of between 1500 and 4000 m above sea level (Moulin & Chiapello, 2004).
Within each area, the lakes mainly differ in terms of catchment area, which varies from small rocky watersheds (21 ha in area 1 and 75 ha in area 2) to large watersheds with more developed soils and meadows (686 ha in area 1 and 170 ha in area 2). Soil cover is proportional to catchment area, and pasture practices are proportional to the soil cover. The dominant lithology of the catchments differs according to valley: Sandstone, Shale, Schist, Granite and Gneiss. In other respects, the lakes were chosen for the similarity of their environmental and morphological characteristics. All six lakes are situated at intermediary elevations ranging from 2150 to 2500 m and are ice-covered from November to June. The lakes are all small, with depth comprised between 7 and 9 m and lake area between 0.8 and 4 ha, and host fish populations.
The lakes were sampled twice over the ice-free periods in 2015 and 2016, after the snowmelt (early summer = late June or early July) and at the end of the growing season (late summer = September). The phytoplankton was sampled concurrently with a set of biotic and abiotic parameters to investigate the relationship among catchments, lakes properties and phytoplankton composition (physicochemical parameters, chl a, nutrients, and zooplankton analyses). Two supplementary parameters were monitored for one year to further characterize the lakes functioning (C and N isotopic analyses and heterotrophic prokaryotic plankton analyses).
The samplings were made at the deepest point in the lakes. The depth of the aphotic layer was estimated using a Secchi disk. Profiles of pH, temperature, dissolved oxygen (O2),
turbidity, conductivity and chl a were performed using an Exo2 multiparameter probe (YSI, United States). Phytoplankton and other water samples were collected using a horizontal sampler (Niskin Bottle) at 1 m above the bottom. Zooplankton samples were collected using a plankton net of 50 µm mesh towed vertically from bottom to surface. All the samples were processed in triplicate and were filtered, fixed, and stored in appropriate containers in the field, depending on the analyses to be performed in the laboratory.
2.2. Phytoplankton analyses
Samples of phytoplankton were fixed in alkaline lugol solution (0.5 %) and stored in 250 mL HDPE bottles at + 4 °C. Phytoplankton was counted according to the Utermöhl (1958) method at 40-fold magnification under an inverted microscope (Olympus IX 70) (Lund, 1981). Phytoplankton abundances were calculated in algae units (unicell, colony or filament) per unit of volume (L).
Phytoplankton taxa were identified at 100-fold magnification using appropriate taxonomic guides. They were classified in four ways: into taxonomic groups (TAX) based on their main phylogenetic affiliations, into protist functional groups (PFG) based on their eco-physiology, i.e. photoautotrophs lacking phagotrophic capacity (PA) and constitutive mixotrophs (CM) (Mitra et al., 2016), into morphology-based functional groups (MBFG) based on their morphological traits (Kruk et al., 2010), and into functional groups (FG) based on their morphological, physiological, and ecological features (Padisak et al., 2009; Reynolds et al., 2002). Where there was uncertainty concerning the assignment of FG groups (some diatoms), we labeled the taxa as “unclassified” in the FG classification (UN group).
Two α-diversity indices were used to characterize the functional structure of phytoplankton assemblages. For TAX, MBFG, and FG classifications, the richness index (S) measured the number of groups identified, and the Pielou (1974) index (J’) measured how evenly algae units were distributed among the groups.
2.3. Biotic and abiotic parameters
2.3.1. Physicochemical parameters
Average physical and chemical properties of the water at 1 m above the lakes bottom were extracted from the multiparameter profiles. Water temperature data were retrieved from data loggers (HOBO, United States) already positioned at 1 m above the bottom in lakes, measuring temperature hourly. Two metrics were calculated from these data: the temperature averaged over a period of one week before the date of sampling (T) and the temperature averaged over the summer (Ts, from June to September).
2.3.2. Chlorophyll a
Water samples for chl a analyses were filtered (1 L) through glass filters (Whatman GF/C, 47 mm, 1.2 µm). The filters were placed in glass tubes filled with 10 mL of acetone solution (90 %) for 24 h at + 4 °C, for Chla extraction. Chla concentration was measured spectrophotometrically (Jasco, V-630) by the Lorenzen (1967) method, with correction for pheophytin interference by acidification.
2.3.3. Nutrients (C, N, P, and Si)
Water samples for nutrient analyses were filtered (1 L) through precombusted (+ 450 °C, 4 h) glass filters (Whatman GF/F, 25 mm, 0.7 μm). The first filtered fraction was stored inm). The first filtered fraction was stored in 125 mL HDPE bottles and frozen (- 18 °C) for later analysis of dissolved inorganic nitrogen (DIN = NH4+ + NO2- + NO3-), soluble reactive phosphorus (SRP = PO43-) and silica (SiO2)
concentrations by ionic chromatography (Metrohm, 930 Compact IC Flex). The second filtered fraction was stored in 24 mL precombusted (+ 450 °C, 4h) glass tubes (Wheaton equipped with Teflon/silicone septa) and preserved with 25 µL of Sodium Azide solution (1 M NaN3) at + 4 °C for later analysis of dissolved inorganic carbon (DIC) and dissolved
organic carbon (DOC) concentrations using a TOC-VCSH analyzer (Shimadzu, TOC-V) (Louis et al., 2009). The GF/F filters were dried to constant weight at + 60 °C and exposed to HCl fumes for 4 h to remove the inorganic carbon (Lorrain et al., 2003). The organic carbon and total nitrogen contents were quantified by high temperature catalytic oxidation with an Elemental Analyzer (EA) (ThermoScientific, Flash EA 1112). The C and N values obtained were used to calculate the C/N ratio of the suspended particulate organic matter (POM) in the water sampled.
2.3.4. Zooplankton
Samples of zooplankton were fixed in a formaldehyde solution (4 %) and stored in 250 mL HDPE bottles. Zooplankton taxa were counted in a closed counting chamber under a binocular microscope at 40-fold magnification. Zooplankton abundances were expressed in individuals per unit of volume (m3) and organized into major groups (rotifers, cladocerans,
calanids and cyclopids).
2.3.5. C and N isotopic analyses
In 2015, the natural abundances of carbon and nitrogen stable isotopes (δ13C and δ15N)
contained in the plankton were analyzed in the studied lakes at all sampling campaigns. The isotopic signature of soils in catchments was also determined for comparison with the plankton values, by sampling the soil at three different sites randomly selected in catchments.
Subsamples of water were first filtered (0.7 - 20 µm filters) to obtain the finest fraction of the seston, most likely to concentrate the phytoplankton fraction. Subsamples of zooplankton were first maintained alive for 24 h in sampled water, to allow for gut evacuation. Then, filters, zooplankton, and soils samples were dried at + 60 °C. Half of the samples were used for δ15N analyses, while the other half were decarbonated by acid-fuming (HCl 37 %) for δ13C
analyses. Homogeneous samples were weighed into tin capsules and analyzed using an Elemental Analyzer (EA) coupled to an IRMS Delta Plus – Conflo II at the Stable Isotopes in Nature Laboratory (Canada).
2.3.6. Heterotrophic prokaryotic plankton (HP)
In 2016, water subsamples were used to assess the abundance of free-living heterotrophic prokaryotic (HP) plankton in the studied lakes. The subsamples were filtered through sterile 40 µm filters, fixed with glutaraldehyde (0.25 %, final concentration), and frozen (- 80 °C) for later analysis. Heterotrophic prokaryotes were enumerated with an Accuri C6 flow cytometer (BD) after SYBR- green staining (0.5X final concentration) according to previous work (Grégori et al., 2001). Briefly, after exclusion of doublets and red-fluorescent particles, SYBR-green-stained particles of small size and low complexity were considered as heterotrophic prokaryotes and expressed as cells per unit of volume (cell mL-1).
2.4. Statistical analyses
We performed direct gradient analyses, also known as constrained ordination, to test for significant effect of catchment area on phytoplankton composition in each geographic area. The dataset was divided between area 1 lakes (PIS, COR, LAU and EGO) and area 2 lakes (FRE and TRE). We selected linear response models, i.e. redundancy analyses (RDAs),
to fit the data because preliminary detrended correspondence analyses (DCA, detrending by segment) showed relatively low turnover in phytoplankton datasets (gradient lengths < 3 on the first axis). Phytoplankton abundances were log-transformed (y'= log [y + 1]), and the RDAs were centered by species.
We used three explanatory variables in the RDAs. The catchment-to-lake ratio (CAT = Catchment area (ha) / Lake area (ha)) was used to test for catchment influence on phytoplankton composition (Hu et al., 2014). In addition, two variables were used to assess temporal variability in phytoplankton composition related to sampling design: between the two years of sampling (YEAR), and during the ice-free season (SUMMER). For the latter, we calculated the number of days between the date of sampling and the thawing phase in early summer, roughly estimated as the date when the temperature at 1 m below the lake surface lastingly exceeded + 4°C.
RDAs were run separately for each of the three explanatory variables to compare their marginal effects in lakes. Each ordination was run six times, since the lakes were located within two geographic areas and the phytoplankton taxa were classified under three classifications with more than two groups: TAX, FG, and MBFG classifications. The significance of the variance in phytoplankton composition explained by CAT, YEAR and SUMMER was tested by Monte Carlo permutation tests (999 unrestricted permutations). The Van Dobben circle technique was used to determine which phytoplankton groups were significantly correlated to CAT (t-value of regression coefficient greater than 2.0). The phytoplankton-environment relationship was investigated by passively projecting the biotic and abiotic parameters measured in lakes as supplementary variables in ordination spaces. The remaining phytoplankton variability was calculated by running a partial unconstrained ordination with CAT, YEAR and SUMMER as covariables.
Finally, Spearman's rank correlation tests and tests of Mann and Whitney were performed to test for significant changes in PFGs relative abundances, and community structure (α-diversity indices) with CAT, in area 1 and 2 respectively. These tests were performed on the summer phytoplankton assemblages, and per summer sampling time (early summer = late June and early July, and late summer = September). All multivariate analyses were run using CANOCO 5.1 (Šmilauer & Lepš, 2014). Other statistical analyses were performed on the R software environment (v.3.1.1).
3. Results
3.1. Characteristics of the studied lakes
3.1.1. Phytoplankton assemblages
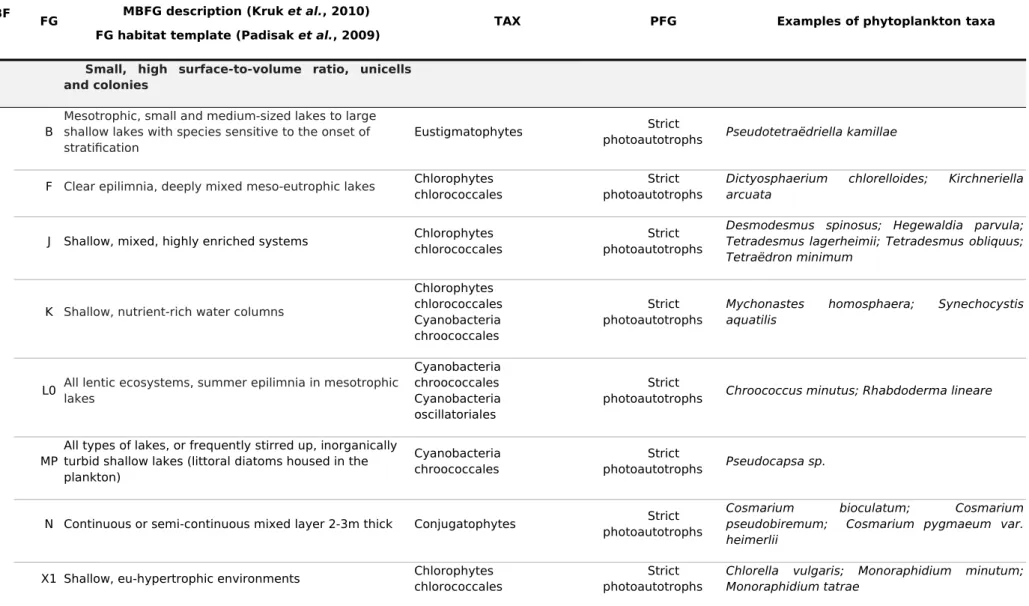
The phytoplankton taxa from the six lakes were classified into 13 taxonomic groups, two PFG groups, six MBFG groups, and 21 FG groups. A brief description of functional groups, correspondences among taxonomic and functional groups, and examples of the phytoplankton taxa identified are given in Supporting Information (Table S1).
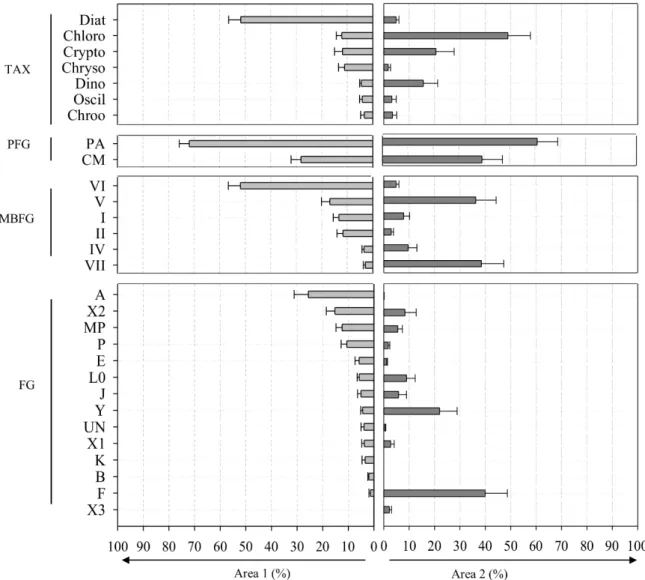
Figure 2 provides an overview of the taxonomic and functional composition of
phytoplankton assemblages found in each geographic area. The proportion of strict photoautotrophs (PA) and constitutive mixotrophs (CM) did not significantly vary between the two geographic areas. Mixotroph taxa represented 28 ± 4 % and 39 ± 8 % of phytoplankton assemblages in area 1 and 2 lakes, respectively. In the area 1 lakes, phytoplankton assemblages were dominated by diatoms (52 ± 5 %). The accompanying taxa
mainly consisted of chlorophytes (12 ± 2 %), cryptophytes (12 ± 3 %) and chrysophytes (11 ± 2 %). The main functional groups were the MBFG group VI (52 ± 5 %), and the FG group A (26 ± 6 %). In the area 2 lakes, phytoplankton assemblages were dominated by chlorophytes (49 ± 9 %). The accompanying taxa were mainly cryptophytes (21 ± 7 %) and dinoflagellates (16 ± 6 %). The main functional groups were MBFG groups V (36 ± 8 %) and VII (38 ± 9 %), and FG groups Y (22 ± 7 %) and F (40 ± 9 %).
Whatever the taxonomic and functional classifications used to calculate α-diversity indices, the richness (S) and evenness (J’) of phytoplankton assemblages did not significantly vary between the two geographic areas.
3.1.2. Biotic and abiotic environment
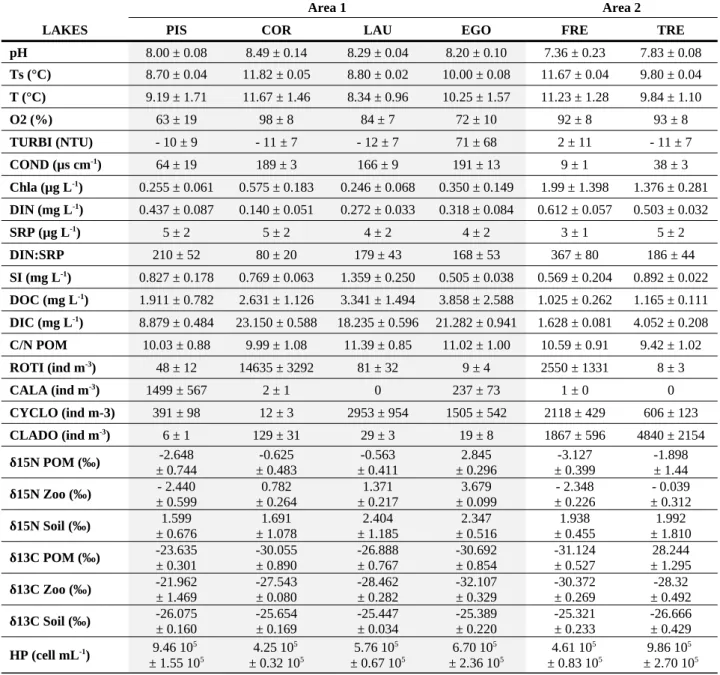
Data from multiparameter profiles indicated that the lakes were not, or were weakly, stratified, with no aphotic layer and/or anoxic layer, and with highest Chla at the bottom (data not shown) during the study. The average values of biotic and abiotic parameters measured in the six studied lakes are available in Table 2. All the lakes were poorly productive, with a trophic state ranging from ultra-oligotrophic (Max summer Chla < 2.5 µg L-1; Annual mean
total phosphorus < 4 µg L-1) to oligotrophic (2.5 µg L-1 < Max summer Chla < 8 µg L-1; 4 µg
L-1 < Annual mean total phosphorus < 10 µg L-1) according to the Organization for Economic
Co-operation and Development (OECD) classification (Hart, 1984). The lakes were clear, with low DOC concentrations (1 mg L-1 < DOC < 11 mg L-1). The C/N ratios (7 < C/N < 13)
indicated that the POM was mainly of phytoplankton origin, with a low fraction of terrestrial organic matter (C/N >> 10) (Gasiorowski & Sienkiewicz, 2013). The DIN:SRP ratios above the Redfield ratio of 7:1 on a mass basis (80 ± 20 < DIN:SRP < 367 ± 80) indicated that P was the main limiting nutrient in all lakes, as shown in a previous experimental study
(Jacquemin et al., 2018).
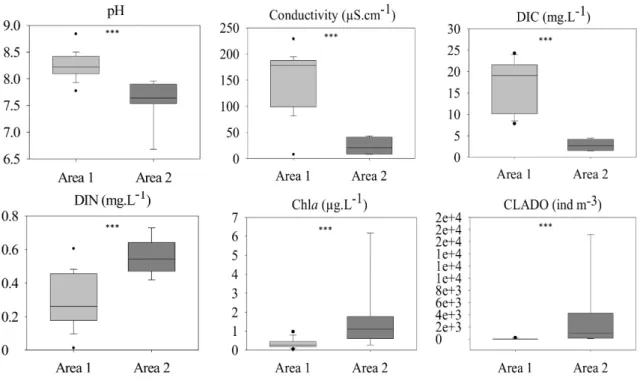
Six parameters significantly differed between the two geographic areas (Fig. 3). The catchment lithology, composed of granite and gneiss bedrocks, led to limited mineralization and neutral water in the area 2 lakes (Conductivity = 23.43 ± 5.02 µS cm-1; pH = 7.60 ± 0.13;
DIC = 2.84 ± 0.41 mg L-1), similar to that reported in other Alpine high mountain lakes
(Tolotti et al., 2006). Contrastingly, the schist, shale and sandstone bedrocks of the area 1 lakes led to greater mineralization and more basic water (Conductivity = 152.49 ± 14.52 µS cm-1; pH = 8.25 ± 0.06; DIC = 17.89 ± 1.45 mg L-1) (Mann-Whitney, p-value < 0.001). The
area 2 lakes showed higher DIN, Chla concentrations and cladocerans abundances (DIN = 0.560 ± 0.030 mg L-1; Chla = 1.68 ± 0.59 µg L-1; Clado = 3354 ± 1136 ind m-3) than the area 1
lakes (DIN = 0.290 ± 0.040 mg L-1; Chla = 0.36 ± 0.07 µg L-1; Clado = 46 ± 11 ind m-3)
(Mann-Whitney, p-value < 0.01).
3.2. Catchment influence on phytoplankton assemblages
3.2.1. PFG composition and α-diversity indices
The relative proportions of strict photoautotrophs (PA) and constitutive mixotrophs (CM) in phytoplankton assemblages are shown in Fig. 4. In the area 1 lakes, the relative abundance of mixotroph taxa was positively correlated to CAT in late summer (Spearman’s rank correlation test, rs = 0.84, p-value < 0.001). In the area 2 lakes, there was a higher proportion of mixotroph taxa in the lake with a large catchment (TRE lake) than in the lake with a small catchment (FRE lake), both in early summer (FRE CM = 71 ± 4 %, TRE CM = 87 ± 1 %, Mann-Whitney, p-value < 0.01) and in late summer (FRE CM = 2 ± 1 %, TRE CM = 4 ± 0 %, Mann-Whitney, p-value < 0.05).
The average richness and evenness of phytoplankton assemblages calculated from the four taxonomic and functional classifications are shown in Table 3. In area 1, we found no evidence of a significant linear relationship between CAT and α-diversity indices calculated from TAX, MBFG, and FG phytoplankton classifications. However, the richness indices were all significantly lower in lake PIS, the lake with the smallest catchment area (One-way ANOVA, p-value < 0.001). In the area 2 lakes, the richness of FG functional groups and the evenness of MBFG functional groups were significantly lower in the lake with a small watershed (FRE lake) (Mann-Whitney, p-value < 0.05). The lowest average richness and evenness of phytoplankton assemblages were systematically found in lakes PIS and FRE, the lakes with the smallest catchment areas in area 1 and 2 respectively.
3.2.2. TAX, FG, and MBFG composition
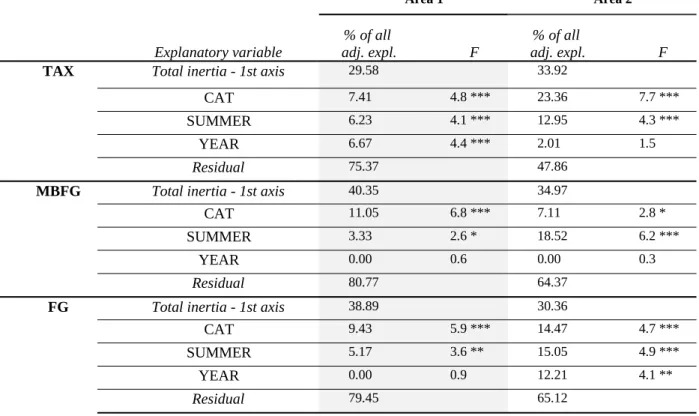
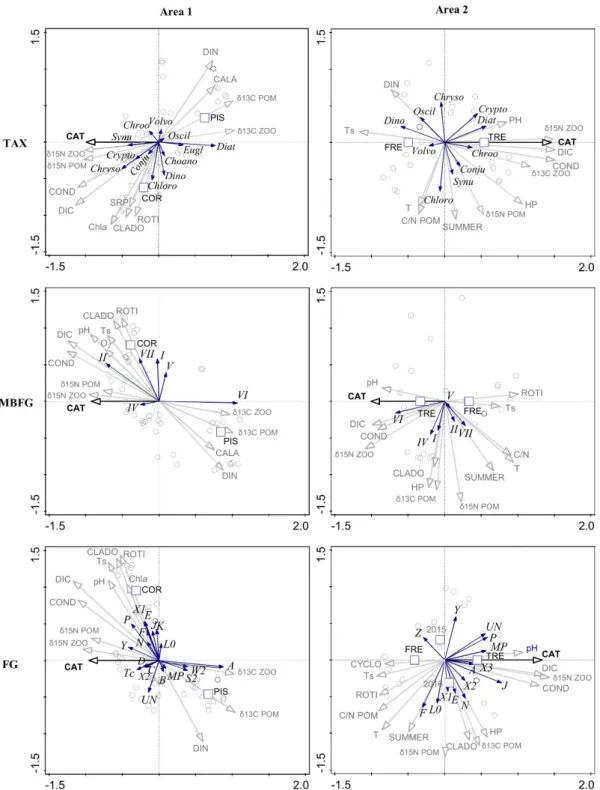
RDAs performed for each phytoplankton classification and each geographic area are summarized in Table 4. In the area 1 lakes, the effect of CAT on taxonomic and functional composition ranged from 7 to 10 % (p-value < 0.001). CAT was a better explanatory variable than intra-summer variability (SUMMER = 3 to 6 %, p-value < 0.05) and inter-annual variability (YEAR = 7 % for TAX, p-value < 0.001). In the area 2 lakes, the effect of CAT on phytoplankton composition ranged from 7 to 23 % (p-value < 0.05). CAT better explained taxonomic composition (CAT = 23 %, p-value < 0.001) than intra-summer variability (SUMMER = 13 %, value < 0.001), but explained MBFG composition (CAT = 0 to 7 %, p-value < 0.05) less well than intra-summer variability (SUMMER = 19 %, p-p-value < 0.001). CAT explained FG composition (CAT = 14 %, p-value < 0.001) almost as well as intra-summer variability (SUMMER = 15 %, p-value < 0.001).
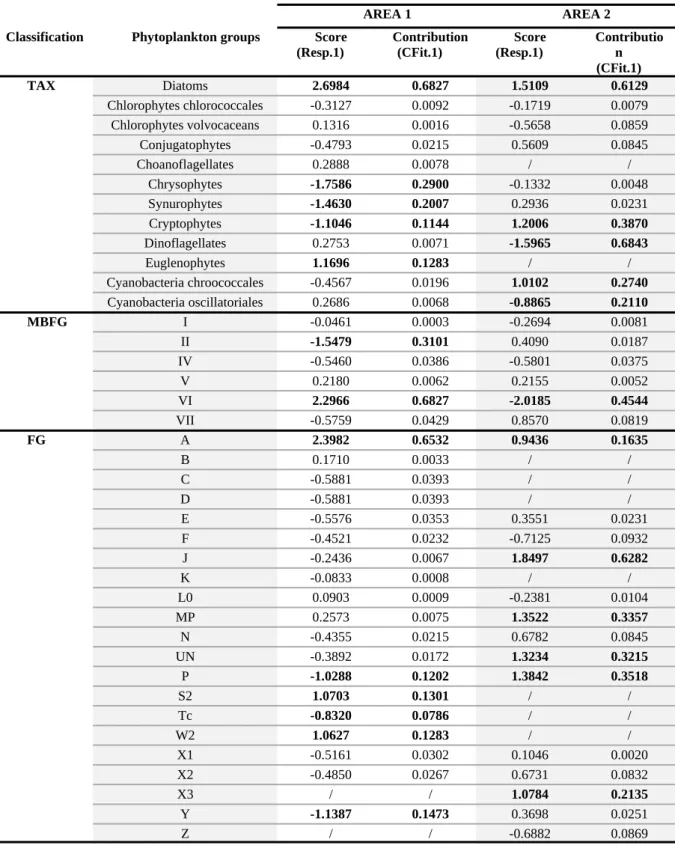
classification and each geographic area are displayed in Fig. 5. The scores and contributions (%) of the phytoplankton groups significantly correlated with CAT are available in Supporting Information (Table S2).
In the area 1 lakes, three taxonomic groups were positively correlated with CAT. In descending order of significant contribution on the first axis, these were chrysophytes (29 %), synurophytes (20 %) and cryptophytes (11 %). The functional groups significantly favored by larger CAT were MBFG group II (31 %), and FG groups Y (15 %), P (12 %) and Tc (8 %). In contrast, two taxonomic groups were negatively correlated with CAT: diatoms (68 %) and euglenophytes (13 %). The corresponding groups in functional classifications were MBFG group VI (68 %), and FG groups A (65 %), S2 (13 %) and W2 (13 %).
In the area 2 lakes, three taxonomic groups were positively correlated with CAT: diatoms (61 %), cryptophytes (39 %) and cyanobacteria chroococcales (27 %), all more represented in the lake with a large catchment area (TRE lake). The corresponding groups in functional classifications were MBFG group VI (45 %), and FG groups J (63 %), P (35 %),
MP (34 %), UN (32 %), X3 (21 %), and A (16 %). In contrast, only two taxonomic groups,
dinoflagellates (68 %) and cyanobacteria oscillatoriales (21 %), were favored in the lake with a small catchment area (FRE lake).
3.2.3. Phytoplankton environment relationship
The biotic and abiotic parameters measured during the sampling campaigns were projected as supplementary variables in RDA ordinations constrained by CAT (Fig. 5). The parameters coinciding with the first, constrained, axis were those whose variation was the most correlated with changes in phytoplankton composition explained by CAT. The environmental parameters coinciding with the second, unconstrained, axis were those whose
variation was the most correlated with the greatest phytoplankton variability not explained by CAT.
The best fitted area 1 lake parameter on the first axis was the isotopic signature of POM and zooplankton, positively related with CAT for δ15N, and negatively related with CAT
for δ13C. In the remaining ordination spaces, highest DIN concentrations were found in the
lake with the smallest catchment (PIS lake). DIN concentrations were negatively related with two sets of parameters. The first set was composed of chemical variables represented by DIC concentrations and conductivity, closer to axis 1, mainly concerning chrysophytes and cryptophytes, MBFG group II, and FG groups P and Y. The second set was composed of biotic variables represented by zooplankton rotifers and cladocerans, closer to axis 2, mainly concerning the phytoplankton assemblages of lake COR, that is, chlorophytes, MBFG group
VII, and FG groups E, X1 and F.
The best fitted area 2 lake parameters on the first axis were the isotopic signature of zooplankton (δ15N), DIC concentrations and conductivity, positively related with CAT. Mean
summer temperature (Ts) was also negatively related with CAT. On the second axis, intra-summer variability (SUMMER) was the main factor explaining the variance in phytoplankton composition not explained by CAT. SUMMER was mainly related with chlorophytes, the MBFG group VII, and the FG group F.
4. Discussion
The French Alps, the southernmost and westernmost part of the European Alpine chain, stand at the crossroads of Mediterranean and Alpine climatic influences. Data collected during a fifteen-year program monitoring and evaluating atmospheric deposition in Europe (EMEP) revealed that the southern French Alps were exposed to atmospheric N deposition rates twice as high as those of its northern counterpart over the years 2000-2013 (Fagerli et al., 2015). In addition, the southern French Alps are on the trajectory of enriched P-dust emitted from the Sahara Desert and the semi-arid Sahelian region, conveyed at altitudes of between 1500 and 4000 m above sea level (Moulin & Chiapello, 2004). This field study in northern and southern French Alpine lakes with contrasting nutrient deposition regimes addresses the following issues:
4.1. Catchment influence on functional diversity
The French Alpine lakes studied here shared features typical of high-altitude lakes (Rose et al., 2015). The lakes were clear, with little accumulation of dissolved and particulate organic matter of terrestrial origin in the pelagic zone. They were poorly productive, with a trophic state ranging from ultra-oligotrophic to oligotrophic. As the studied lakes have been shown to be mainly limited by P in a previous experimental study (Jacquemin et al., 2018), the southern lakes were characterized by higher phytoplankton biomass that likely reflected higher P-deposition regime. The almost twice as high dissolved inorganic nitrogen (DIN) concentrations measured in these lakes was consistent with their exposition to almost twice as high N-deposition rates.
In high altitude lakes, phytoplankton development is particularly subject to nutrient limitation during the ice-free summer, when temperature and light reach non-limiting levels (Bergstrom et al., 2013; Lewis, 2011). During this period, we found that the lakes with the smallest rocky catchments showed the lowest taxonomic, MBFG, and FG functional richness of phytoplankton communities in northern French Alpine lakes, and the lowest FG functional richness in the southern French Alpine lakes. The lakes with larger vegetated catchments were characterized by the coexistence of phytoplankton taxa with more diverse strategies in the acquisition and utilization of nutrient resources.
In the northern lakes exposed to low NP deposition, the lake with the largest vegetated catchment had a catchment-to-lake ratio 15 times higher than the lake with the smallest rocky catchment. The composition of phytoplankton communities varied from dominant phytoplankton taxa functionally adapted to very low nutrient levels in the lake with the smallest rocky catchment, to coexisting phytoplankton taxa requiring higher nutrient levels or requiring alternative organic sources of nutrients to support their growth in the lakes with larger vegetated catchments.
Indeed, in the lake with the smallest rocky catchment, the phytoplankton communities were dominated by small centric diatoms (Pantocsekiella comensis) belonging to the MBFG group VI, i.e. non-flagellated organisms with siliceous exoskeletons, and to the FG group A. Group A diatoms are typically found in base-poor lakes (Padisak et al., 2009). Because of these small centric diatoms’ low volume and spherical shape, they have a high affinity for nutrients and can grow under conditions of limited resources that deter larger pennate diatoms (Litchman & Klausmeier, 2008). Larger pennate diatoms belonging to the FG group P (Fragilaria tenera var. nanana, Fragilaria acus, Hannaea arcus), usually found in lakes with higher inorganic nutrient status (Padisak et al., 2009), developed in the lakes with larger
vegetated catchments.
The other phytoplankton groups favored by larger catchment areas were phytoflagellates: chrysophytes and synurophytes from the MBFG group II, i.e. small flagellated organisms with siliceous exoskeletal structure belonging to the FG groups E (e.g. Dinobryon sociale var americanum, Mallomonas sp.) and X2 (e.g. Kephyrion sp.), as well as cryptophytes from the MBFG group V, i.e. unicellular flagellates of medium to large size belonging to the FG groups Y (e.g. Cryptomonas sp.) and X2 (Plagioselmis nannoplanctica, Chroomonas sp.). Only dinoflagellates from the MBFG group V (e.g. Peridiniopsis edax, Parvodinium goslaviense, Gymnodinium sp.) were unaffected by catchment area.
Phytoflagellates have been shown to be a major component of the plankton in high altitude lakes (Rott, 1988; Tolotti et al., 2006; Tolotti et al., 2003), particularly well- adapted to the extreme environmental conditions prevailing in these ecosystems (e.g. oligotrophic conditions, thermal conditions, light regime and high UV radiation). Phytoflagellates are well known for their mixotroph ability, i.e. their physiological ability to combine photoautotrophy with heterotrophy to support new cell production (Mitra et al., 2016). The phagotrophic consumption of prey (e.g. bacteria and small eukaryotic cells) can constitute a valuable source of mineral nutrients, such as N and P, in phytoplankton cells. While prey digestion generally involves carbon (C) loss and nutrient release to maintain cell elemental balance (C:N:P), the synergistic acquisition of C by photosynthesis in mixotroph cells partly compensates for C loss and promotes N and/or P retention in cells (Sterner & Elser, 2002). This is one of the reasons why mixotroph ability contributes to the competitive advantage of mixotroph phytoplankton in oligotrophic high altitude lakes (Medina-Sanchez et al., 2004).
Although much is known about which organisms are mixotrophs and how they feed, there is less confidence about questions linked to “under what conditions” and “at what rate”
(Flynn et al., 2018; Rottberger et al., 2013; Weisse et al., 2016). However, nutrient conditions seem to be of major importance in determining the ecological performance of mixotrophs and their proportion in phytoplankton communities. The growth of mixotrophs may depends on the supply and availability of dissolved inorganic nutrients, as well as the quantity and nutritional quality of available prey (Mitra & Flynn, 2005; Olrik, 1998). The majority of mixotroph taxa are relatively poor competitors for inorganic N and P (Litchman et al., 2007). However, mixotrophy can enable growth to be sustained during periods of inorganic nutrient deficiency for non-mixotrophic competitors, when limiting nutrients become much more available in microbial prey (Jones, 1994, 2001).
In the northern lakes exposed to a low NP deposition regime, we first suggest that the supply of terrestrial organic matter constituted a valuable source of energy and/or inorganic nutrients (mostly P in this case) for the heterotrophic prokaryotic plankton (HP), which ultimately enhanced the ecological performance of mixotroph phytoplankton in the lakes with large vegetated catchments during the summer. In late summer, the abundance of potential mixotrophs was positively correlated with catchment area, their proportion increasing from 0% to 75% at the expense of diatoms and other less represented photoautotroph groups in phytoplankton assemblages. Such processes have already been shown in oligotrophic humic lakes of the temperate boreal zone, where the transfer of C to higher trophic levels appeared mainly supported by the terrestrial organic compounds consumed by the bacterioplankton, in turn predated by mixotroph phytoplankton outcompeting strict photoautotrophs (Bergstrom et al., 2003; Jansson et al., 1996). In alpine lakes, the occurrence of nutrient-poor conditions associated with increased concentrations of dissolved organic carbon have been shown to stimulate the appearance of small mixotrophic algal species, partially offsetting the decline in autotrophic phytoplankton biomass and increasing algal species richness (Parker et al., 2008).
more frequent pulses of P in lakes via permanent tributaries (either organic or inorganic) that could also lead to the prevalence of mixotrophs provided that P supply remains under a given threshold. Field survey and experimental studies conducted in lake La Caldera in the Spanish Sierra Nevada show a consistent response pattern with the prevalence of mixotroph under low but frequent inorganic nutrient inputs, whereas photoautotrophs responded to high inorganic nutrient inputs, denoting the differential growth strategy that both groups adopted with the nutrient-input schedule (Cabrerizo et al., 2017).
In the southern lakes exposed to a high NP deposition regime, the lake with the largest vegetated catchment had a catchment-to-lake ratio 1.3 times greater than the lake with the smallest rocky catchment. However, its catchment is actually 17 times larger if the vegetated areas are taken into account. This time, mixotroph strategists were not especially favored by a larger catchment area. The phytoflagellates constituted the major fraction of the phytoplankton assemblages in early summer (71% to 87%) and were mainly represented by dinoflagellates from the MBFG group V (Peridinium umbonatum, Gymnodinium sp.) and cryptophytes from the FG group V (Cryptomonas sp., Plagioselmis nannoplanctica). In late summer, the phytoplankton communities were largely dominated by photoautotrophs chlorophyte chlorococcales (96% to 98%). Under higher P-deposition regime, it is likely that photoautotroph growth was less limited by inorganic P during the summer than in the northern lakes, leading to marked dominance by photoautotrophs in late summer whatever the catchment area. These findings are consistent with the widely observed trend for photoautotrophs to out-compete mixotroph algae after nutrient inputs (Andersson et al., 2006; Isaksson et al., 1999). The dominance of chlorophytes has already been reported under high trophic conditions in the Alps (Tolotti et al., 2006). Furthermore, enriched P-dust has been shown to enhance the trophic state and to promote the development of chlorophytes in the Spanish Sierra Nevada lakes since the late 1990s (Carrillo et al., 2017; Delgado-Molina et al.,
In these conditions, the late summer phytoplankton communities varied from dominant phytoplankton taxa functionally adapted to moderate nutrient levels in the lake with small rocky catchment, to coexisting phytoplankton taxa requiring diverse nutrient levels in the lake with large vegetated catchment.
Indeed, the photoautotroph phytoplankton in the lake with small rocky catchment was largely dominated by phytoplankton taxa (Oocystis parva, Planktosphaeria gelatinosa) belonging to the MBFG group VII, i.e. large mucilaginous colonies, and to the FG group F. The members of these groups are usually reported in clear meso-eutrophic lakes, as they are characterized by high saturating concentrations but a tolerance for poor nutrient conditions (Kruk & Segura, 2012; Padisak et al., 2009).
The FG functional diversity of photoautotrophs was greatest in the lake with the largest vegetated catchment. The F chlorophytes were still present, but the FG groups X3 and
J were also well-represented. X3 chlorophytes (Schroederia setigera) and most J
chlorophytes (Coelastrum microporum, Crucigeniella apiculata) belonged to the MBFG group IV, while some J chlorophytes (Hegewaldia parvula, Scenedesmus ecornis) belonged to the MBFG group I. These functional groups are reported to occur in different habitat templates, from oligotrophic environments for X3 to enriched systems for J (Padisak et al., 2009). Members of group IV are usually characterized by moderate nutrient gathering, and members of group I by good nutrient gathering and low saturating concentrations (Kruk & Segura, 2012). Diatoms were also more abundant in this lake, represented by P pennate diatoms (Fragilaria acus), MP pennate diatoms (Achnanthidium minutissimum, Staurosira construens) (i.e. diatoms housed in the plankton), and A centric diatoms (Cyclotella sp.) with varying nutrient affinity.
In phytoplankton, several mechanisms play a role in maintaining diversity and species coexistence. Connell’s (1978) Intermediate Disturbance Hypothesis (IDH) states that in the absence of disturbance, competitive exclusion will reduce the number of species surviving to minimal level. If equilibrium assemblages develop, they consist of few K-selected species that corresponds to certain functional assemblages (Naselli-Flores et al., 2003; Tilman, 1977, 1982), and whose number should be equivalent to the number of limiting factors present if considering Hardin’s competitive exclusion principle (1960). Nutrient scarcity may select for species with high affinity for nutrient uptake (affinity-adapted), or of any other kind of nutrient-related strategy. In strongly selective environments, such as lakes characterized by extreme oligotrophy, equilibrium dynamics predict an eventual total suppression of diversity (Reynolds et al., 1993). However, steady-state develop very rarely in nature because potential limiting factors fluctuates at different frequencies. Such disturbances represent opportunities for the re-establishment of pioneer r-selected species, while successful competitors can withstand disturbance without completely taking over the community. Intermediate frequencies and intensities of disturbance should allow the maintenance of a strong compositional diversity (Padisak, 1993). Under very intense disturbance, only a few populations of r-selected species can re-establish themselves after each disturbance event.
The pattern of functional diversity we observed in this study could be discussed in the framework of the IDH concept. We suggest that nutrient fluctuations, i.e. frequency and intensity of N and/or P supply from catchments, could be assimilated to disturbances in oligotrophic high altitude lakes. In this view, we would expect a more complete steady-state in the lakes with small rocky catchment during the ice-free season. Indeed, a flow of nutrient-enriched water may enter these lakes during the snowmelt and results in a greater pool of nutrients available in spring. Then, in lakes limited by P, the phytoplankton growth may be mainly supported by steady P-recycling processes (e.g. microbial loop, zooplankton excretion,
internal load from sediments) during the summer (Villar-Argaiz et al., 2001). Conversely, a large catchment is probably a configuration favoring more fluctuations of nutrient supply in lakes, such as more frequent low-intensity events via permanent run-off in tributaries and/or more intense events during rainfalls due to large drainage area. Even without disturbance, the presence of vegetation cover should increase the number of coexisting species at the equilibrium by the supply of more diversified sources of nutrient in lakes (terrestrial organic matter) (Kopacek et al., 2011). Both catchment characteristics (larger size and vegetation cover) may allow for more functional coexistence in phytoplankton communities, without necessarily implying phytoplankton biomass increase.
These assumptions deserve to be tested in the future. However, we can notice that consistent results have already been reported in a large-scale geographical study in the Alps. As in our study, Tolotti et al. (2006) found a greater heterogeneity in the size of phytoplankton units in lakes characterized by larger catchments with greater vegetation cover, lower N concentration (Nitrate-NO3-), and higher nutrient level. Cell size in phytoplankton is
a master trait that can affect numerous functional traits and core metabolic rates (Naselli-Flores & Barone, 2011). Size diversity can reflect diverse strategies to gather and to exploit nutrient resources in phytoplankton communities (Litchman & Klausmeier, 2008; Reynolds, 1988).
On overall, our results suggest a non-linear relationship between functional diversity and catchment area, thus sharing similarities with the hump-shaped relationship between productivity and diversity (Borics et al., 2014; Dodson et al., 2000; Mittelbach et al., 2001). However, the nutrient deposition regime (intense P-pulse) appeared to be of major importance in determining which functional groups ultimately developed in late summer, such as the mixotroph and photoautotroph balance in the phytoplankton communities of lakes.
4.2. Catchment influence mediated by nutrient supply
During the summer, functional changes in phytoplankton composition induced by catchments were likely related to the supply of the limiting nutrient, inorganic and organic P, in lakes. Because P is rapidly processed in water (Lewis & Wurtsbaugh, 2008), the soluble reactive phosphorus (SRP) concentrations were low in the lakes studied. Being above the tree line, the lakes were also characterized by low accumulation of terrestrial organic compounds in the pelagic zone. Therefore, we failed to find direct evidence of the relationship between terrestrial nutrient supply and phytoplankton composition in lakes with larger catchment areas.
However, multiple parameters indicate that there was sufficient difference in the catchments to ensure that the supply of elements differed in lakes. First, weathering processes in larger catchments may have resulted in a higher leaching of inorganic ions in lakes, which increased the conductivity and DIC concentrations measured. Second, analyses of carbon (δ13C) and nitrogen (δ15N) stable isotopes ratios in seston and zooplankton appeared indirectly
to point to leaching of terrestrial organic matter in the lakes.
Stable isotope ratios can be used to monitor different elements in lacustrine environments, provided that the elements exhibit distinct isotopic signatures according to their origin (isotopic baseline), and that the isotopic signatures are transferred conservatively or changed predictably as elements cycle through the biosphere (isotopic fractionation) (Peterson & Fry, 1987). C can enter the plankton food web by two pathways: the dissolved inorganic carbon (DIC) fixed by photosynthesis, and the dissolved organic carbon (DOC) and particulate organic carbon (POC) mainly processed by HP plankton. The photosynthetic pathway should involve a net fractionation of δ13C in primary producers about 21 ‰ more
negative than the initial DIC uptake. Among potential sources of DIC, the CO2 in air (-7 ‰) is
depleted in 13C compared to carbonates (0 ‰), and the production of respired CO
2 can lead to
even more 13C-depleted DIC in lakes (Cole et al., 2002). Therefore, in carbonate-rich marine
environments, photosynthesis results in phytoplankton δ13C values of about -24 to -19 ‰. In
freshwater environments, the δ13C values of phytoplankton usually lie between −30 and −25
‰ (Jones et al., 2001; Karlsson et al., 2003). In lakes where respiration inputs are very strong, δ13C values for phytoplankton can reach -45 ‰ (Peterson & Fry, 1987). Since fractionation of 13C between trophic levels is insignificant (0 to 1 ‰), δ13C values are often used to evaluate
the main source of C incorporated into food webs (Tiunov, 2007). Over the lakes studied, δ13C
values in soils did not vary according to catchment area, ranging from -27 ‰ to -25 ‰. These results suggest a similar baseline of terrestrial organic matter received by the lakes (dissolved and/or particulate), typical of soils with dominant vegetation constituted by C3 plants (-28 ‰) (Feng, 2002; Kohn, 2010).
In the northern lakes exposed to a low NP deposition regime, the δ13C values of the
plankton tended to decrease with increasing catchment area. Because plankton values (-22 ‰ to -33 ‰) overlapped the baseline of terrestrial organic matter, the mineralization of terrestrial organic C did not appear to be the main pathway for C acquisition in the plankton food webs. Instead, we suggest that the contribution of atmospheric CO2 to DIC uptake was decreasing in
line with increasing availability of respired CO2 in the lakes. Terrestrial organic matter has
long been thought to be refractory to biological use, but there is multiple evidence that substantial portions are microbially respired in aquatic ecosystems (Ask et al., 2009; Battin et al., 2008). The plankton δ13C values may indirectly indicate the effective supply and
mineralization of terrestrial organic matter in the lakes with large vegetated catchments, but not the incorporation of terrestrial organic matter as the main source of C in the plankton food web. Indeed, some studies have already reported disproportionally low reliance on terrestrial
organic matter at higher trophic levels in the plankton web, compared with its high rates of input and high support of basic biomass production in lakes (Karlsson et al., 2012).
In the southern lakes exposed to a high NP deposition regime, the plankton δ13C values
varied more during the summer than between lakes. We were not able to determine the main source of DIC used in the plankton food web, but the lake with the largest vegetated catchment was not characterized by more heterotrophic conditions than the lake with the smallest rocky catchment.
There are far more confounding factors involved in interpreting the 15N isotopic ratios
in plankton, including trophic, species-specific and microbial-loop fractionation processes (Ostrom et al., 1998). However, since plankton δ15N values tended to increase with increasing
catchment area in both the northern and southern lakes, it is worth considering the possibility that different baseline DIN supplies were incorporated into plankton food webs according to catchment area. Lakes receive DIN from atmospheric precipitations and terrestrial ecosystems. In catchments, heavy 15N is accumulated in soils through a complex of
interrelated mechanisms (Handley & Scrimgeour, 1997). Very short contact times are required for the retention of atmospheric 15N-depleted DIN and the production of 15N-enriched
DIN by bacterial mineralization and nitrification of organic N in soils (Curtis et al., 2011). In many systems, there is a positive relationship between DIN retention, DIN transformation and DOC leaching in lakes, which appears to be related to the amount of stable pools of C in catchments (Camarero et al., 2009; Evans et al., 2006; Helliwell et al., 2007). In the lakes studied, we suggest that hydrological ‘bypass’ of atmospheric DIN decreased and that water– soil interaction (DIN cycling and retention) increased in the lakes with large vegetated catchments. Assuming homogenous isotopic signature for DIN in precipitations, this would both explain the higher plankton δ15N values and the lower DIN concentrations measured in
lakes with large vegetated catchments. Therefore, the plankton δ15N values could further
support the assumption of stronger water–soil interaction in lakes with larger vegetated catchments, involving higher P leaching from catchments and functional changes in phytoplankton composition.
5. Conclusion
The response of lakes to environmental changes will vary in relation to a set of landscape filters and potentially unique in-lake filters (Blenckner, 2005). At high altitudes, catchments are poorly productive and composed of a patchwork of rock scree, bare soil and alpine meadows. Our findings show that even subtle differences in nutrient conditions regulated by catchment characteristics can impact the functional diversity of phytoplankton communities in high altitude lakes, whatever the context of atmospheric nutrient deposition. The nutrient deposition regime appeared to interact with catchment characteristics in determining which functional groups ultimately developed in lakes, especially the mixotroph and photoautotroph balance in lakes’ phytoplankton communities. The balance between photoautotroph and mixotroph phytoplankton could substantially impact the overall plankton food web in lakes, and likely, its response to environmental changes (González-Olalla et al., 2018). There is even more reason to consider the role played by catchments when seeking to determine the vulnerability of high altitude lakes to future changes, as catchments’ own properties will vary under changes related to climate and airborne contaminants.
We thank the Ecrins and Mercantour national parks staff, the “Hautes Alpes” departmental unit of the French Agency for Biodiversity, and all the volunteers from Aix Marseille University and IMBE laboratory, especially Flavia Dory, Nicolas le Galliot, Maxine Thorel, Rémi Pagnon, Laurent Montoya, Vanina Beauchamps-Assali, who helped with field sampling. This work was supported by the French Agency for Biodiversity (Project 22-1) and forms part of Coralie Jacquemin’s PhD thesis.
Conflict of interests
References
Adrian R., et al. (2009). Lakes as sentinels of climate change. Limnology and Oceanography, 54(6), 2283-2297. doi:10.4319/lo.2009.54.6_part_2.2283
Andersson A., et al. (2006). Changes in the pelagic microbial food web due to artificial eutrophication. Aquatic Ecology, 40(3), 299-313. doi:10.1007/s10452-006-9041-7 Ask J., et al. (2009). Whole-lake estimates of carbon flux through algae and bacteria in
benthic and pelagic habitats of clear-water lakes. Ecology, 90(7), 1923-1932. doi:10.1890/07-1855.1
Battarbee R.W., et al. (2009). Threatened and stressed mountain lakes of Europe: Assessment and progress. Aquatic Ecosystem Health & Management, 12(2), 118-128. doi:10.1080/14634980902905742
Battin T.J., et al. (2008). Biophysical controls on organic carbon fluxes in fluvial networks. Nature Geoscience, 1, 95-100. doi:10.1038/ngeo101
Bergstrom A.K., et al. (2013). Nitrogen deposition and warming - effects on phytoplankton nutrient limitation in subarctic lakes. Global Change Biology, 19(8), 2557-2568. doi:10.1111/gcb.12234
Bergstrom A.K., & Jansson M. (2006). Atmospheric nitrogen deposition has caused nitrogen enrichment and eutrophication of lakes in the northern hemisphere. Global Change Biology, 12(4), 635-643. doi:10.1111/j.1365-2486.2006.01129.x
Bergstrom A.K., et al. (2003). Occurrence of mixotrophic flagellates in relation to bacterioplankton production, light regime and availability of inorganic nutrients in unproductive lakes with differing humic contents. Freshwater Biology, 48(5), 868-877. doi:10.1046/j.1365-2427.2003.01061.x
Blenckner T. (2005). A conceptual model of climate-related effects on lake ecosystems. Hydrobiologia, 533(1-3), 1-14. doi:10.1007/s10750-004-1463-4
Borics G., et al. (2014). The role of phytoplankton diversity metrics in shallow lake and river
quality assessment. Ecological Indicators, 45, 28-36.
doi:10.1016/j.ecolind.2014.03.011
Burns D.A. (2004). The effects of atmospheric nitrogen deposition in the Rocky Mountains of Colorado and southern Wyoming, USA - a critical review. Environmental Pollution, 127(2), 257-269. doi:10.1016/s0269-7491(03)00264-1
Cabrerizo M.J., et al. (2017). Rising nutrient-pulse frequency and high UVR strengthen microbial interactions. Scientific Reports, 7, 1-11. doi:10.1038/srep43615
Camarero L., & Catalan J. (2012). Atmospheric phosphorus deposition may cause lakes to revert from phosphorus limitation back to nitrogen limitation. Nature Communications, 3, 1-5. doi:10.1038/ncomms2125
Camarero L., et al. (2009). Regionalisation of chemical variability in European mountain lakes. Freshwater Biology, 54(12), 2452-2469. doi:10.1111/j.1365-2427.2009.02296.x Carrillo P., et al. (2017). Vulnerability of mixotrophic algae to nutrient pulses and UVR in an oligotrophic Southern and Northern Hemisphere lake. Scientific Reports, 7, 1-11. doi:10.1038/s41598-017-06279-9
Cole J.J., et al. (2002). Pathways of organic carbon utilization in small lakes: Results from a whole-lake 13C addition and coupled model. Limnology and Oceanography, 47(6), 1664-1675. doi:10.4319/lo.2002.47.6.1664
Connell J.H. (1978). Diversity in tropical rain forests and coral reefs. Science, 199(4335), 1302-1310. doi:10.1126/science.199.4335.1302
Curtis C.J., et al. (2011). What Have Stable Isotope Studies Revealed About the Nature and Mechanisms of N Saturation and Nitrate Leaching from Semi-Natural Catchments? Ecosystems, 14(6), 1021-1037. doi:10.1007/s10021-011-9461-7
Delgado-Molina J.A., et al. (2009). Interactive effects of phosphorus loads and ambient ultraviolet radiation on the algal community in a high-mountain lake. Journal of Plankton Research, 31(6), 619-634. doi:10.1093/plankt/fbp018
Dodson S.I., et al. (2000). The relationship in lake communities between primary productivity and species richness. Ecology, 81(10), 2662-2679. doi:10.1890/0012-9658(2000)081[2662:TRILCB]2.0.CO;2
Elser J.J., et al. (2009). Nutrient availability and phytoplankton nutrient limitation across a gradient of atmospheric nitrogen deposition. Ecology, 90(11), 3062-3073. doi:10.1890/08-1742.1
Evans C.D., et al. (2006). Evidence that Soil Carbon Pool Determines Susceptibility of Semi-Natural Ecosystems to Elevated Nitrogen Leaching. Ecosystems, 9(3), 453-462. doi:10.1007/s10021-006-0051-z
Fagerli H., et al. (2015). EMEP Status Report 2015 - Transboundary particulate matter, photo-oxidants, acidifying and eutrophying components: Norwegian Meteorological Institute.
Feng X. (2002). A theoretical analysis of carbon isotope evolution of decomposing plant litters and soil organic matter. Global Biogeochemical Cycles, 16, 66-61. doi:10.1029/2002GB001867
Flynn K.J., et al. (2018). Global Ecology and Oceanography of Harmful Algal Blooms, Chapter 7, Mixotrophy in Harmful Algal Blooms: By Whom, on Whom, When, Why, and What Next Ecological Studies (Vol. 232, pp. 113-132): Springer International Publishing AG.
Gasiorowski M., & Sienkiewicz E. (2013). The Sources of Carbon and Nitrogen in Mountain Lakes and the Role of Human Activity in Their Modification Determined by Tracking Stable Isotope Composition. Water Air and Soil Pollution, 224(4), 9. doi:10.1007/s11270-013-1498-0
González-Olalla J.M., et al. (2018). Climate-driven shifts in algalbacterial interaction of highmountain lakes in two years spanning a decade. Scientific Reports, 8, 10278. doi:10.1038/s41598-018-28543-2
Grégori G., et al. (2001). Resolution of viable and membrane compromised bacteria in freshwater and marine waters based on analytical flow cytometry and nucleic acid double staining. Applied and Environmental Microbiology, 67, 4662–4670. doi:10.1128/AEM.67.10.4662-4670.2001
Handley L.L., & Scrimgeour C.M. (1997). Terrestrial Plant Ecology and 15N Natural Abundance: The Present Limits to Interpretation for Uncultivated Systems with Original Data from a Scottish Old Field. In M. Begon & A. H. Fitter (Eds.), Advances in Ecological Research (Vol. 27, pp. 133-212): Academic Press.
Hardin G. (1960). The Competitive Exclusion Principle. Science, 131(3409), 1292-1297. doi:10.1126/science.131.3409.1292
Hart B.T. (1984). Eutrophication of waters - Monitoring, assessment and control - OECD. Search, 15(1-2), 50-50. doi:10.1002/iroh.19840690206
Helliwell R.C., et al. (2007). The role of catchment characteristics in determining surface water nitrogen in four upland regions in the UK. Hydrology and Earth System Sciences, 11(1), 356-371. doi:10.5194/hess-11-356-2007
Hu Z.J., et al. (2014). Catchment-mediated atmospheric nitrogen deposition drives ecological change in two alpine lakes in SE Tibet. Global Change Biology, 20(5), 1614-1628. doi:10.1111/gcb.12435
Isaksson A., et al. (1999). Bacterial grazing by phagotrophic phytoflagellates in a deep humic lake in northern Sweden. Journal of Plankton Research, 21, 247-269. doi:10.1093/plankt/21.2.247
Jacquemin C., et al. (2018). Growth rate of alpine phytoplankton assemblages from contrasting watersheds and N-deposition regimes exposed to nitrogen and phosphorus enrichments. Freshwater Biology, 63(10), 1326-1339. doi:10.1111/fwb.13160
Jansson M., et al. (1996). Nutrient limitation of bacterioplankton, autotrophic and mixotrophic phytoplankton, and heterotrophic nanoflagellates in Lake Örträsket. Limnology and Oceanography, 41(7), 1552-1559. doi:10.4319/lo.1996.41.7.1552 Jones R.I. (1994). Mixotrophy in planktonic protists as a spectrum of nutritional strategies.
Marine Microbial Food Webs, 8(1-2), 87-96.
Jones R.I. (2001). Mixotrophy in planktonic protists: an overview. Freshwater Biology, 45(2), 219-226. doi:10.1046/j.1365-2427.2000.00672.x
Jones R.I., et al. (2001). Sources and fluxes of inorganic carbon in a deep, oligotrophic lake (Loch Ness, Scotland). Global Biogeochemical Cycles, 15, 863-870. doi:10.1029/2001GB001423
Karlsson J., et al. (2012). Terrestrial organic matter support of lake food webs: Evidence from lake metabolism and stable hydrogen isotopes of consumers. Limnology and Oceanography, 57(4), 1042-1048. doi:10.4319/lo.2012.57.4.1042
Karlsson J., et al. (2003). Control of zooplankton dependence on allochthonous organic carbon in humic and clear-water lakes in northern Sweden. Limnology and Oceanography, 48(1), 269-276. doi:10.4319/lo.2003.48.1.0269
Kohn M.J. (2010). Carbon isotope compositions of terrestrial C3 plants as indicators of (paleo)ecology and (paleo)climate. Proceedings of the national academy of sciences, 107(46), 19691-19695. doi:10.1073/pnas.1004933107
Kopacek J., et al. (2011). Phosphorus loading of mountain lakes: Terrestrial export and atmospheric deposition. Limnology and Oceanography, 56(4), 1343-1354. doi:10.4319/lo.2011.56.4.1343
Kopacek J., et al. (2005). Long-term trends and spatial variability in nitrate leaching from alpine catchment - lake ecosystems in the Tatra Mountains (Slovakia-Poland). Environmental Pollution, 136(1), 89-101. doi:10.1016/j.envpol.2004.12.012
Kotlarski S., et al. (2012). Elevation gradients of European climate change in the regional climate model COSMO-CLM. Climatic Change, 112(2), 189-215. doi:10.1007/s10584-011-0195-5
Kruk C., et al. (2010). A morphological classification capturing functional variation in phytoplankton. Freshwater Biology, 55(3), 614-627. doi:10.1111/j.1365-2427.2009.02298.x
Kruk C., et al. (2011). Phytoplankton community composition can be predicted best in terms of morphological groups. Limnology and Oceanography, 56(1), 110-118. doi:10.4319/ lo.2011.56.1.0110
Kruk C., & Segura A.M. (2012). The habitat template of phytoplankton morphology-based functional groups. Hydrobiologia, 698, 191–202. doi:10.1007/s10750-012-1072-6 Lewis W.M. (2011). Global primary production of lakes: 19th Baldi Memorial Lecture.
Inland Waters, 1(1), 1-28. doi:10.5268/iw-1.1.384
Lewis W.M., & Wurtsbaugh W.A. (2008). Control of Lacustrine Phytoplankton by Nutrients: Erosion of the Phosphorus Paradigm. International Review of Hydrobiology, 93(4-5), 446-465. doi:10.1002/iroh.200811065