Titre:
Title
:
Evaluation of the overflow failure scenario and hydrograph of an
embankment dam with a concrete upstream slope protection
Auteurs:
Authors
: François Chiganne, Claude Marche et Tew-Fik Mahdi
Date: 2014
Type:
Article de revue / Journal articleRéférence:
Citation
:
Chiganne, F., Marche, C. & Mahdi, T.-F. (2014). Evaluation of the overflow failure scenario and hydrograph of an embankment dam with a concrete upstream slope protection. Natural Hazards, 71(1), p. 21-39. doi:10.1007/s11069-013-0897-2
Document en libre accès dans PolyPublie
Open Access document in PolyPublie
URL de PolyPublie:
PolyPublie URL: https://publications.polymtl.ca/5314/
Version: Version finale avant publication / Accepted version Révisé par les pairs / Refereed Conditions d’utilisation:
Terms of Use: Tous droits réservés / All rights reserved
Document publié chez l’éditeur officiel Document issued by the official publisher
Titre de la revue:
Journal Title: Natural Hazards (vol. 71, no 1) Maison d’édition:
Publisher: Springer URL officiel:
Official URL: https://doi.org/10.1007/s11069-013-0897-2 Mention légale:
Legal notice:
This is a post-peer-review, pre-copyedit version of an article published in Natural Hazards. The final authenticated version is available online at:
https://doi.org/10.1007/s11069-013-0897-2
Ce fichier a été téléchargé à partir de PolyPublie, le dépôt institutionnel de Polytechnique Montréal
This file has been downloaded from PolyPublie, the institutional repository of Polytechnique Montréal
1
EVALUATION OF THE OVERFLOW FAILURE SCENARIO
1
AND HYDROGRAPH OF AN EMBANKMENT DAM WITH A
2
CONCRETE UPSTREAM SLOPE PROTECTION
3 4
François Chiganne, Claude Marche et Tew-Fik Mahdi
5 6
Département des génies civil, géologique et des mines 7
École Polytechnique de Montréal 8
C.P. 6079, Succ. Centreville, 9
Montréal, Québec, Canada, H3C 3A7. 10
* Auteur correspondant: tewfik.mahdi@polymtl.ca, Tel: (514) 340-4711 ext. 5874. 11
12 13
Abstract : The standard procedure in Quebec, Canada, for evaluating the failure of an embankment dam, per the
14
Loi sur la sécurité des barrages, specifies a 30 minute long failure scenario with a breach width equal to four times 15
the maximal height of the dam. We demonstrate a new method for evaluating the flood overtopping failure scenario 16
for embankment dams with concrete upstream slope protection, using Toulnustouc Dam for example computations. 17
Our new methodology computes safety factors for a range of potential failure mechanisms taking into account 18
geotechnical, hydraulic, and structural factors. We compile the results of our investigations of the various dam
19
failure mechanisms and compare the corresponding dam failure hydrographs to the current hydrograph specified in
20
the standard analysis procedures. Our investigations tend to invalidate the current standard procedures for evaluating 21
the failure of rockfill dams with concrete upstream faces, by indicating that the current standard procedures 22
underestimate the peak failure discharge and overestimate the time to the peak discharge. 23
Key words: dam failure, overtopping, rockfill dam, failure hydrograh. 24
2
1. Introduction
26 27
The oldest known dam is an earth-fill dam constructed in the Garawi Valley in Egypt about 3000 years ago. 28
Although our knowledge of dam construction techniques and reservoir operations has increased dramatically over 29
the years, the potential for dam failures still poses a significant threat to communities around the world. Dam 30
failures have been responsible for more than 8000 deaths and hundreds of millions of dollars in economic losses 31
since 1900 (Marche, 2008). 32
These failures were primary due to inadequate construction materials and/or design of the dam structure and the 33
corresponding spillway structure. In order to increase dam safety, standard procedures, regulations and models 34
have been established to diminish the risk of failure due to overtopping (i.e., establishment of minimal discharge 35
capacity etc.), and to better define the downstream flood hazard zone corresponding to a catastrophic dam failure. 36
These standard procedures and regulations are not intended to represent specific failure scenarios, they are based 37
on information from former failures. For embankment dams and overtopping failures, the standard procedures, in 38
Quebec, Canada, specify the formation, in 30 minutes, of a breach with a bottom width equal to four times the 39
maximum height of the dam (Marche, 2008). Given these specifications for the breach geometry, it is possible to 40
calculate a failure hydrograph and to delimit the corresponding flood hazard areas. 41
Masson (2009) compares the failure hydrographs of an embankment dam (dyke Moncouche) with a concrete 42
curtain calculated using the standard procedures specified in the current regulations with the results of a 43
methodology based on the calculation of structural safety factors, whose validities were confirmed by an 44
experimental model. The scale effect was taken into account in this work by adjusting erosion depths, overtopping 45
levels, breach discharges and the time scale, which strengthened the validity of the results. First, these results 46
highlighted that the duration of the dam failure, 30 minutes, may be overestimated (of about 15%). Then, it was 47
demonstrated that the current regulation doesn’t take into account dams’ specificities such as a rising of the dam 48
or the installation of a parapet, these measures security being able to increase the safety of the dam by increasing 49
failure’s duration and decreasing the peak discharge. Finally, the hypothesis that the discharge increases linearly 50
3
is questioned. Structural elements, such as a concrete curtain, can indeed lead to several brutal increases of the 51
discharge. Our goal in this article is to highlight the differences between overtopping scenarios for an
52
embankment dam with a concrete upstream face corresponding to the current standard procedures with those
53
calculated based on different failure mechanisms not considered in the current regulations.
54 55
Since we use the Toulnustouc Dam to demonstrate our methodology, we first describe the key characteristics of 56
this dam. Next we describe our metholodologies for calculating a series of safety factors corresponding to the 57
following failure mechanisms: a) the landslide safety factor is calculated based on the "Multiple Wedge Analysis" 58
(U.S. Army Corps of Engineers, 1995); b) the safety factor for dam failure caused by the motion of the crest 59
material is evaluated using a seepage model for the dam and a study of the forces acting on a rock on the 60
downstream side of the crest; c) dam failure caused by the motion of the downstream bottom of the dam is linked 61
to the velocity and the hydraulic gradient of flow through the dam using the studies by Wilkins (1956); and d) 62
failure of the parapet and the upstream slope protection are evaluated using strength of material analyses. 63
To demonstrate our methodologies for calculating a series of safety factors corresponding to different failure 64
mechanisms, we provide example calculations corresponding to a specific flood scenario for Toulnustouc Dam. 65
We compare the results of these analyses, including the corresponding dam failure hydrograph, with those using 66
the standard procedures specified in current regulations. 67
68
2. Toulnustouc dam
69 70
The Toulnustouc dam is located in the Côte-Nord area, in Rivière-aux-Outardes. It’s an embankment dam with an 71
upstream concrete mask, 77 m high and 535 m long. The reservoir reaches a maximum depth of 72.3 m on the 72
upstream side of the dam. The dam is built with large stones (figure 1 and 2), types 8C, 8B, 8A and 7D. The 8A 73
and 7B layers (also called “mask”) are only used to stabilize the foundation of the upstream slope protection of 74
4
the dam. Most of the rocks have a diameter of about 1 m. Figures 1 and 2 illustrate the overall geometry of the 75
dam and give details of the crest geometry. 76
The concrete upstream slope protection is 300 mm thick and has steel bars in each direction, which represent 77
between 0.4 and 0.6 % of the cross-section, depending of the distance from the peripheral seals. This framework 78
is located in the center of the upstream slope protection (Beauséjour, Bouzaïene, Hammamji, Bigras, & Bergeron, 79 2006). 80 81
3. Failure scenarios
823.1.Seepage
83In order to describe the safety factors associated with various dam failure scenarios, we first need to describe the 84
characteristics of seepage through dams. The height of water above the parapet (W, defined in the equation [1]) 85
governs the water seepage through the dam. Hres, hp and H dam represent the height of water in the reservoir, the
86
height of the parapet and the height of the dam (figure 1). 87
[1]
W H
=
res−
H
dam−
h
p88
The water height on the downstream side of the crest he, depend on parameter W.
89
The overtopping wave is divided into several sections (figure 4) and he is calculated by an iterative process for a
90
unit width, based on mass conservation, as follows. 91
1. A value of he is chosen to begin the process
92
2. The following equations (Eqs. 2 through 6) are solved with this value of he to yield a corresponding value
93
of W 94
3. The value of hc is systematically changed until convergence to the appropriate value of W. If the process
95
diverges (very small value of hc leading to a very high value of W), the seepage length l0 (defined as the
96
width of the crest were the seepage occurs) is smaller than the width Lc of the crest. hc being equal toh0,
97
the iteration is then made on h1 and hc is equal to zero.
5
In each iteration, equations [2] to [5], the spillway formula and the Torricelli formula (Bennis, 2007) are 99 solved. 100 [2] 3 0 2 e q =m gh 101 [3] ' 2 2 i d i sp q =C gh S 102 [4]
q
i+1= +
q q
i'
i 103 [5] 1 23 1 ( ) 2 i i q h m g + + = 104 [6]h
n=
W
105 Where 106n : Number of sections which divide the overtopping wave 107
qi : horizontal discharge upstream of the i section (m3/s/m)
108
m : spillway coefficient (-) 109
g : gravitational acceleration (m.s-2) 110
hi : water level in the i section i (m)
111
q’i : vertical discharge in the i section (m3/s/m)
112
Cd : seepage coefficient taking into account turbulence and the horizontal velocity (-)
113
Ssp : seepage area for a unit width, depending on the porosity (m2/m)
114
qi+1 : horizontal discharge upstream of the i+1 section (m3/s/m)
115
hi+1 : water level in the i+1 section i (m)
116 117
3.2.Landslide
118
The pressure of the water on the upstream concrete slope protection could result in the landslide of part of the 119
dam. The “Multiple Wedge Analysis” method (U.S. Army Corps of Engineers, 1995) (figure 5), allows 120
calculation of the landslide safety factors associated with different overtopping heights. After having defined the 121
6
fracture line, the safety factor is calculated based on the equilibrium of the shear strength and the applied stresses. 122
These stresses are calculated by dividing the dam into several blocks and by calculating the forces on each of 123
these blocks per unit width. The equation [5] gives the safety factor. 124
[7] 1
1
[( )cos ( )sin ( )sin ]tan
1
( )cos ( )cos ( )sin
i i i Li Ri i i i i i i i i Li Ri i i i i i i i W V H H P P U C L FS H H P P W V − − + + − + − − + = − + − − + 125 Where 126
i : number defining the block (-) 127
1
(
P
i−−
P
i)
: sum of the horizontal forces applied on the block i (N.m-1) 128Wi : total weight, combining the effects of water, rocks and concrete (N.m-1)
129
Vi : vertical force applied on the top of the block (N m-1)
130
αi : angle between the fracture line of the i block and the horizontal (°)
131
Φi : internal angle of friction of the i block materials (°)
132
Ui : upward flow force applied on the bottom of the i block (N m-1)
133
HLi : horizontal force applied on the left of the i block (N m-1)
134
HRi : horizontal force applied on the right of the i block (N m-1)
135
Li : length of the fracture line of the i block (m)
136
Ci : cohesion of the materials of the i block (Pa)
137
FS1 : landslide safety factor (-) 138
The equations [8] and [9], once solved, give the landslide safety factor for the dam. 139 [8] ( i 1 i) 0 i P− −P =
140 Where 141 [9] 142 1tan
[(
) cos
(
)sin ]
(
) cos
(
)sin
1
1
(
)
tan
(cos
sin
)
1
i i i i i i Li Ri i Li Ri i i i i i i i i i i i i ic
W V
U
H
H
H
H
W V
L
FS
FS
P
P
FS
−+
−
+
−
−
−
+
+
+
−
=
−
143 1447
3.3.Motion of the crest materials
145
In this study of the failure scenarios, we consider that some of the overtopping water infiltrates into the dam from 146
the crest. However, the overtopping flow rate can be high enough that this flow does not entirely infiltrate into the 147
dam. In this case, the overtopping can lead to the motion of the rock on the downstream side of the crest. The 148
horizontal velocity of the flow is responsible for a horizontal drag force on the rocks, balanced by the friction 149
forces from the materials below, depending on the weight of the rock and the buoyancy force. Our goal here is to 150
compare the drag force and the friction force by calculating a safety factor, equal to the friction force/drag force 151
ratio, to determine if the friction force is important enough to prevent the rock from moving. 152
From the study of the seepage through the crest, we know the level of water on the downstream side of the crest 153
for each value of W. Then, the forces acting on the rock are calculated (figure 6) : the weight P, the buoyancy A, 154
the vertical reaction of the dam R, the drag force D (Etienne Guyon & Hulin, 2001), and the friction force T 155
(Lancellota, 2009). Finally, the safety factor can be determined with Eq. 15. 156 [10]
P
=
roc rV
157 [11]A
=
wat rV
158 [12]R P A
= −
159 [13] 2 2 e D A D C V=
160 [14] T =(P A− ) tan 161 [15] FS2 T D = 162 Where 163γroc : unit weight of the rock (N.m-3) 164
γwat : unit weight of the water (N.m-3) 165
P : stone weight (N)
166
A : buoyancy (N)
167
R : vertical reaction of the dam (N) 168
8 V: overflow velocity (m.s-1) 169 D : drag force (N) 170 V r: rock volume (m3) 171
Ae : vertical surface of the rock (m2)
172
T : friction force (N)
173
Φ : internal angle of friction (°) 174
FS2 : safety factor (-) 175
176
3.4.Motion on the downstream face bottom
177
Wilkins (1956) investigations, led to the discovery of a limit gradient equal to 1. That is, rocks are put in motion 178
when the hydraulic gradient is greater than the limit gradient (this theory can also be found in (Lafleur, 1991)). 179
Using the geotechnical properties of the rock fill, our goal is to estimate the water velocity in the area where the 180
water leaves the dam, which is not only where the velocity is the greatest, but also where the rocks are more likely 181
to start moving by the action of water. Wilkins (1956) proposed a method for estimating the depth flow exiting 182
the downstream face of the dam, based on assuming critical flow depth corresponding to a Froude Number of 1. 183
Equation [16] gives this depth of flow or water level. 184 [16] ( 2 *(1 ) )2 1/3 s e q h g e + = 185 Where 186
q : seepage discharge in the dam per unit width (m3/s/m) 187
e : rock fill void ratio (-) 188
hs : water level where the water leaves the dam (m)
189
An empirical formula which links the water velocity in the voids V (m.s-1) and the hydraulic gradient i (-) for 190
turbulent flows (flow through rockfill dams being high Reynolds number flows) is then used. Several formula 191
exist in the literature ((Ergun, 1952), (Martins, 1990), (Mc Corquodale, Hannoura, & Nasser, 1978), (Stephenson, 192
9
1979), (Wilkins, 1956)). In all of these equations, g is the gravity acceleration (m.s-2), d is the rocks diameter (m), 193
v the cinematic viscosity (m2.s-1), e the void ratio (-) and n the porosity (-). 194 • Ergun (1952) 195 [17] 2 3 2 1 150 (1 ) 1.75 ( n)( n V V ) i n gd gd
− − = + 196 • Martins (1990) 197 [18] 2 2 2 22
. .
u MC
i
V
n K g e d
=
198Cu is a uniformity coefficient (
C
u=
d
60d
10) and α an empirical coefficient (α = 0,26). KM is the empirical199
coefficient of Martins, equal to 0,56 for angular materials 200 • Wilkins (1956) 201 [19] 1.85 0.93 1 (V ) i m Wn = 202
W is an empirical coefficient equal to 5,243 (m0.495.s-1) in the international system of units and m is the hydraulic 203 radius (m). 204 • McCorquodale et al (1978) 205 [20] 2 2 0.5 70 V 0.54 V i gnm gn m
= + 206 [21]1
(1
)
2
e of
f
=
+
207fe and fo are friction factors of Darcy-Weisbach. fe is the friction factor of the rocks and the permeameter, without
208
considering the wall-effect which could have an impact on the value of the hydraulic radius (Devendra mehta & 209
Hawley, 2002), fo is the friction factor of an hydraulically smooth surface for the same Reynolds number.
210
According to McCorquodale, for coarse rockfill, the fe/fo ratio is about 1,5.
211
• Stephenson (1979) 212
10
[22]
i
K
2V
2gdn
=
213Ks is an empirical coefficient of Stephenson whose value is about 1,4.
214 • Ergun-Reichelt (1990) 215 [23] 2 2 3 2 1 214 (1 ) 1.57 ( n)( M n V MV ) i n gd gd
− − = + 216 [24]1
2
3 (1
)
d
M
D
n
= +
−
217D is the diameter of the permeameter. 218
219
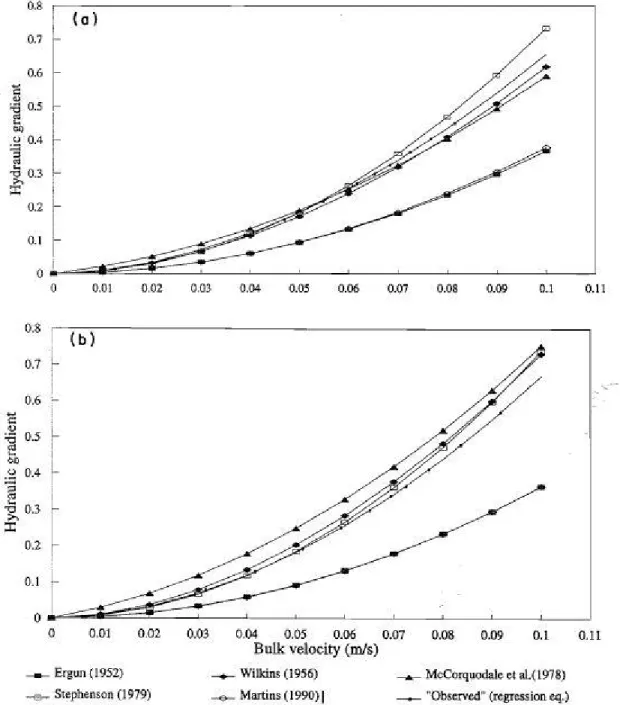
Experiments have been conducted at the University of Ottawa(Hansen, Garga, & Townsend, 1995). 1D hydraulic 220
tests have been performed in a packed-column apparatus on various type of rocks and experimental results were 221
compared to the results obtained by applying the previous equations (figure 7). The Stephenson (1979) and 222
Wilkins (1956) performed the best and for high gradient and bulk velocity, the Wilkins equation appeared to be 223
the more accurate. Consequently this formula has been chosen for our investigations. 224
The velocity in the voids Vv (m/s) is given by Equation 25 as a function of discharge per unit with q (m3/s/m), the
225
flow depth exiting the dam face hs (m) and porosity n.
226 [25] v s
q
v
nh
=
227The safety factor FS3 is defined as the limit gradient/actual gradient ratio: 228
[26] FS3 1
i = 229
Once the safety factor reaches the value of 1, the most-downstream rock is put in motion and leaves the dam; 230
consequently, another rock on the downstream face takes its place without any change of the hydraulic gradient. 231
This continues until the complete disappearance of the upper layer of the downstream face of the dam. At the end 232
11
of this process, the crest width has decreased. Consequently, the downstream layer of the dam is considered to be 233
lost once the safety factor reaches the value of 1. 234
235
3.4.Parapet and concrete slope protection failure
236
In case of overtopping, the concrete mask and the parapet on the upstream side of the crest are subjected to 237
external loads, caused by the active water pressure and the passive embankment pressure, which can lead to the 238
failure of the structural elements of the dam. The weight of these elements is also responsible for internal loads. 239
These loads are rectangular and triangular and depend on parameters Hdam (dam height) (m), Lm (mask length), hp
240
(parapet height) (m), W(overflow height) (m), tm (concrete mask thickness) (m), Kp (passive earth pressure
241
coefficient) (-), β (downstream face of the dam angle with the horizontal plane) (°) and the water, concrete and 242
rocks weights (N.m-3) (figures 7 and 8). 243
The calculation of shear forces T (N) and bending moments M (N.m) in the upstream slope protection and the 244
parapet is followed by the calculation of shear stresses τ and bending stresses in the structural elements. In theory, 245
the 3 dimensions of stress should be taken into account, but one dimension can be excluded. Forces are 246
symmetrical in the axial direction of the dam, consequently the system is a plane stress situation. 247
The x-axis is parallel to the downstream slope protection and to the parapet and most of the stress is parallel to 248
this axis. The y-axis is perpendicular to the x-axis and the stress in this direction is very low and considered to be 249
equal to zero in this calculation. In addition, shear stress τxy is equal to τyx. 250
The shear stress is calculated in the center of the cross-section and the bending stress is calculated in the 251
downstream and upstream ends of the cross-section (figures 10 and 11). Once the distribution of stresses is known 252
in the structural elements, safety factors can be calculated. Both of the safety factors presented in this section are 253
calculated in the middle and in the downstream and upstream ends of the structural elements. 254
Stresses per unit width are calculated with the equations [27] to [34] for the upstream slope protection. The 255
equations for the parapet are not shown explicitly herein but can be defined with the same methodology as that 256
used to define the stresses for the upstream slope protection (equations [27] to [34] , equations [35] and [36]).) 257
Where 258
12
[27]
x upstream−=
active water pressure− −+
passive soil pressure− −+
mask weight−= -
x downstream−et
x center−=
0
259 [28] 2 3(
)
(
- )
*(( )*
*
)
2
2
6
m wat m mactive water pressure p barr
m
t
L
x
L x
h
W
H
I
L
− −=
+
−
+
260 [29] 3(
)
*
*
*
*
2
6
m mpassive soil pressure p dam soil
m
t
L
x
K
H
I
L
− −
−
= −
261[30]
mask weight−=
cos *
concrete*(
L
m−
x
)
262[31]
xy masl middle− −=
active water pressure− −+
passive soil pressure− −+
mask weight−et
xy ends−=
0
263 [32] 23
( - )
*(( ) * (
)
*
)
2
2
wat mactive water pressure p m dam
m m
L
x
h
W
L
x
H
t
L
− −= −
+
− +
264 [33] 2(
- )
3
*
*
*
*
2
2
m active water pressure p dam soilm m
L
x
K
H
t
L
− −=
265 [34] 3*sin( ) * * ( - ) 2mask weight concrete Lm x
− = −
266
And in the parapet : 267
[35] 268
et
0
x parapet upstream active water pressure passive water pressure parapet weight x parapet downstream xy parapet ends
− −=
− −+
− −+
−= −
− −
− −=
269 270
[36]
x parapet middle− −=
0
xy=
xy parapet middle− − 271From the triplet (σx ; σy ; τxy), the principal stresses σ1 and σ3 are calculated (by convention σ1 > σ3) using the 272
properties of the Mohr’s circle (figure 11) (André Bazergui, Bui-Quoc Thang, & André Biron, 2002). 273 [37] 1
(
)
2 22
2
x y x y xy
=
+
+
+
+
274 [38] 3(
)
2 22
2
x y x y xy
=
+
−
−
+
275Then the safety factor defined by (Masson, 2009) is used : 276
13 [39]
4
ff1 fFS
=
277τf is the stress tangential to the fracture surface (kN/m2) and τff1 is the stress tangential to the fracture surface when 278
the fracture occurs (kN/m2). The knowledge of the Mohr’s circle radius R and the distance P between the center of 279
the circle and the origin enable calculation of these two parameters. 280
Stresses (σf ; τf ) are obtained by drawing a line perpendicular to the Coulomb line which cuts the center of the 281
Mohr’s circle. Then, the fracture shear stress τff1 is calculated with a normal stress of σf (figure10). 282
With Φconcrete and cconcrete being the internal angle of friction and the cohesion of concrete: 283
[40]
f=
R
cos
concrete 284[41]
f= −
P R
sin
concrete285
[42]
ff1=
f*tan
concrete+
c
concrete286
Masson (2009) also proposes a second safety factor FS4’ defined as the Rf2/R ratio 287
With : 288
Rf2 : distance between the center of the Mohr’s circle and the Coulomb line 289 [43] 2 1 3 *cos *sin 4' 2
f concrete concrete concrete
R c P FS R
+ = = − 2903.5.Hydrographs determination
291The calculation of the safety factors defined in the previous sections in each step of the dam failure allows 292
determination of the failure scenario and the corresponding hydrograph for different conditions of overtopping. 293
The corresponding hydrograph is then compared to the hydrograph obtained by using the standard procedure. 294
295
3.5.1. Standard procedure’s hydrograph
296
The standard procedure specifies 30 minutes long failure scenario with a breach of trapezoidal cross section 297
having 45 degrees banks and a bottom width of four times the maximal height of the dam. The standard 298
14
procedure’s hydrograph is obtained by calculating the breach discharge at each time step of 30 s, considering a 299
linear volume/elevation law and the evacuation law of a broad-crested trapezoidal weir (Marche, 2008): 300 301 [44]
Q
b=
c k
v s1,7
b h
1(
−
h
b)
1.51 , 26
+
z h
(
−
h
b)
2.5
302 Where 303cv : correction coefficient of the approach velocity (m0.5.s-1)
304
ks : correction coefficient of the overtopping (-)
305
b1 : instantaneous width of the bottom of the breach (m)
306
ht : instantaneous water level downstream (m)
307
h : water level upstream (m) 308
hb : bottom of the breach level (m) :
309
z : breach walls slope (-) 310 [45] 3 1 27.8( ) if 0.67 1 if not t b t b s b b s h h h h k h h h h k − − = − − − = ¨ 311 312
3.5.2. Hydrograph from the safety factors methodology
313
The iterative procedure described in the figure 13 allows the identification of the failure scenario via the 314
calculations of the different safety factors and by taking into account changes of the dam geometry (Hsoil is the 315
height of the materials behind the mask and Hmask the height of the mask, these parameters are used in the 316
calculation of the safety factors) . The methodology of the procedure is based on the following principles: 317
• The initial dam geometry and hydraulic conditions are defined for the first iteration 318
• At each iteration, the safety factors are calculated 319
1. FS1 : if FS1 is less than 1, the dam fails and the procedure ends. 320
15
2. FS2 and FS3 : less than 1 values of this safety factors lead to a new geometry of the dam and 321
potential loss of the fractured part of the upstream slope protection if the crest is lower than the 322
top of the mask 323
3. FS4 : if FS4 is less than 1, a fracture occurs in the mask 324
325
4. Application of the methodology
326
The flood scenario used to demonstrate our methodology is a gradual increase of the water level in the reservoir. 327
The flood discharge is the MPF discharge (5630 m3/s) and this discharge remains constant during the failure (the 328
hypothesis of a changing discharge would not modify the methodology but would add a calculation step in order 329
to take into account the variations in discharge). In our example scenario, we consider the spillway capacity to be 330
reduced from 2400 m3/s to 1000 m3/s. With a flood discharge of 5630 m3/s and a spillway discharge of 1000 m3/s, 331
the reservoir is filled with a discharge of Qr = 4630 m3/s. 332
In the case of a gradual increase of the water level in the reservoir, at t=0 the water level reaches the maximum 333
level of operation, Hop = 74.9 meters. When the overtopping reaches 1.7 m over the crest (about 40 h after the 334
beginning of the flood), the downstream slope protection fails, from the crest to the bottom. Nevertheless, the 335
mask and the parapet stay static. The seepage discharges are assumed to be negligible compared to the flood 336
discharge and consequently the water level still rises. The next critical overtopping level, 2.15 m, which occurs 337
6h20 after the slope protection has failed (which is the time needed for the water level to reach a 2.15 m 338
overtopping in this conditions of discharge for a linear volume/elevation relation of the reservoir), leads to the 339
failure of the parapet. 340
The failure of the parapet on the whole length of the dam instantly releases a 2.50 m high overtopping flow 341
corresponding to a discharge Ql of 3180 m3/s. The filling of the reservoir continues with a discharge of Qr-Ql = 342
1450 m3/s. The effect of this discharge is considered to have no impact on the water level during the failures of 343
the downstream face and the crest which are quick mechanisms (similar to landslides). When the first fragment of 344
the upstream concrete slope protection is gone, this releases a 6.75 m high overtopping. The safety factor linked to 345
16
the motion of the crest materials decreases, less than 1 (0.65). The dam failure goes faster as the failure 346
mechanisms build up. 347
The failure hydrograph starts when the parapet breaks, about 46 h after the beginning of the rising of the water 348
level in the reservoir. The discharge at t=0 starts at 3180 m3/s. It suddenly reaches 17 700 m3/s when the first 349
piece of the mask is taken away. It keeps increasing per stage each time another piece of the mask disappears. 350
Considering that the failure mechanisms involved are fast (as landslides), the hypothesis of a 10 min long failure 351
is taken here, with a linear increase of the discharge until the dam has totally disappeared. The drawdown is then 352
calculated with the spillway formula. 353
The corresponding failure hydrograph is compared to the standard procedure hydrograph. 354
355
5. Discussion
356
5.1.Comparaison with the standard procedure
357
This section compares the standard procedure of dam breach used in Quebec, Canada, to our methodology 358
described in this paper, by describing the physical mechanisms involved in the dam failure. In the case of dam 359
overtopping, the standard procedure assumes a failure by erosion which starts with the dam overtopping. The 360
breach develops in 30 min and its final bottom width reaches 4 times the maximal dam height. For earth dams 361
during overtopping, this well describes the failure scenario. The failure indeed begins in the low point of the crest 362
almost as soon as the overtopping occurs (depending on the materials) and the flow energy is then responsible for 363
the formation and development of the breach. 364
The methodology described in this article leads to a different conclusion for a rockfill dam with an upstream 365
concrete slope protection. A minimal overtopping level of several meters is necessary for the failure to occur, 366
because of the concrete protection. In addition, the failure no longer begins in the low point, but can concern the 367
whole width of the dam, which leads to a maximum discharge higher than calculated with the standard’s 368
hypothesis. Moreover, this maximum discharge is also reached faster because the mechanisms involved are faster 369
than erosion mechanisms. 370
17 371
5.2.Comparison with literature results
372
When the whole theoretical process of failure can’t be described yet, laboratory tests results gave several 373
conclusions regarding the final geometry of the breach and the failure duration (Franca and Almeida, 2002). 374
These experimental studies used a Froud Number similarity to take into account the scale effect. Some of the 375
results defend the hypothesis and conclusions of the present paper and some others qualify them. Concerning the 376
initial width breach, the experiments conclude on a large initial breach, contrary to the earthfill initial breaches, of 377
about 1 times the dam height. In our methodology, the assumption of a large initial breach has also been made, 378
but on the whole width of the dam, as a pessimist hypothesis. 379
The total failure time observed in the models was about 450 and 1200 s, which correspond to time between 1 and 380
2 hour and a half for a 25 m high dam. This total failure time of the dam is one of the most important parameters 381
in the model and also the most difficult to adjust. While experimental models (Franca and Almeida, 2002) 382
conclude on a total time failure of more than an hour, some historical data from rockfill dam failure due to 383
overtopping only give total time failure of less than 30 min (Goose Greek dam, (Sing ans Scarlatos, 1988)). For 384
the hypothesis of the model presented in this paper, the total time failure has been taken equal to 10 minutes. This 385
choice has been based on the minimum time observed in historical data (less than 30 minutes) and by considering 386
the parapet in the Toulnustouc dam. This parapet induces indeed an initial level of water much higher than in a 387
parapet-free dam and consequently the hydraulic conditions are worse. 388
389
5.3.
Limitations of the methodology
390
It is obvious from the historical data, experimental results and theoretical calculation that the failure of rockfill 391
dams isn’t well understood. Actual models usually don’t take into account all the details of rockfill dam breaches 392
and previous studies estimate the uncertainty of about 50% in the estimate of the maximum discharge with the 393
actual models (CADAM, 2000). The model of our methodology allows considering more details and phenomenon 394
of the dam breach but some aspects could be improved. 395
18
Further verifications could be necessary in order to confirm the validity of some formulas. These formulas are 396
used here in conditions which can be different from the conditions for which they have been validated. For 397
example the Wilkins formula is a 1D formula and is used here in a 2D application. 398
Hypothesis about the breach width and total time failure had to be made and are based partially on experimental 399
and historical data. Improvements such as investigations on the initial width of the breach linked to the initial 400
water level, rock sizes or the downstream dam slope would complete the analysis of the dam failure. 401
Finally, sensitivity analysis of the safety factors in our methodology was conducted with the following 402
conclusions: When changing the values of the parameters (such as the drag force coefficient, the prorosity etc.), 403
the calculation of the critical overflow level leading to the failure of the dam gives different results, but the orders 404
of magnitude remains the same, as for the overall failure scenarios. Consequently, the unavoidable 405
approximations of some parameters doesn’t question the validity of the results. 406
407 408
6. Conclusion
409
The methodologies we present in this article permit the consideration of several failure mechanisms, but these 410
mechanisms can also be linked to obtain a failure scenario which takes into account all of them. It also leads to 411
the determination of a failure hydrograph, depending on the scenario for the rising water level. 412
In addition, it highlights the role of the impermeable upstream concrete slope protection which allows using an 413
embankment with large voids (associated with large rock sizes) and is resistant to the effects of overtopping, wind 414
and rain. The effect of the upstream concrete slope protection is that it inhibits the seepage rate through the dam. 415
On another hand, the framework minimizes the size of the splits in the slope protection and the importance of the 416
seepage. 417
This study tends to question the applicability of the standard procedures for assessing dam failures to rockfill 418
dams with upstream concrete slope protection. Due to the erosional resistance characteristics of the materials, the 419
overtopping scenario does not necessarily lead to the failure of the dam, but can also lead to more hazardous 420
19
scenario and more important consequences than predicted by the standard procedure, as much higher peak flow 421
rate and shorter time-to- The results are validated by the solidity of the formula and concepts used to develop it, 422
the consistency of the results and the physical analysis of the earth and rockfill dam’s failures. 423
424
The methodology could be extended to other rockfill dams with upstream concrete slope protection and crest 425
structures such as parapets, to confirm the conclusions of the article and add precisions on the total failure time 426
and initial failure width parameters. Laboratory experiments could also be realized in order to include the 427
influence of pre-failure overtopping duration in this methodology. The confirmation of the conclusions of this 428
article would highlight the need to reconsider safety measures in case of overtopping of embankment dam with an 429
upstream concrete slope protection. 430
431
Références
432
André Bazergui, Bui-Quoc Thang, & André Biron. (2002). Résistance des matériaux (3e éd): Montréal : Presses 433
internationales Polytechnique. 434
Beauséjour, N., Bouzaïene, H., Hammamji, Y., Bigras, A., & Bergeron, A. (2006). Conception du barrage et de 435
la digue sud de l'aménagement hydroélectrique de la Toulnustouc. Paper presented at the Congrès annuel 436
2006 de l’ACB. 437
Bennis, S. (2007). Hydraulique et hydrologie. Presses de l'Université du Québec. 2ème édition, 476 pp. 438
CADAM : Concerted Action on Dambreach Modelling (2000), Final report, January 439
Devenda mehta, & Hawley, M. C. (1969). Wall effect in packed columns. Ind. Eng. Chem. Process Design and 440
Development, 8 (2), pp 280–282 441
Ergun, S. (1952). Flow of water through packed columns. Chemical Engineering Progress, 48(2). 442
Etienne Guyon, & Hulin, H.-P. (2001). Hydrodynamique physique: EDP Sciences. 443
20
Franca, M.J. and Almeida, A.B. (2002), Experimental Tests on Rockfill Dam breaching Process. IAHR - 444
International Symposium on Hydraulic and Hydrological Aspects and Safety ssessment of Hydraulic 445
Structures, St. Petersburg, May 446
Hansen, D., Garga, V. K., & Townsend, D. R. (1995). Selection and application of a one-dimensional non-Darcy 447
flow equation for two-dimensional flow through rockfill embankments. Canadian Geotechical Journal, 448
32, 223-232. 449
Lafleur, J. (1991). Introduction à la géotechnique: Presses internationales Polytechnique. 450
Lancellota, R. (2009). Geotechnical Engineering (2e éd): Taylor & Francis Group. 451
Marche, C. (2008). Barrages, crues de rupture et protection civile: Presses Internationales Polytechnique. 452
Martins, R. (1990). Turbulent seepage flow through rockfill structures. Water Powr and Dam Construction, 453
March, 90, 41-45. 454
Masson, L. (2009). Évaluation du gain de sécurité relié au réhaussement d'une digue munie d'un élément 455
d'Étanchéité rigide. École Polytechnique de Montréal, Montréal. 456
Mc Corquodale, J. A., Hannoura, A. A., & Nasser, M. S. (1978). Hydraulic conductivity of rockfill. Journal of 457
Hydraulic Research, 16(2), 123-137. 458
Singh, V.P. and Scarlatos, P.D. (1988). Analysis of Gradual Earth-Dam Failure., Journal of Hydraulic 459
Engineering., ASCE 114(1), 21-42. 460
Stephenson, D. (Ed.). (1979). Rockfill in hydraulic engineering. Amsterdam, Netherlands. 461
U.S. Army Corps of Engineers. (1995). Gravity Dam Design (Vol. EM 1110-2-2200). Honolulu: University Press 462
of Pacific. 463
Wilkins, J. K. (1956). Flow of water through rockfill and its application to the design of dams. Paper presented at 464
the New-Zealand Conference on Soil Mechanics and Foundation Engineering. 465
466 467 468
21
Figures list
469
Fig.1. Cross section of the Toulustouc dam (Beauséjour, et al., 2006) 470
Fig.2. Cross section of the Toulnustouc dam crest (Beauséjour, et al., 2006) 471
Fig.3. Crest seepage calculation 472
Fig.4. Illustration of the "Multiple Wedge Analysis" method (US Army Corps of Engineers, 1995) 473
Figure 5_ Multiple Wedge Analysis (US Army Corps of Ingineers, 1995) 474
Fig.6. Forces affecting the blocks 475
Fig 7. Flow through rockfill experiments (Ottawa) 476
Fig.8. Stresses on the parapet 477
Fig.9. Stresses on the upstream mask 478
Fig.10. Distribution of normal stresses 479
Fig.11. Distribution of shear stress 480
Fig.12. Mohr-Coulomb failure criteria and safety factor FS4 et FS4’ 481
Fig.13. Failure scenario calculation process 482
Fig.14. Comparison of the hydrographs from the norm application and from the methodology 483
484 485 486
22 487
Fig.1. Cross section of the Toulustouc dam (Beauséjour, et al., 2006) 488
489
Fig.2. Cross section of the Toulnustouc dam crest (Beauséjour, et al., 2006) 490
491
Fig.3. Crest seepage calculation 492
23 493
Fig.4. Illustration of the "Multiple Wedge Analysis" method (US Army Corps of Engineers, 1995) 494
495
Figure 5_ Multiple Wedge Analysis (US Army Corps of Ingineers, 1995) 496
24 497
Fig.6. Forces affecting the blocks 498
25 499
500
Fig 7. Flow through rockfill experiments (Ottawa) 501
26 502
Fig.8. Stresses on the parapet 503
504
505
Fig.9. Stresses on the upstream mask 506
27 507
Fig.10. Distribution of normal stresses 508
509
Fig.11. Distribution of shear stress 510
28 511
Fig.12. Mohr-Coulomb failure criteria and safety factor FS4 et FS4’ 512
29 513
Fig.13. Failure scenario calculation process 514
30 515
Fig.14. Comparison of the hydrographs from the norm application and from the methodology 516
517 518