HAL Id: hal-02569531
https://hal.archives-ouvertes.fr/hal-02569531
Submitted on 11 May 2020HAL is a multi-disciplinary open access archive for the deposit and dissemination of sci-entific research documents, whether they are pub-lished or not. The documents may come from teaching and research institutions in France or abroad, or from public or private research centers.
L’archive ouverte pluridisciplinaire HAL, est destinée au dépôt et à la diffusion de documents scientifiques de niveau recherche, publiés ou non, émanant des établissements d’enseignement et de recherche français ou étrangers, des laboratoires publics ou privés.
Original Layered OP4-(Li,Na) x CoO 2 Phase: Insights
on Its Structure, Electronic Structure, and Dynamics
from Solid State NMR
Yohan Biecher, Danielle Smiley, Marie Guignard, François Fauth, Romain
Berthelot, Claude Delmas, Gillian Goward, Dany Carlier
To cite this version:
Yohan Biecher, Danielle Smiley, Marie Guignard, François Fauth, Romain Berthelot, et al.. Original Layered OP4-(Li,Na) x CoO 2 Phase: Insights on Its Structure, Electronic Structure, and Dynamics from Solid State NMR. Inorganic Chemistry, American Chemical Society, 2020, 59 (8), pp.5339-5349. �10.1021/acs.inorgchem.9b03417�. �hal-02569531�
1
On the original layered OP4-(Li,Na)
x
CoO
2
phase :
insights on its structure, electronic structure and
dynamics from solid state NMR
Yohan Biechera, Danielle L. Smileyb, Marie Guignarda, François Fauthc, Romain Berthelotd,e,
Claude Delmasa, Gillian R. Gowardb, Dany Carliera,e,*
aCNRS, Univ. Bordeaux, Bordeaux INP, ICMCB UMR 5026, F-33600 Pessac, France bDepartment of Chemistry & Chemical Biology, McMaster University, Hamilton, Ontario L8S
4M1, Canada
cCELLS - ALBA synchrotron, Cerdanyola del Vallès, E-08290 Barcelona, Spain
dCNRS, Univ. Montpellier, ICGM UMR 5253, F-34095 Montpellier, France ICGM, Université
de Montpellier, CNRS, 34095 Montpellier, France
eRéseau sur le Stockage Electrochimique de l’Énergie (RS2E), CNRS, 80039 Amiens, France
2
Abstract: The OP4-(Li/Na)xCoO2 phase is an unusual lamellar oxide with a 1:1 alternation
between Li and Na interslab spaces. In order to probe the local structure, electronic structure and dynamics, 7Li and 23Na magic angle spinning nuclear magnetic resonance (MAS NMR) spectroscopy were performed in complementarity to X-ray diffraction and electronic and magnetic properties measurements. 7Li MAS NMR showed that NMR shifts result from two contributions: the Fermi contact and the Knight shifts due to the presence of both localized and delocalized electrons that is really unusual. 7Li MAS NMR clearly shows several Li environments indicating that, moreover, Co ions with different local electronic structures are formed, probably due to the arrangement of the Na+ ions in the next cationic layer. 23Na MAS NMR showed that some Na+ ions are located in the Li layer what was not previously considered in the structural model. The Rietveld refinement of the synchrotron XRD led to the OP4-[Li0.42Na0.05]Na0.32CoO2 formula for the
material. In addition, 7Li and 23Na MAS NMR provide information about the cationic mobility in the material: whereas no exchange is observed for 7Li up to 450K, the 23Na spectra reveals already a single average signal at room temperature due to much larger ionic mobility.
3
1. Introduction
The layered structure of AxMO2 (A = alkaline ion, M = transition metal ion) phases is at the origin
of a wide range of peculiar properties, such as electrochemical energy storage in Li-ion or Na-ion batteries1,2, thermoelectric properties3,4, superconductivity5–7. These lamellar oxides consist of a
stacking of edge-sharing MO6 octahedra layers forming MO2 slabs between which alkali A+ ions
are intercalated. Delmas et al. introduced in 1980 a specific nomenclature composed by a letter and a number indicating, respectively, the alkaline site geometry and the number of layers necessary to describe the structure in the hexagonal cell8. Indeed, different types of interstitial sites are reported in the literature depending on the nature of the alkali ion A+, its concentration x and the synthesis
conditions9: Octahedral (for example O3-LiCoO210), Tetrahedral11 or Prismatic (for example
P2-NaxCoO2 or P3-NaxCoO212).
In this paper, we were interested in a unique (Li/Na) mixed lamellar oxide with Na and Li layers alternating along the c axis, first reported in 1994 by Balsys and Davis13. As this material was initially synthetized from the layered O3-LiCoO2 and P2-Na0.7CoO2 phases as precursors with a
1:1 molar ratio, the Li0.5Na0.35CoO2 ideal formula would have been expected. However, the LiCoO2
is present as product from such a stoichiometric mixture of precursors. Actually, a Li0.43Na0.36CoO1.96 phase composition was deduced from a Rietveld refinement of the neutron
diffraction data13. The structure of the phase is formed by edge-sharing CoO6 octahedra layers with
interslab spaces alternatively occupied by Na+ and Li+ ions, as shown in Figure 1. The alkali ions keep the intercalation site symmetry of the precursors, i.e. octahedral and trigonal prismatic for the lithium and sodium ions respectively, thus forming an OP4 stacking. Note that there are two prismatic intercalation sites for Na+ ions, one sharing the faces (Naf) and the other sharing the edges
O3-4 LiCoO2 and P2-Na0.7CoO2 as precursors for their synthesis, Balsys and Davis indicated the
difficulty to obtain a pure phase.
Figure 1: a) Perspective representation of the OP4-(Li/Na)CoO2 phase and b) local Li and Na
environments : Li+ ions occupy octahedral sites sharing edges with CoO
6 and the Na+ ions occupy
prismatic sites which can either share faces (Naf) or edges (Nae) with CoO6 octahedra.
Additional publications propose the synthesis of this phase without any consensus concerning the best precursors or thermal treatment to obtain the purest phase15–21. Table in SI-1 summarizes the chemical compositions and cell parameters reported in the literature for the OP4 phase. All the
Li O Co
O
Co
Na
eO
Co
Na
fb)
a)
5 proposed chemical formulas differ from the ideal Li0.5Na0.35CoO2 one, but the presence of traces
of O3-LiCoO2 and P2-Na0.7CoO2 as impurities may alter the composition determined by
Inductively Coupled Plasma (ICP) measurements17. Some of us, for the first time, studied the formation of the OP4-(Li,Na)xCoO2 phase by in situ variable temperature X-Ray Diffraction
(XRD): the phase is formed at around 855°C but decomposes back into O3-LiCoO2 and
P2-Na0.7CoO2 if slowly cooled18. Since the layered OP4 phase is really original in solid-state chemistry
and might exhibit peculiar properties, especially because of a different occupation ratio of the alkaline layers, we decided to investigate further its structure, electronic structure and alkaline ions dynamics, using Magic Angle Spinning Nuclear Magnetic Resonance (MAS NMR) spectroscopy as a local probe.
Indeed, 7Li MAS NMR has been shown to be a powerful probe to characterize both the structural and electronic local environments in paramagnetic materials22. The latter can be deduced from the MAS NMR studies thanks to the hyperfine interactions (electron spin-nucleus spin coupling). In paramagnetic compounds, as in the case of most of the positive electrode materials, the spectra are dominated by the Fermi contact interactions, leading to the following shift:
𝛿𝐹𝑒𝑟𝑚𝑖𝑖 (𝑇) = 1
3𝑆𝑁𝐴𝜌
𝑖(0)𝜒
𝑀(𝑇) eq. (1)
where S is the spin quantum number of the paramagnetic ion, ρi(0) is the spin density on the i nucleus and χ𝑀 the molar magnetic susceptibility (at the temperature of the NMR measurement). The interpretation of the Fermi contact shift interactions can be supported by DFT calculations with the aim to assign the different signals23–31 and understand the spin transfer mechanisms
reflecting the local electronic structure23,29–31. In metallic compounds, the spectra are dominated by the Knight shift:
6 𝛿𝐾𝑛𝑖𝑔ℎ𝑡 = 8𝜋
3 〈|𝜓𝑟=0|²〉𝜒𝑠
𝑒 eq. (2)
where 𝜒𝑠𝑒 is the Pauli susceptibility of conduction bands electrons at Fermi level and 〈|𝜓
𝑟=0|²〉 is
the contribution of “s” orbitals at Fermi level of probed nucleus.
In addition, solid state NMR can be also used to probe the alkaline ions mobility in electrode materials (exchange spectroscopy32–34, variable-temperature33 (VT), rotational-echo double-resonance35 or selective inversion36 for instance).
In this paper, we report a 7Li and 23Na MAS NMR study of several OP4 phases to investigate the
local structure, electronic structure and the dynamics in complementarity to X-Ray Diffraction (XRD) and electronic/magnetic properties measurements.
2. Experimental
Synthesis
The syntheses were performed using either alkaline carbonates and Co3O4, or O3-LiCoO2 and
P2-𝑁𝑎~0.7CoO2 as precursors. As less impurities were observed by XRD with the first set of
precursors, we report here only syntheses carried on using Li2CO3 (Sigma-Aldrich, 99.9%, dried
at 350°C), Na2CO3 (Sigma Aldrich, 99.9%, dried at 200°C) and Co3O4 (home-made from cobalt
nitrate, heat treated under air at 450°C). Those precursors were initially mixed and ground together in an Ar-filled glovebox targeting 1g of OP4 phase. Slightly different chemical compositions around Li0.42Na0.38CoO218 were used in order to compensate possible alkaline ion loss by
7 Their initial compositions are summarized in Table 1. The powders were then pressed into pellets in a controlled argon atmosphere and the pellets were heated in a furnace under air at 870 °C for 48 h with a 2°C/min heating rate. After the heat treatment, all the pellets were rapidly quenched to room temperature and entered in the Ar-filled glovebox again.
Initial alkaline content for a LixNayCoO2 composition
x y
Sample C 0.42 0.40
Sample B 0.42 0.41
Sample A 0.44 0.38
Table 1: Initial alkaline compositions in the precursors mixture of the three selected OP4 samples
labelled: A, B and C.
Characterizations
SEM : Scanning electron microscopy images were taken using a Hitachi S-4500 microscope.
SEM pictures show primary particles with a typical hexagonal shape with around 3 µm in diameter and 0.5 µm in thickness (Figure S2) for the synthetized compounds.
8
XRD: Angular resolution synchrotron X-Ray powder diffraction (SXRPD) experiments were
performed at room temperature on the BL04-MSPD beamline of the ALBA synchrotron (Cerdanyola del Vallès, Spain) for the sample A only. The data were collected in a 2° to 73° 2θ range at a wavelength of λ = 0.8261 Å. The sample A was enclosed in a 0.5 mm-diameter sealed glass capillary. The laboratory XRD characterization of the samples B and C was performed at room temperature on a PANalytical X’Pert Pro with a X’Celerator detector and equipped with Co 𝐾𝛼1,2 radiations. The radiations were generated at 35 kV and 30 mA (λ(𝐾𝛼1) = 1.789 Å and λ(𝐾𝛼2) = 1.793 Å). The measurements were performed between 10° and 80°. The profile refinements and structure refinements using the Rietveld method were realized with the software FullProf developed by J. Rodriguez-Carvajal37.
1D Solid-State NMR: The samples A, B and C were introduced in 2.5 mm zirconia rotors inside
a glovebox. 7Li MAS NMR spectra were acquired using a Bruker Avance (7.05 T magnet) spectrometer at 116.6 MHz and a Bruker Avance III spectrometer with a 2.35 T magnet at 38.9 MHz using a standard Bruker 2.5 MAS probe at a 30 kHz spinning frequency. A Hahn echo sequence was applied with a 90° pulse of 1.1 µs and 2 µs respectively on the 7.05 T and 2.35 T magnets. Recycle delay of 5 s was long enough to avoid T1 saturation effects and all the shifts are referred to a 1M LiCl (aq) solution. 23Na MAS NMR was performed on a Bruker Avance spectrometer at 79.4 MHz (7.05 T magnet) and 132.3 MHz (11.75 T magnet). As 23Na is a strong
quadrupolar nucleus with I = 3/2, a short pulse length of 1 µs corresponding to a π/8 pulse determined using an aqueous 1 M NaCl solution was employed. In these conditions, the main signal observed is due to the -½ +½ central transition. The spectral width was set to 1 MHz, and the recycle time D0 = 0.5 s, is long enough to avoid T1 saturation effects. The baseline distortions
9 resulting from the spectrometer dead time (8 µs) were computationally removed using a polynomial baseline correction routine with the software DMFit38. DMFit was used for all the fitting processes.
7Li and 23Na variable temperature 1D NMR experiments were carried out on a Bruker 300 Avance
spectrometer in the 265 K - 450 K range using a Bruker 4 mm WVT MAS probe. A spinning frequency of 13 kHz was used. The temperature calibration was realized using lead nitrate39,40. Along the rotor a temperature gradient up to 5K can be observed also 80% of the sample was observed at the desired temperature ± 1K.
Selective inversion 7Li MAS NMR: Only the sample B was analyzed with this technique. For the
selective inversion 7Li MAS NMR experiments, a probe for 1.3 mm-diameter zirconia rotors (spinning frequency = 65 kHz) was used on a Bruker 300 Avance spectrometer with a Larmor frequency of 116.6 MHz. 90° pulse length was set at 3 µs and recycle time at 5 s. For all acquisitions, mixing times (𝜏mix) were set from 0.05 ms to 6 s. Selective inversion consists of a
succession of two pulses separated by a mixing time, 180°- 𝜏mix-90°. The 180° pulse is a soft power
Gaussian shaped pulse (40 dB) with a length of 900 µs in order to probe one selected site. The phase sensitive detection in T1 was achieved through the use of States-TPPI. 1 M LiCl was used as standard (0 ppm).
Magnetic measurements: The molar magnetic susceptibility versus temperature was extracted
from magnetization measurements as a function of the temperature from 7 K to 300 K using a constant field of 1 T with Super Quantum Interference Device (SQUID) magnetometer MPMS5. Only the sample A was analyzed and was cooled without any application of magnetic field (Zero Field Cooling).
10
Conductivity measurements: Transport properties were measured on cold-pressed pellets, the
compactness of which was close to 70%. Electrical DC conductivity measurements were performed with the aligned four-probe method in the 4.2-300 K range using a home-made equipment.
3. Results and Discussion
Despite reproducing the synthesis many times with slightly different alkaline initial compositions, a real pure OP4 phase could not be obtained since, as discussed below, traces of impurity phases were always observed by XRD. Among all the prepared samples, we selected for the discussion in this paper, three of them, representative of all the resulting powders.
XRD characterization of the samples
Figure 2 shows the XRD patterns of the three samples as a function of the d spacing in Å, as all
the XRD patterns were not recorded at the same wavelength. The insert represents the most intense diffraction line, (004) at d = 5.1 Å. The three samples exhibit, in addition to the diffraction lines expected for the OP4 phase, extra peaks indicating the presence of one or two phases as impurities : O3-LiCoO2 is present as traces in Sample A as seen on the zoom of Figure 2 by the presence of
its (003) diffraction line at 4.7 Å ; P2-𝑁𝑎~0.7CoO2 and OPP9-(Li/Na/Na)CoO2 phases18, are present
as traces in Sample B as seen on the zoom by the presence of the (002) peak of P2 at 5.4 Å and (009) peak of OPP9 at 5.2 Å; OPP9 is only present as traces in Sample C (Figure 2). All these structures are represented on Figure S3. Our quenching procedure was fast enough to avoid the OP4 phase decomposition in O3-LiCoO2 and P2-𝑁𝑎~0.7CoO2 observed previously18, since these
two phases are not simultaneously observed. The XRD patterns of all the phases were refined using the Le Bail method to extract the cell parameters as summarized in Table 2. The refined lattice
11 parameters of the OP4 phase, ahex. ~ 2.824(2) Å and chex. ~ 20.28(1) Å, are in good agreement with
the values ranges reported in the literature (Figure S1). The refined cell parameters of the O3-LiCoO2, P2-𝑁𝑎~0.7CoO2 and OPP9-(Li/Na/Na)CoO2 impurities phases are also in agreement with
the literature10,14,18. The structural Rietveld refinement of the SXRD data for sample A will be discussed only at the end of the paper. Indeed, the NMR characterization, discussed below, will provide new structural information.
12
Figure 2: Experimental XRD patterns of the samples A, B and C plotted as a function of the d
spacing. Insert: Zoom in the 5.75 Å- 4.50 Å region in order to focus on the impurities peaks. * are the Al peaks due to the sample holder used for the XRD acquisitions.
Sample A Sample B Sample C OP4 (P63/mmc) ahex 2.826(1) Å 2.826(3) Å 2.822(1) Å chex 20.29(3) Å 20.28(3) Å 20.28(2) Å O3 (R𝟑̅c) ahex 2.81(2) Å - - chex 14.08(8) Å P2 (P63/mmc) ahex - 2.838(3) Å - chex 10.92(1) Å OPP9 (R𝟑̅m) ahex - 2.835(3) Å 2.837(2) Å chex 46.7(2) Å 46.1(2) Å
Table 2: Refined lattice parameters of the different phases reported in the samples A, B and C
13 The 1D 7Li MAS NMR spectra of the three samples are shown in Figure 3. They all exhibit 5
signals located after fitting at 32, 18, 0, -84 and -203 ppm and respectively labelled 1 to 5 on Figure
3a. Such wide peak shifts distribution and shifts values are characteristics if the presence of several
Li paramagnetic environments as expected from the Li0.42Na0.38CoO2 stoichiometry, with formally
0.2 LS-Co4+ (t2g5) paramagnetic ions. The local environment of the Li+ ions in the lattice is shown
in Figure 1b: Li is surrounded by 6 Co ions through 180° Co-O-Li interaction and 6 Co ions through 90°Co-O-Li interaction, similarly to the Li environment in stoichiometric O3-LiCoO2. In
the later compound Li is only surrounded by LS-Co3+ with the diamagnetic t2g6eg0 electronic
configuration. A single signal ~ 0 ppm is therefore observed by 7Li MAS NMR10,41–44. As the OP4 phase exhibits several 7Li signals, this indicates that Co ions with different local electronic structures are present around Li, probably due to the arrangement of the Na+/vacancy in the next
cationic layer. Only signal 3 can be assigned to Li+ ions in diamagnetic LS-Co3+ environment. The spectra were also recorded at different magnetic field strengths (2.35 T and 7.05 T) to confirm the number of peaks and the origin of the lineshape (Figure 3b). While higher magnetic fields are useful for reducing the broadening due to both, nuclear-nuclear dipolar interactions and quadrupolar interactions, the associate increase in broadening due to stronger electron-nuclear dipolar interactions results in rather similar final line widths and resolution. However, since the same 30 kHz spinning frequency was used in both experiments, the spectra recorded at 2.35 T exhibit less spinning side bands and therefore more intensity in the isotropic positions. The advantage is clearly seen for the negatively shifted signal that exhibits a wider spinning side bands distribution that the others. Moreover, at low 2.35 T field, a weak signal labeled “5” can be clearly observed at -203 ppm and was located under a spinning side band using the 7.05 T magnet. After fitting the spectra (Figure 3c), the resulting signal intensities (including the spinning side bands) have been extracted and summarized in Table 3. Signal 5 was not considered because of its very
14 low intensity. The intensity values obtained for the signal 2 are similar for all the samples and are therefore not affected by the nature of the impurities in the samples. Contrary to Signal 2, Signal 3’s intensity is slightly more intense for Sample A in agreement with the presence of O3-LiCoO2
15
Figure 3: (a) Experimental 7Li MAS NMR spectra for the samples A, B and C (2.35 T magnet, 𝜈𝑅
= 30 kHz, Hahn echo sequence). (b) Comparison of the 7Li MAS NMR spectra recorded for the sample C at two different magnetic fields (2.35 and 7.05 T) using the same spinning frequency (30 kHz). (c) Fits of the signals 1, 2, 3 and 4 compared to the experimental spectra for Sample C (with no Li-phase as impurity). * represents the spinning side bands.
Signal 1 (32 ppm) Signal 2 (18 ppm) Signal 3 (0 ppm) Signal 4 (-84 ppm) Sample C 47% 19% 12% 22% Sample B 52% 18% 11% 19% Sample A 41% 19% 18% 22%
Table 3: Repartition of the fitted areas of each 7Li signal for the three studied samples. The
signal 5 was neglected here because of its low intensity.
Variable temperature MAS NMR experiments (Figure 4) using a 13 kHz spinning frequency in a 265 K ≤ T ≤ 450 K temperature range were performed initially in order to investigate the possibility of Li site exchange, but actually provided really interesting information about the nature of the NMR shifts observed for the OP4 phase. No exchange phenomenon was observed in this 265 K ≤ T ≤ 450 K temperature range and the spectrum at 300 K was fully recovered after the experiment. Note that at 450 K, one can also distinguish a new component labelled 3’. The variation of the signals position reveals the complexity of the origin of the shifts. The position of Fermi contact shifted signals, in paramagnetic compounds, are expected to follow the same trend as does the magnetic susceptibility (equation 1), i.e, varies as 1/(T-) and tends to diamagnetic chemical range (near 0 ppm for Li) as T tends to +∞. For the OP4 phase, this is not the case; especially the position of the signal 2 remains almost temperature independent, also confirmed by higher resolution
16 experiments performed at 30 kHz (Figure S4). The evolution of the shifts position versus temperature is plotted in Figure 5a.
Figure 4: Experimental 7Li MAS NMR spectra performed on the sample B on a 7.05 T magnet at different temperatures in the 265 K – 450 K. The NMR sequence was a Hahn echo sequence and the spinning frequency was 13 kHz.
17
Figure 5: (a) Fitted lines of NMR shifts evolution of the signals 1, 2 and 3 as a function of the
temperature. (b) Magnetic susceptibility and inverse magnetic susceptibility of the sample A (insert) as a function of the temperature (6 K to 300 K). (c) Electrical conductivity of the sample A as a function of the temperature (6K to 300 K).
18 In order to better understand the temperature evolution of the signals, the magnetic susceptibility (Figure 5b) and the electrical conductivity (Figure 5c) of the OP4 phase were also studied. The fit of the experimental magnetic measurements was realized taking into account a paramagnetic contribution, following a Curie-Weiss law and a temperature independent term 𝜒0 (𝑡ℎ𝑢𝑠 𝜒(𝑇) = 𝑪
𝑻−𝜽𝒑+ 𝜒0). The fitted values are C = 0.134 emu.K.mol
-1, 𝜃
𝑝 = -38.7 K and 𝜒0 =
1.30*10-5 emu.mol-1. The C value is relatively high compared to theoretical one (C
th = 0.05
emu.K.mol-1) by considering the Li0.42Na0.38CoO2 formula with 0.2 LS-CoIV and 0.8 LS-CoIII. This
difference indicates that the material doesn’t completely follow a Curie-Weiss law and a part of the susceptibility can be due to delocalized electrons. The evolution of the electrical conductivity (Figure 5c) denotes a semi-conductor behavior probably due to inter particles boundaries resistivity. Ren et al.15 reported similar data as well as Seebeck coefficient measurements that
showed that the OP4 phase should exhibit a metallic conductivity in the (a, b) plane relatively similar to the P2-NaxCoO245,46 and O3-LixCoO244phases. Our VT-MAS NMR results are further
confirming the dual character of the OP4 phase that exhibits delocalized electrons and localized ones. Indeed, the temperature evolution of the 7Li MAS NMR shifts can be interpreted considering that the shifts result from two interactions: the Fermi contact interaction (for localized electrons), that is temperature dependent, and the Knight shift contribution (for delocalized electrons) that is temperature independent. The total shift for a i nucleus can be expressed by:
𝛿𝑡𝑜𝑡𝑖 (𝑇) = 𝛿
𝐹𝑒𝑟𝑚𝑖𝑖 (𝑇) + 𝛿𝐾𝑛𝑖𝑔ℎ𝑡𝑖 eq. (3)
By fitting the evolution of the signals position versus T (Figure 5a), the 7Li MAS NMR shifts tends toward a rather similar Knight shift contribution for all the signals to ~ 16 ppm for T +∞ (Table
19 and can be, indeed, attributed to a Knight shift component. The Fermi contact coupling constant incorporated in a constant labelled B for this paper (B = 𝐶
3𝑆𝑁𝐴𝜌
𝑖(0)), is found to be either positive
or negative depending on the signals (Figure 5a). A positive contribution is excepted for a 90° LS-CoIV-O-Li interaction (delocalization mechanism) while a negative shift is expected for a 180°
LS-CoIV-O-Li interaction similarly to the case of Li(CoIII1-yCrIIIy)O2 phases30,48. Note that no
comparison with the shift obtained for the LixCoO2 samples was possible, since in this system, it
was concluded that the formation of localized Co4+ ions at the beginning of the deintercalation
leads to a loss of observation of adjacent Li+ and then an insulator to metallic transition occurs and leads to the observation of a single Knight shift located around 60 ppm44.
Signal 1
(32 ppm)
Signal 2
(18 ppm)
Signal 3
(0 ppm)
B (ppm.K)
2400 ± 500
-270 ± 150
-3700 ± 500
θ
p(K)
115 ± 20
200 ± 30
120 ± 15
𝜹
𝑲𝒏𝒊𝒈𝒉𝒕(ppm)
16 ± 1
16 ± 1
16 ± 1
Table 4: Calculated values for B, 𝜃 and 𝛿𝐾𝑛𝑖𝑔ℎ𝑡 after the fitting of the curves showed on Figure 5a.
Density Functional Theory (DFT) calculations can be used to assign the Fermi contact signals and better understand the local electronic structure27,29–31. Unfortunately, neither Generalized Gradient Approximation (GGA) nor GGA+U allow a correct description of the electronic structure of such
20 layered cobalt oxides. In GGA, the inherent self-interaction error has a detrimental effect on localized transition-metal d orbitals. Although, the addition of a Hubbard U correction can produce theoretical average voltages or Fermi contact shifts in better agreement with experiments48, this method is not used in this study because it has been shown to yield some unphysical results for layered cobalt oxide systems: phase stability inversion between O1 and O3 in CoO2 and incorrect
phase diagram for the P2-NaxCoO2 system49. On the contrary, GGA has been successfully used to
describe the phase diagram of the LixCoO2 system50 and the metallic conduction44. Even if the
electronic structure could not be properly described using DFT, our results considering a Li0.5Na1/3CoO2 [Li24Na16Co48O96 supercell] model compound with a full Li layer as in O3-LiCoO2
and the Na+/vacancy ordering reported by Platova et al.51 for P2-Na2/3CoO2, are given in Figure
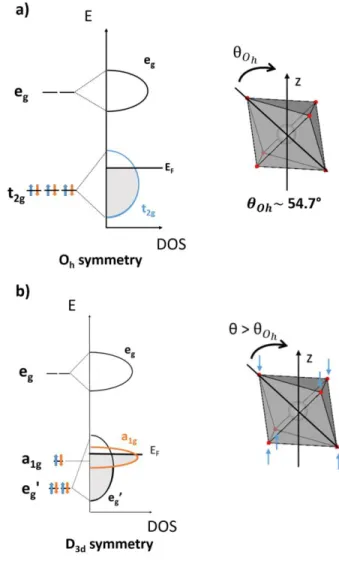
S5.1. Our calculations indicate that the t2g Co orbitals degeneracy is lifted because of the CoO6
distortion along the c axis leading to a1g and eg’ orbitals7. The 3D spin density map shows that the
a1g orbital is mainly carrying the electron spins (Figure S5.3c). Nevertheless, the eg’ orbitals
involving the t2g ones that overlap through the middle of the CoO6 common edge of the octahedra
should be responsible for the delocalized behavior in the (a,b) plane while electrons in the a1g
oriented along c should be mostly responsible for the localized character. The schematic band structures for TM ion in Oh symmetry and D3d symmetry when the octahedra are distorted along
the c axis, are shown on Figure 6 and highlights the presence of the localized electrons and the delocalized electrons. The Fermi contact shift calculations indicate that considering a specific Na ordering in the sodium layer, tends to partially localize the charges on the Co ions and leads to slightly different Li electronic environments and several Li calculated shifts. Even if a complete signal assignment could not be proposed here, we demonstrated that NMR can be successfully used to investigate the local electronic structure of materials, in particular, here, it provides information about the complex electronic structure of layered cobaltates with some localized and delocalized
21 electrons and the presence of Co ions with different local electronic structures around Li ions, probably due to the arrangement of the Na+ ions in the next cationic layer.
Figure 6: Schematic representation of the band structure of the Co ions in layered alkali cobaltates
(a) without and (b) with considering the octahedra distortion perpendicular to the CoO2 layers. The
inserts correspond to the CoO6 octahedron in each case. The 𝜃 angle represent the angle between
the z axis parallel to the chex parameter and a Co-O bond direction. For a regular octahedral =
54.7°, whereas ~ 61.2° in the OP4 phase.
According to our VT- MAS NMR experiments (Figure 4 and S4), no evidence for Li+ mobility was observed up to 450 K. However, by using selective inversion experiments, one can investigate possible lithium ions motion at different timescales36. This sequence introduces a mixing time,
22 which allows a magnetization exchange between the different Li sites. The advantage of this technique is the fact that many data points can be collected compared to other 2D NMR techniques allowing modeling efficiently the relaxation of the magnetization back to equilibrium. Selective inversion is also a good technique in order to calculate the rate constants of the different Li+ sites if ionic mobility is observed. By processing at different temperatures, the activation energies can also be determined. This technique proposes to initially invert selectively one Li signal using the Gaussian shaped soft pulse. The mixing times allow then the magnetization to return to equilibrium. During the different mixing times (and T1 relaxation), chemical exchanges between the inverted and the none-inverted Li signals are possible if Li+ ions are able to hop from one site to the other. The consequence on the NMR spectra is a buildup of magnetization due to the potential chemical exchanges and the T1 relaxation for the inverted/probed signal. For the non-inverted signals, an attenuation of their intensities characterizes an ionic mobility in the structure due to the chemical exchange with the inverted signal. Figure 7 shows the selective inversion spectra with the different mixing times recorded on the sample B at 340 K. Only the inversions on the signal 1 are shown in this paper. The signal 2 shows a slight modification of its intensity with the mixing time evolution. That could be due to the weak separation between the probed signals 1 and the signal 2, in fact, it is probably slightly affected by the soft pulse applied on the signal 1. By probing the other signals, no dynamics involving hopping rates higher than the frequency gap between signals (typically ~1500 Hz) is observed (Figure S6). This result is the same whatever the temperature in the RT – 330 K range Thus, no Li+ ions mobility can be highlighted by dynamic MAS NMR in the timescale that was probed. No dynamics is observed faster than 6 s involving full or almost full Li layers. The occupancy of the Li layers will be discussed with Rietveld refinement of the structure of the sample A using the SXRD data.
23
Figure 7: Experimental 7Li MAS NMR spectra of the sample B with the selective Inversion (SI) technique performed at 340 K with mixing times from 0.05 ms to 6 s. The signal 1 was selectively inverted on this Figure. The acquisitions were realized on a 7.05 T magnet with a spinning frequency of 65 kHz.
Local structure, electronic structure and dynamics from 23Na NMR
Figure 8a shows the 23Na MAS NMR spectra recorded for the three (Li,Na)CoO
2 compounds
under a 11.75 T magnetic field. The local prismatic environments of Na in the OP4 phase are shown in Figure 1b. Considering their large values, the 23Na NMR shifts are mainly due to the hyperfine interactions between Co unpaired electrons and Na nuclei spin53. We recorded the spectra under
24 different magnetic field strengths (7.05 T and 11.75 T) (Figure 8b): the 11.75 T magnetic field strongly decreases the 2nd order quadrupolar broadening, but does not allow to suppress it. It, however, allows getting a rather good resolution and to distinguish several contributions for Na in the structure. In sample A, which does not exhibit any impurities containing Na ions (no P2 nor OPP9 phases) two signals are observed around 300 and 200 ppm. Both signals could be further fitted using a 2nd quadrupolar lineshape (Figure 8c and Table 5). The main signal (signal 2 in
Figure 8) corresponds to an average signal for the Na+ ions in the Nae and Naf sites in the Na layers
due to high ionic mobility of Na+ ions at the NMR time scale as already observed for P2-NaxCoO252, P2-Na2/3Co2/3Mn1/3O253, P2-NaxFe1/2Mn1/2O254 and P2-Nax[LiyNizMn1-y-z]O228. The
high Na+ mobility in P2-type of structure was also evidence in P2-Na1/2VO2 above 325K, as the
V-V trimers are suppressed55. In Figure 8, the second less intense signal observed for the OP4 phase
(signal 1), then denotes the presence of Na+ ions that would not take part to this exchange, therefore most probably not in the interslab space. We argue that this signal might correspond to the presence of some Na+ ions in the Li layers, therefore in octahedral site (Figure 1). The larger shift observed for this signal could results from the shorter Co-O-Na distances that would induce stronger hyperfine interaction. This new structural hypothesis will be taken into account for the Rietveld refinement of the synchrotron XRD pattern below. Note that samples B and C exhibit the same two signals (signal 1 and signal 2 in Figure 8), but also an additional one located around 360-380 ppm, whose position correspond to Na in 𝑁𝑎~0.7CoO252 and can be assigned to Na+ in
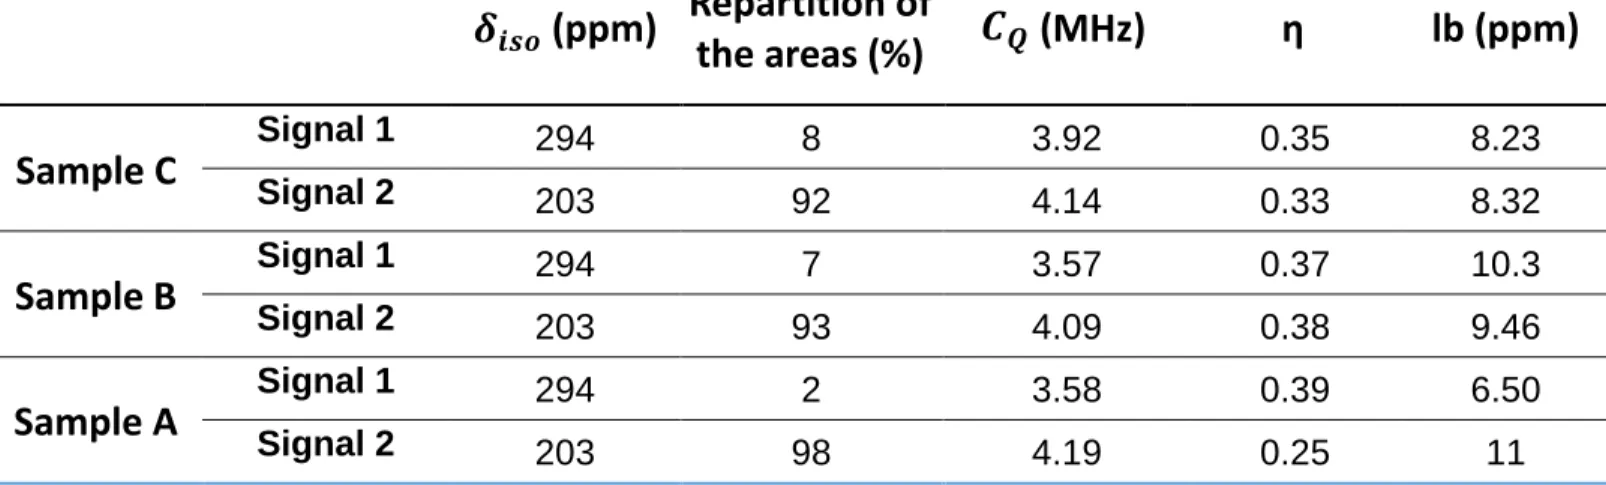
25 Figure 8: (a) Experimental 23Na MAS NMR spectrum of the three studied samples with performed on a 11.75 T magnet at a spinning frequency of 30 kHz. (b) Comparison of the 23Na MAS NMR spectra recorded of the sample A for two different magnetic fields (7.05 T and 11.75 T). (c) Fits of the signals 1 and 2 recorded by NMR on sample A compared to the experimental spectra. 2nd order quadrupolar lineshapes were used to fit the spectrum and the corresponding parameters are provided in Table 5. * Represent the spinning side bands.
26
𝜹
𝒊𝒔𝒐(ppm)
Repartition of
the areas (%)
𝑪
𝑸(MHz)
η
lb (ppm)
Sample C
Signal 1 294 8 3.92 0.35 8.23 Signal 2 203 92 4.14 0.33 8.32Sample B
Signal 1 294 7 3.57 0.37 10.3 Signal 2 203 93 4.09 0.38 9.46Sample A
Signal 1 294 2 3.58 0.39 6.50 Signal 2 203 98 4.19 0.25 11Table 5: Repartition of the areas of the two signals highlighted on the 23Na MAS NMR spectra for Na+ ions for the three studied samples and NMR parameters for each signal calculated with the DMFit software38. The signals around 370 ppm on the samples B and C spectra are not considered because they are due to Na impurities. For each parameter, the last number falls into the error bar. 𝛿iso (ppm) = the isotropic
position ; CQ (MHz) = the quadrupolar coupling constant; η = the assymetry parameter of the
quadrupolar interaction tensor and lb (ppm) = broadening factor.
23Na MAS NMR variable temperature experiments were also performed with a spinning frequency
of 13 kHz between 265 and 450 K (Figure 9a). Note that using a 13 kHz spinning frequency and a 7.05 T magnetic field, the resolution was not sufficient to follow the change of the signal 1. In
Figure 9b and S7, the evolution versus T of the fitted parameters using a 2nd order quadrupolar
lineshape are provided for signal 2. As temperature increases, a decrease of the shift values is observed as expected for paramagnetic shifts. However, in the case of 23Na MAS NMR, contrary to 7Li, one cannot neglect the quadrupolar shift contribution to the total shift in addition to the Fermi contact and the Knight shifts. The analysis of the isotropic shift position versus the temperature is therefore more complex than for 7Li. The temperature increase, also results in a
sharpening of the signal that exhibits at 450 K a well-defined 2nd order line shape. This signal modification can be interpreted by i) an increase of the Na+ ions motion in the interslab spaces that
27 is not fully achieved at room temperature compared to the NMR timescale and ii) a decrease of the dipolar part of the nuclear–electron spin coupling as also observed for the P2-NaxCoO252.
According the our previous VT-23Na NMR study of P2 and P3-NaxCoO2 polymorphs, the increase
of Na+ ions mobility is rather due to an increase of the hopping rate between Na sites in the interslab space than to an increase of movement/vibration of the Na+ ion around its average position52. It also appears that the quadrupolar interaction increases as the temperature increases, that may be linked with the change of the interslab distances modification upon heating that was not studied here.
28 Figure 9: a) VT-23Na MAS NMR recorded on a 7.05 T magnet at a spinning frequency of 13 kHz in the 265 K < T < 450K range. * are the spinning side bands. Note that a diamagnetic impurity is also seen around 0 ppm. b) Evolution of the some of the fitted parameters using a 2nd order
quadrupolar lineshape. iso = isotropic position (ppm); CQ = quadrupolar coupling (MHz). All fitted
values are provided in Figure S7.
[ppm] 400 200 0 [ppm] 400 200 0 T = 265 K T = 300 K T = 350 K T = 400 K T = 450 K
*
*
*
*
*
*
*
*
*
*
23Na VT-MAS NMR
1 2a)
b)
250 300 350 400 450 140 150 160 170 180 190 200 210 220 iso (ppm) T (K) 4.08 4.12 4.16 4.20 4.24 4.28 CQ (MHz )29
Average structure from synchrotron XRD Rietveld refinement
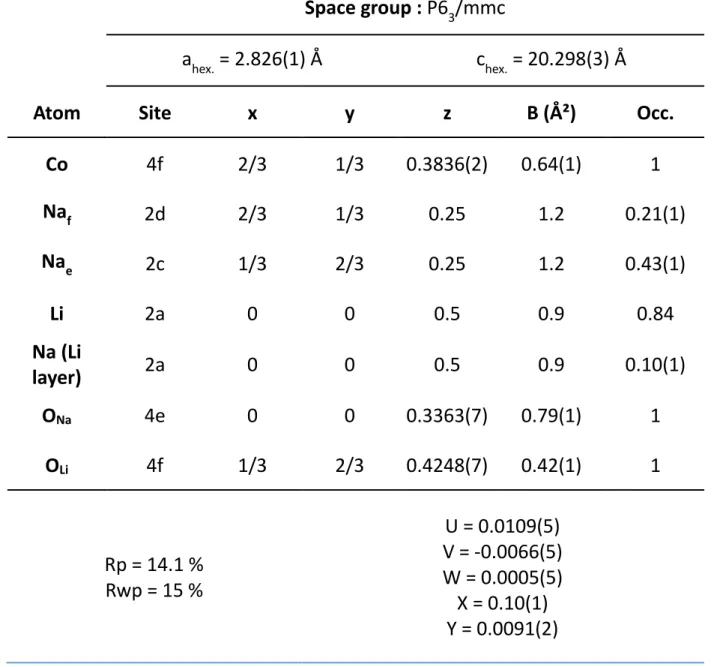
Our 23Na MAS NMR study indicates that some Na+ ions might be located in the Li layers in the OP4 phase. Such a possibility was therefore further considered in the structural model refined by the Rietveld method using the SXRD data. A good agreement between the calculated pattern and the experimental one can be thus achieved (Figure 10). The resulting fitted parameters are given in Table 6. Note that the refinement allows determining that the sample A is composed of 3 % of LiCoO2 and 97 % of the OP4 phase. Considering the low amount of the O3 phase, inductively
coupled plasma atomic emission spectrometry (ICP-AES) measurements led in that case a relative good agreement between the target and experimental Li/Co and Na/Co ratios (0.42(1) and 0.37(1) respectively) in good agreement with our previous study18. The slight peak asymmetry (insert on
Figure 10) suggests the presence of a low amount of stacking faults in the structure as suggested
by Berthelot et al.18. For the refinement, we fixed the Co, O and Li stoichiometry respectively to 1, 2 and 0.42. Therefore, only the occupancies of the Na sites were refined considering the possibility of having Na+ ions in the Li site. As a result, we found 0.05(1) Na+ in the O-type
interslabs of the OP4 phase leading to a global occupation of ~ 95 % of the Li layers. The P-type interslabs exhibit more vacancies, since they are filled at 64(1) % by Na+ ions. The resulting chemical formula is therefore Li0.42Na0.37CoO2, in good agreement with the target composition and
can be more specifically written as OP4-[Li0.42Na0.05]Na0.32CoO2 from our 23Na and SXRD data.
30
Figure 10: Synchrotron XRD pattern as a function of the 2𝜃 position of the sample A with λ =
0.8261 Å. Red bars and black bars correspond, respectively, to the Bragg positions of O3-LiCoO2 and OP4-(Li/Na)CoO2. Red points correspond to experimental XRD pattern while black line is the calculated one obtained by Rietveld refinement. The blue line is the difference between experimental and calculated lines.
31
Space group : P6
3/mmc
a
hex.= 2.826(1) Å
c
hex.= 20.298(3) Å
Atom
Site
x
y
z
B (Ų)
Occ.
Co
4f
2/3
1/3
0.3836(2)
0.64(1)
1
Na
f2d
2/3
1/3
0.25
1.2
0.21(1)
Na
e2c
1/3
2/3
0.25
1.2
0.43(1)
Li
2a
0
0
0.5
0.9
0.84
Na (Li
layer)
2a
0
0
0.5
0.9
0.10(1)
O
Na4e
0
0
0.3363(7)
0.79(1)
1
O
Li4f
1/3
2/3
0.4248(7)
0.42(1)
1
Rp = 14.1 %
Rwp = 15 %
U = 0.0109(5)
V = -0.0066(5)
W = 0.0005(5)
X = 0.10(1)
Y = 0.0091(2)
Table 6: Calculated parameters, atomic positions and occupancies obtained for the refined SXRD
data performed on the sample A (SXRD pattern on Figure 10) with the P63/mmc space group.
O(Na) represent the O ions between Na and Co layers while O(Li) are the O ions between Li and Co layers.
32
Figure 11: Bonds distances, in Å, calculated after Rietveld refinement of the OP4 phase.
Conclusion
The reinvestigation of the original OP4-LixNayCoO2 phase, by solid state NMR and synchrotron
XRD led to a better understanding of the material structure, electronic structure and dynamics. 7Li MAS NMR shows that the NMR shifts result from two contributions: the Fermi contact and the Knight shifts due to the presence of both localized and delocalized electrons. This is good agreement with the complex electronic structure expected for layered cobalates, as the t2g Co orbital
undergo a lift of degeneracy due to CoO6 octahedra distortion perpendicular to the layer (D3d
symmetry). 7Li MAS NMR clearly shows several Li environments indicating that, moreover, Co ions with different local electronic structures are formed, probably due to the arrangement of the Na+ ions in the next cationic layer. Unfortunately, those materials are really difficult to model properly using DFT calculations and no complete signal assignment could be proposed. 23Na MAS
33 NMR shows that some Na+ ions are located in the Li layer that was not previously considered. It
helped to reconsider the structural model used for the Rietveld refinement of the synchrotron XRD. This refinement led to the OP4-[Li0.42Na0.05]Na0.32CoO2 formula for the material. In addition, 7Li
and 23Na MAS NMR provide information about the cationic mobility in the material. Up to 450 K no exchange has been observed for Li+ ions at the NMR times scale whereas at room temperature, the 23Na spectra reveals already a single average signal for Na ions in the prismatic sites (P layer)
due to much larger ionic mobility. The lowest Li+ ionic mobility compared to Na can be explained by different factors: i) a higher activation energy involved in the diffusion for the O-type layer, as the Li+ has to go through a tetrahedral site to jump from an octahedra site to the adjacent one, whereas Na+ can directly jump from the Nae prismatic site to the Naf one through a rectangular
window. ii) a low amount of vacancies (~ 6 %) in the Li O-type layers compared to vacancies in the P-type layer (~ 36%) and the presence of additional Na (~ 5%) in the Li layer.
Supporting Information
S1: Comparison of the crystallographic data for the different OP4 phases reported in literature. S2: SEM pictures of the sample A at different magnifications. S3: Representation of the different phases reported in this paper. S4: Experimental 7Li MAS NMR spectra performed on a 7.05 T magnet with a spinning frequency of 30 kHz for 250 K, 300 K and 320 K. S5 : DFT calculation performed on a model Li0.5Na1/3CoO2 cell : comparison between experimental NMR spectra and calculated ones,
total and partial calculated spin DOS and 3D spin density map. S6: Experimental 7Li SI spectra performed at 340 K with different mixing times. S7: Fitted parameters of the 23Na MAS NMR
34 The following files are available free of charge.
Corresponding author
*Email: [email protected]
Notes
The authors declare no competing financial interest.
Acknowledgments
This work beneficiates from financial support from the Fond Franco-Canadien pour la Recherche (FFCR). ALBA synchrotron is acknowledged for granting beamtime through proposal no 2017092426. We are also grateful to Mathieu Duttine for his technical support. The Mésocentre de Calcul Intensif Aquitain (MCIA) and the modelling center of ISM are acknowledged for computing facilities.
35
References
(1) Hong, S. Y.; Kim, Y.; Park, Y.; Choi, A.; Choi, N.-S.; Lee, K. T. Charge Carriers in Rechargeable Batteries: Na Ions vs. Li Ions. Energy Environ. Sci. 2013, 6 (7), 2067.
(2) Kubota, K.; Komaba, S. Practical Issues and Future Perspective for Na-Ion Batteries. J. Electrochem. Soc. 2015, 162 (14), A2538–A2550.
(3) Lee, M.; Viciu, L.; Li, L.; Wang, Y.; Foo, M. L.; Watauchi, S.; Pascal Jr, R. A.; Cava, R. J.; Ong, N. P. Large Enhancement of the Thermopower in NaxCoO2 at High Na Doping. Nat. Mater. 2006, 5 (7), 537–540.
(4) Lee, M.; Viciu, L.; Li, L.; Wang, Y.; Foo, M. L.; Watauchi, S.; Pascal, R. A.; Cava, R. J.; Ong, N. P. Enhancement of the Thermopower in NaxCoO2 in the Large-X Regime (x>0.75). Phys. B Condens. Matter 2008, 403 (5–9), 1564–1568.
(5) Takada, K.; Sakurai, H.; Takayama-Muromachi, E.; Izumi, F.; Dilanian, R. A.; Sasaki, T. Superconductivity in Two-Dimensional CoO2 Layers. Nature 2003, 422 (6927), 53–54.
(6) Takada, K.; Fukuda, K.; Osada, M.; Nakai, I.; Izumi, F.; Dilanian, R. A.; Kato, K.; Takata, M.; Sakurai, H.; Takayama-Muromachi, E.; et al. Chemical Composition and Crystal Structure of
Superconducting Sodium Cobalt Oxide Bilayer-Hydrate Electronic. J. Mater. Chem. 2004, 14 (9), 1448.
(7) Landron, S.; Soret, J.; Lepetit, M.-B. An Ab Initio Evaluation of the Local Effective Interactions in the NaxCoO2 Family. J. Phys. Condens. Matter 2010, 22, 1–8.
(8) Delmas, C.; Fouassier, C.; Hagenmuller, P. Structural Classification and Properties of the Layered Oxides. Phys. B C 1980, 99 (1–4), 81–85.
(9) Lei, Y.; Li, X.; Liu, L.; Ceder, G. Synthesis and Stoichiometry of Different Layered Sodium Cobalt Oxides. Chem. Mater. 2014, 26 (18), 5288–5296.
(10) Levasseur, S.; Menetrier, M.; Suard, E.; Delmas, C. Evidence for Structural Defects in
Non-Stoichiometric HT-LiCoO2: Electrochemical, Electronic Properties and 7Li NMR Studies. Solid State Ion. 2000, 128 (1–4), 11–24.
(11) Carlier, D.; Croguennec, L.; Ceder, G.; Ménétrier, M.; Shao-Horn, Y.; Delmas, C. Structural Study of the T#2-Li
xCoO2 (0.52 < X ≤ 0.72) Phase. Inorg. Chem. 2004, 43 (3), 914–922.
(12) Braconnier, J.-J.; Delmas, C.; Fouassier, C.; Hagenmuller, P. Comportement Electrochimique Des Phases NaxCoO2. Mater. Res. Bull. 1980, 15 (12), 1797–1804.
(13) Balsys, R. J.; Davis, R. L. The Structure of Li0. 43Na0. 36CoO1. 96 Using Neutron Powder Diffraction. Solid State Ion. 1994, 69 (1), 69–74.
(14) Berthelot, R.; Carlier, D.; Delmas, C. Electrochemical Investigation of the P2–NaxCoO2 Phase Diagram. Nat. Mater. 2011, 10 (1), 74–80.
(15) Ren, Z.; Shen, J.; Jiang, S.; Chen, X.; Feng, C.; Xu, Z.; Cao, G. Enhanced Thermopower in an Intergrowth Cobalt Oxide Li 0.48Na0.35CoO2. J. Phys. Condens. Matter 2006, 18 (29), L379–L384. (16) Bos, J. W. G.; Hertz, J. T.; Morosan, E.; Cava, R. J. Magnetic and Thermoelectric Properties of
Layered LixNayCoO2. J. Solid State Chem. 2007, 180 (11), 3211–3217.
(17) Semenova, A.; Kellerman, D.; Baklanova, I.; Perelyaeva, L.; Vovkotrub, E. Raman Spectroscopy Study of Sodium–lithium Cobaltite. Chem. Phys. Lett. 2010, 491 (4–6), 169–171.
(18) Berthelot, R.; Pollet, M.; Carlier, D.; Delmas, C. Reinvestigation of the OP4-(Li/Na)CoO2 -Layered System and First Evidence of the (Li/Na/Na)CoO2 Phase with OPP9 Oxygen Stacking. Inorg. Chem.
2011, 50 (6), 2420–2430.
(19) Kellerman, D. G.; Zhuravlev, N. A.; Semenova, A. S.; Shein, I. R.; Kuznetsov, M. V. 23Na NMR in Binary Lithium-Sodium Cobaltite. Bull. Russ. Acad. Sci. Phys. 2011, 75 (8), 1157–1159.
36 (20) Mesilov, V. V.; Galakhov, V. R.; Semenova, A. S.; Kellerman, D. G.; Elokhina, L. V. X-Ray Spectra and Specific Features of the Structure of Lithium-Sodium Cobaltite LixNayCoO2. Phys. Solid State 2011, 53 (2), 271–275.
(21) Yabuuchi, N.; Kawamoto, Y.; Hara, R.; Ishigaki, T.; Hoshikawa, A.; Yonemura, M.; Kamiyama, T.; Komaba, S. A Comparative Study of LiCoO2 Polymorphs: Structural and Electrochemical Characterization of O2-, O3-, and O4-Type Phases. Inorg. Chem. 2013, 52 (15), 9131–9142. (22) Grey, C. P.; Dupré, N. NMR Studies of Cathode Materials for Lithium-Ion Rechargeable Batteries.
Chem. Rev. 2004, 104 (10), 4493–4512.
(23) Carlier, D.; Ménétrier, M.; Grey, C. P.; Delmas, C.; Ceder, G. Understanding the NMR Shifts in Paramagnetic Transition Metal Oxides Using Density Functional Theory Calculations. Phys. Rev. B 2003, 67 (17).
(24) Kim, J.; Middlemiss, D. S.; Chernova, N. A.; Zhu, B. Y. X.; Masquelier, C.; Grey, C. P. Linking Local Environments and Hyperfine Shifts: A Combined Experimental and Theoretical 31P and 7Li Solid-State NMR Study of Paramagnetic Fe(III) Phosphates. J. American Chem. Soc. 2010, 132 (47), 16825–16840.
(25) Mali, G.; Meden, A.; Dominko, R. 6LiMAS NMR Spectroscopy and First-Principles Calculations as a Combined Tool for the Investigation of Li2MnSiO4 Polymorphs. Chem. Commun. 2010, 46 (19), 3306–3308.
(26) Castets, A.; Carlier, D.; Zhang, Y.; Boucher, F.; Marx, N.; Croguennec, L.; Ménétrier, M.
Multinuclear NMR and DFT Calculations on the LiFe(PO4)OH and Fe(PO4)H2O Homeotypic Phases. J. Phys. Chem. C 2011, 115, 16234–16241.
(27) Zhang, Y.; Castets, A.; Carlier, D.; Ménétrier, M.; Boucher, F. Simulation of NMR Fermi Contact Shifts for Lithium Battery Materials: The Need for an Efficient Hybrid Functional Approach. J. Phys. Chem. C 2012, 116 (33), 17393–17402.
(28) Clément, R. J.; Xu, J.; Middlemiss, D. S.; Alvarado, J.; Ma, C.; Meng, Y. S.; Grey, C. P. Direct Evidence for High Na+ Mobility and High Voltage Structural Processes in P2-Na
x [LiyNizMn1−y−z]O2 (X, Y, Z ≤ 1) Cathodes from Solid-State NMR and DFT Calculations. J. Mater. Chem. A 2017, 5 (8), 4129–4143.
(29) Castets, A.; Carlier, D.; Zhang, Y.; Boucher, F.; Ménétrier, A DFT-Based Analysis of the NMR Fermi Contact Shifts in Tavorite-like LiMPO4·OH and MPO4·H2O (M = Fe, Mn, V). J. Phys. Chem. C 2012, 116 (34), 18002–18014.
(30) Bamine, T.; Boivin, E.; Boucher, F.; Messinger, R. J.; Salager, E.; Deschamps, M.; Masquelier, C.; Croguennec, L.; Ménétrier, M.; Carlier, D. Understanding Local Defects in Li-Ion Battery Electrodes through Combined DFT/NMR Studies: Application to LiVPO4F. J. Phys. Chem. C 2017, 121 (6), 3219–3227.
(31) Nguyen, L. H.; Sanz Camacho, P.; Broux, T.; Olchowka, J.; Masquelier, C.; Croguennec, L.; Carlier, D. Density Functional Theory-Assisted 31P and 23Na Magic-Angle Spinning Nuclear Magnetic Resonance Study of the Na3V2(PO4)2F3–Na3V2(PO4)2FO2 Solid Solution: Unraveling Its Local and Electronic Structures. Chem. Mater. 2019, 31 (23), 9759–9768.
(32) Cahill, L. S.; Chapman, R. P.; Kirby, C. W.; Goward, G. R. The Challenge of Paramagnetism in Two-Dimensional 6, 7Li Exchange NMR. Appl. Magn. Reson. 2007, 32 (4), 565–581.
(33) Davis, L. J. M.; Heinmaa, I.; Goward, G. R. Study of Lithium Dynamics in Monoclinic Li3Fe2(PO4)3 Using 6Li VT and 2D Exchange MAS NMR Spectroscopy. Chem. Mater. 2010, 22 (3), 769–775. (34) Cahill, L. S.; Chapman, R. P.; Britten, J. F.; Goward, G. R. 7Li NMR and Two-Dimensional Exchange
Study of Lithium Dynamics in Monoclinic Li3V2(PO4)3. J. Phys. Chem. B 2006, 110 (14), 7171–7177. (35) Cahill, L. S.; Kirby, C. W.; Goward, G. R. 6Li{31P} Rotational-Echo, Double-Resonance Studies of
37 (36) Smiley, D. L.; Davis, L. J. M.; Goward, G. R. An Improved Understanding of Li+ Hopping Pathways
and Rates in Li3Fe2(PO4)3 Using Selective Inversion 6Li NMR Spectroscopy. J. Phys. Chem. C 2013, 117 (46), 24181–24188.
(37) Rodríguez-Carvajal, J. Recent Advances in Magnetic Structure Determination by Neutron Powder Diffraction. Phys. B Condens. Matter 1993, 192 (1–2), 55–69.
(38) Massiot, D.; Fayon, F.; Capron, M.; King, I.; Le Calvé, S.; Alonso, B.; Durand, J.-O.; Bujoli, B.; Gan, Z.; Hoatson, G. Modelling One-and Two-Dimensional Solid-State NMR Spectra. Magn. Reson. Chem. 2002, 40 (1), 70–76.
(39) Bielecki, A.; Burum, D. P. Temperature Dependence of 207Pb MAS Spectra of Solid Lead Nitrate. An Accurate, Sensitive Thermometer for Variable-Temperature MAS. J. Magn. Reson. A 1995, 116 (2), 215–220.
(40) Takahashi, T.; Kawashima, H.; Sugisawa, H.; Baba, T. 207Pb Chemical Shift Thermometer at High Temperature for Magic Angle Spinning Experiments. Solid State Nucl. Magn. Reson. 1999, 15 (2), 119–123.
(41) Ganguly, P.; Ramaswamy, V.; Mulla, I. S.; Shinde, R. F.; Bakare, P. P.; Ganapathy, S.; Rajamohanan, P. R.; Prakash, N. V. K. Application of a Layered Triangular-Lattice Magnetic Model System to LiNiO2. Phys. Rev. B 1992, 46, 11595. https://doi.org/doi.org/10.1103/PhysRevB.46.11595. (42) Alcantara, R.; Lavela, P.; Tirado, J. L.; Zhecheva, E.; Stoyanova, R. SPES, 6Li MAS NMR, and Ni3+ EPR
Evidence for the Formation of Co2+-Containing Spinel Phases in LiCoO
2 Cycled Electrode Materials. J. Electroanal. Chem. 1998, 454 (1–2), 173–181.
(43) Peeters, M. P. J.; Van Bommel, M. J.; Neilen-ten Wolde, P. M. C.; Van Hal, H. A. M.; Keur, W. C.; Kentgens, A. P. M. A 6Li, 7Li and 59Co MAS NMR Study of Rock Salt Type Li
xCoO2 (0.48≤x≤1.05). Solid State Ion. 1998, 112 (1–2), 41–52. https://doi.org/doi.org/10.1016/S0167-2738(98)00213-6. (44) Ménétrier, M.; Saadoune, I.; Levasseur, S.; Delmas, C. The Insulator-Metal Transition upon Lithium
Deintercalation from LiCoO2: Electronic Properties and 7Li NMR Study. J. Mater. Chem. 1999, 9 (5), 1135–1140.
(45) Takahata, K.; Iguchi, Y.; Tanaka, D.; Itoh, T.; Terasaki, I. Low Thermal Conductivity of the Layered Oxide (Na,Ca)Co2O4: Another Example of a Phonon Glass and an Electron Crystal. Phys. Rev. B
2000, 61 (19), 12551.
(46) Motohashi, T.; Naujalis, E.; Ueda, R.; Isawa, K.; Karppinen, M.; Yamauchi, H. Simultaneously Enhanced Thermoelectric Power and Reduced Resistivity of NaxCo2O4 by Controlling Na Nonstoichiometry. Appl. Phys. Lett. 2001, 79 (10), 1480–1482.
(47) Pan, C.; Lee, Y. J.; Ammundsen, B.; Grey, C. P. 6Li MAS NMR Studies of the Local Structure and Electrochemical Properties of Cr-Doped Lithium Manganese and Lithium Cobalt Oxide Cathode Materials for Lithium-Ion Batteries. Chem. Mater. 2002, 14 (5), 2289–2299.
(48) Aykol, M.; Kim, S.; Wolverton, C. Van Der Waals Interactions in Layered Lithium Cobalt Oxides. J. Phys. Chem. C 2015, 119 (33), 19053–19058. https://doi.org/10.1021/acs.jpcc.5b06240.
(49) Hinuma, Y.; Meng, Y. S.; Ceder, G. Temperature-Concentration Phase Diagram of P2 NaxCoO2 from First-Principles Calculations. Phys. Rev. B 2008, 77 (22).
(50) Van der Ven, A.; Aydinol, M. K.; Ceder, G.; Kresse, G.; Hafner, J. First-Principles Investigation of Phase Stability in LixCoO2. Phys. Rev. B 1998, 58 (6), 2975–2987.
(51) Platova, T. A.; Mukhamedshin, I. R.; Alloul, H.; Dooglav, A. V.; Collin, G. Nuclear Quadrupole Resonance and X-Ray Investigation of the Structure of Na2/3CoO2. Phys. Rev. B 2009, 80 (22). (52) Carlier, D.; Blangero, M.; Ménétrier, M.; Pollet, M.; Doumerc, J.-P.; Delmas, C. Sodium Ion Mobility
in NaxCoO2 (0.6 < X < 0.75) Cobaltites Studied by 23Na MAS NMR. Inorg. Chem. 2009, 48 (15), 7018–7025.
38 (53) Carlier, D.; Cheng, J. H.; Berthelot, R.; Guignard, M.; Yoncheva, M.; Stoyanova, R.; Hwang, B. J.;
Delmas, C. The P2-Na2/3Co2/3Mn1/3O2 Phase: Structure, Physical Properties and Electrochemical Behavior as Positive Electrode in Sodium Battery. Dalton Trans. 2011, 40 (36), 9306.
(54) Singh, G.; Lopez Del Amo, J. M.; Galceran, M.; Perez-Villar, S.; Rojo, T. Structural Evolution during Sodium Deintercalation/intercalation in Na2/3[Fe1/2Mn1/2]O2. J. Mater. Chem. A 2015, 3 (13), 6954– 6961.
(55) Guignard, M.; Carlier, D.; Didier, C.; Suchomel, M.; Elkaïm, E.; Bordet, P.; Decourt, R.; Darriet, J.; Delmas, C. Vanadium Clustering/Declustering in P2–Na1/2VO2 Layered Oxide. Chem. Mater. 2014, 26 (4), 1538–1548.
39 For Table of Contents Only
The local structure, electronic structure and dynamics of the original OP4-(Li/Na)CoO2 phase were
studied by 7Li and 23Na MAS NMR. 7Li NMR showed that NMR shifts result from two contributions: the Fermi contact and the Knight shifts and indicate the presence of Co ions with different local electronic structures. 23Na NMR showed that some Na+ ions are located in the Li layer and that Na+ ions are more mobile than Li+ ones at RT.
7Li MAS NMR
OP4-(Li,Na)xCoO2
23Na MAS NMR