• Aucun résultat trouvé

Reduced white matter integrity in sibling pairs discordant for bipolar disorder.

N/A
N/A
Protected

Academic year: 2021

Partager "Reduced white matter integrity in sibling pairs discordant for bipolar disorder."

Copied!
18
0
0

Texte intégral

(1)

Reduced White Matter Integrity in Sibling Pairs Discordant for

Bipolar Disorder

Emma Sprooten, Ph.D., Margaret S. Brumbaugh, B.S., Emma E.M. Knowles, Ph.D., D. Reese McKay, Ph.D., John Lewis, Ph.D., Jennifer Barrett, B.A., Stefanie Landau, B.A., Lindsay Cyr, B.A., Peter Kochunov, Ph.D., Anderson M. Winkler, M.D., Godfrey D. Pearlson, M.D., and David C. Glahn, Ph.D.

Olin Neuropsychiatry Research Center, Institute of Living, Hartford Hospital, Hartford, Conn.; the Departments of Psychiatry and Neurobiology, Yale University School of Medicine, New Haven, Conn.; McConnell Brain Imaging Center, Montreal Neurological Institute, McGill University, Montreal, Canada; and the Maryland Psychiatric Research Center, Department of Psychiatry, University of Maryland School of Medicine, Baltimore

Abstract

Objective—Several lines of evidence indicate that white matter integrity is compromised in bipolar disorder, but the nature, extent, and biological causes remain elusive. To determine the extent to which white matter deficits in bipolar disorder are familial, the authors investigated white matter integrity in a large sample of bipolar patients, unaffected siblings, and healthy comparison subjects.

Method—The authors collected diffusion imaging data for 64 adult bipolar patients, 60 unaffected siblings (including 54 discordant sibling pairs), and 46 demographically matched comparison subjects. Fractional anisotropy was compared between the groups using voxel-wise tract-based spatial statistics and by extracting mean fractional anisotropy from 10 regions of interest. Additionally, intra-class correlation coefficients were calculated between the sibling pairs as an index of familiality.

Results—Widespread fractional anisotropy reductions in bipolar patients (>40,000 voxels) and more subtle reductions in their siblings, mainly restricted to the corpus callosum, posterior thalamic radiations, and left superior longitudinal fasciculus (>2,000 voxels) were observed. Similarly, region-of-interest analysis revealed significant reductions in most white matter regions in patients. In siblings, fractional anisotropy in the posterior thalamic radiation and the forceps was nominally reduced. Significant between-sibling correlations were found for mean fractional anisotropy across the tract-based spatial statistic skeleton, within significant clusters, and within nearly all regions of interest.

Conclusions—These findings emphasize the relevance of white matter to neuropathology and familiality of bipolar disorder and encourage further use of white matter integrity markers as endophenotypes in genetic studies.

Address correspondence to Dr. Sprooten (emma.sprooten@yale.edu).

NIH Public Access

Author Manuscript

Am J Psychiatry. Author manuscript; available in PMC 2014 August 01.

Published in final edited form as:

Am J Psychiatry. 2013 November 1; 170(11): 1317–1325. doi:10.1176/appi.ajp.2013.12111462.

NIH-PA Author Manuscript

NIH-PA Author Manuscript

(2)

Several lines of evidence implicate white matter abnormalities in the pathophysiology of bipolar disorder. Postmortem studies have shown reduced numbers of oligodendrocytes (1) and compromised myelin (2). Additionally, decreased expression of myelin and glia-related genes have been reported in patients (3). Using non-diffusion MRI, reduced white matter volume and density have been observed for global and regional measures, particularly in the corpus callosum, internal capsule, and temporal lobes (4). However, these methods are suboptimal for identifying white matter pathology. In contrast, diffusion tensor imaging quantifies fractional anisotropy, which, although nonspecific to any particular underlying cellular pathology, is a sensitive marker of general white matter integrity as observed in model organisms (5) and humans (6). While reduced fractional anisotropy is repeatedly reported in bipolar disorder (4, 7), the precise locations of these deficits tend not to replicate across studies, possibly reflecting limited sample sizes and clinical heterogeneity. Moreover, the nature of white matter pathology in bipolar disorder is unknown. Anisotropy reductions could result from genetic liability for the disorder or be associated with manifestation of the illness or its treatment. The present study was designed to disentangle these potential explanations by investigating anisotropy in a large sample of individuals with bipolar disorder, their unaffected siblings, and unrelated comparison subjects.

As traits that lie intermediate between the action of risk genes and clinical diagnosis, endophenotypes enhance our understanding of biological mechanisms underlying disease. To qualify as an endophenotype, a measure must be heritable, altered in the clinical

population, state independent, and altered in unaffected relatives (8). White matter integrity, as indexed by fractional anisotropy, is heritable (9, 10), and diffusion tensor imaging studies have revealed suggestive evidence of white matter integrity reductions in unaffected relatives (11, 12). Versace et al. (13) demonstrated age-by-group interactions in the unaffected teenage offspring of bipolar probands. Mahon et al. (14) reported reduced fractional anisotropy in the right temporal lobe of 15 unaffected relatives. In a larger sample, Sprooten et al. (15) found widespread reductions in the relatives of bipolar probands. However, this sample did not include a patient group for direct comparison, and unaffected relatives were young, leaving the possibility that individuals yet to develop the illness drove the effects.

As etiologically informed measures, endophenotypes often highlight sources of clinical heterogeneity within diagnostic categories. A potentially important source of clinical heterogeneity in bipolar disorder is the presence of psychotic symptoms, as implied by differences between psychotic and nonpsychotic patients in D2 dopamine receptor density (16), neuroanatomy (17), functional connectivity (18), and neurocognitive functioning (19). These differences could point to unique genetic components that are specific to psychotic bipolar disorder, and they may have implications for psychiatric nosology and treatment efficacy.

In the present study, we examined fractional anisotropy in individuals with bipolar disorder and their unaffected siblings who were past the typical onset age of the illness. Reductions in siblings and intraclass correlations between sibling pairs were interpreted as familial contributions to reductions in the patients, whereas correlations with duration of illness and symptom severity indicated illness-specific mechanisms. Furthermore, associations of white

NIH-PA Author Manuscript

NIH-PA Author Manuscript

(3)

matter integrity with history of psychotic symptoms were investigated to inform the homogeneity of fractional anisotropy against a clinically heterogeneous background.

Method

Participants

Participants provided informed consent and the study was approved by the institutional review boards at Hartford Hospital and Yale University. Overall, 64 remitted patients with bipolar I disorder, 60 full siblings without bipolar disorder, and 46 demographically matched healthy individuals participated (Table 1). Patients were identified through outpatient clinics and community mental health facilities in the Hartford area. Inclusion criteria for patients were age between 18 and 70 years, diagnosis of bipolar I disorder as determined by the Structured Clinical Interview for DSM-IV (SCID) (20), and at least one full sibling without bipolar disorder willing to participate in the study. Siblings were included if they were within 10 years of the age of the bipolar proband and did not have a diagnosis of bipolar spectrum disorder. To increase ecological validity of the sample, sibling pairs were not excluded for anxiety disorders, a single episode of major depression, or past substance abuse or dependence. Unrelated healthy comparison subjects were included if they had no lifetime history of axis I psychiatric disorder as assessed by the SCID and no family history of mood or psychotic disorders. Participants were excluded for alcohol or drug abuse or dependence within the past 6 months, a history of major medical or neurological disorders, or IQ <70 as assessed by the WAIS (21). In patients, euthymia was established with the Hamilton Depression Rating Scale (HAM-D) (22), the Young Mania Rating Scale (23), the Brief Psychiatric Rating Scale (BPRS) (24), and through diagnostic case reviews. Severity of lifetime history of psychosis was assessed with the Lifetime Dimensions of Psychosis Scale (25), a carefully validated dimensional system for rating longitudinal features of affective and psychotic symptoms.

Scan Acquisition

Scans were collected at the Olin Neuropsychiatry Research Center Institute of Living using a Siemens Allegra 3-T scanner. Diffusion-weighted MR images were acquired using single-shot echo planar imaging (TR=6,300 ms, TE=81 ms, field of view= 22×22 cm,

matrix=128×128, and voxel size=1.7×1.7×3.0 mm) with a twice-refocusing spin echo sequence to minimize eddy-current induced distortion. Diffusion-weighted volumes were acquired in 55 noncollinear gradient directions at two diffusion weighting values (b=0 and b=800 seconds/mm2), preceded by three non-diffusion-weighted (b=0) images. Each acquisition lasted 6.2 minutes and contained 58 volumes, with 45 contiguous interleaved axial slices per volume (slice thickness, 3 mm) covering the whole brain.

Image Preprocessing

Data were converted to NIFTI format using MRIcron and preprocessed using standard FMRIB’s Software Library tools (http://fsl.fmrib.ox.ac.uk/fsl/fslwiki/FDT). Images were corrected for subject motion and eddy currents by aligning the diffusion-weighted volumes to each subject’s first b0-volume. FMRIB’s Software Library brain extraction tool was applied to remove nonbrain tissue. Next, diffusion eigenvectors, eigenvalues, and fractional

NIH-PA Author Manuscript

NIH-PA Author Manuscript

(4)

anisotropy were calculated. The resulting maps were visually inspected. Three scans (one bipolar patient, one sibling, and one comparison subject) were excluded because of signal dropout, and four individuals (two bipolar patients and two comparison subjects) were excluded for hyperintensities.

Tract-Based Spatial Statistics

The 170 fractional anisotropy maps were processed according to the standard pipeline (26). Briefly, images were eroded and linearly and nonlinearly registered to standard space. Fractional anisotropy images were binarized (>0) and combined to create a study-specific mask containing only voxels present in every image. Maps were masked, averaged, and “thinned,” and the threshold was set at >0.2 to create a study-specific skeleton template. In each individual, the maximum voxel nearby each voxel in the skeleton template was projected onto this template using a distance map, which ensures that the same voxel is only projected onto the skeleton once and that the likelihood of a voxel being projected reduces with increasing distance from the template (26). This results in one skeleton per subject containing the centers of each individual’s white matter.

Voxel-wise tests between patients and comparison subjects and between unaffected siblings and comparison subjects were performed using threshold-free cluster enhancement (FMRIB Software Library-Randomize) (27). We corrected p values for multiple comparisons according to family-wise error rate by 5,000 permutations across groups. For all voxel-wise comparisons, age, age squared, and sex were included as covariates, and a significance threshold of p<0.05, family-wise error corrected, was used. Only clusters containing more than 10 contiguous significant voxels are reported. Significant voxels were localized to anatomical structures using standard atlases (28, 29), followed by an automatic atlas query tool, “autoaq”; http://brainder.org/2012/07/30/automatic-atlas-queries-in-fsl/). As a cross-validation, voxel-wise statistics were also evaluated using traditional “cluster-extent” statistics, with a cluster-forming threshold of t>2.

Our sample contained 108 full siblings (54 pairs), and intra-class correlations were

calculated for the mean values within significant patient < comparison subject and sibling < comparison subject clusters as an index of familiality.

Region-of-Interest Analysis

To extend our voxel-level analysis, atlas-derived regions of interest were examined in three broad categories:

1. Limbic and frontotemporal connections: column and body of the fornix, cingulum bundles, the hippocampal end of the cingulum, the uncinate fasciculus, and the superior longitudinal fasciculus;

2. Thalamic tracts: the anterior, posterior and retrolenticular limbs of the internal capsule, the external capsule, and the posterior thalamic radiations; and

3. Callosal regions: forceps major and forceps minor.

See the data supplement that accompanies the online edition of this article for detailed methods.

NIH-PA Author Manuscript

NIH-PA Author Manuscript

(5)

For each region of interest, differences between patients and comparison subjects and between siblings and comparison subjects were tested in separate linear mixed models, with hemisphere as the within-subject factor and group, age, age squared, and sex as covariates. For the callosal tracts, mixed models were calculated with subregion as the within-subject factor. For the fornix, general linear models were calculated with group, age, age squared, and sex as independent variables. We corrected p values for multiple testing according to false discovery rate.

Intraclass correlation coefficients between the sibling pairs were calculated separately for mean fractional anisotropy within each region. Statistics were calculated in R, version 2.15.1 (http://www.r-project.org/).

Correlations With Clinical Measures and Potential Confounds

Within the patient group, Spearman’s rank correlations were calculated between duration since first manic episode and mean fractional anisotropy across the skeleton and within significant clusters. We also examined the extent to which the effects of duration of illness, duration of illness squared, and age were mutually independent by including age, sex, and age squared in the regression.

Severity of history of psychotic symptoms was estimated by summing each patient’s score for the positive symptoms and schizophrenia subscales of the Lifetime Dimensions of Psychosis Scale. The square root of this composite score (to correct for positive skew in the distribution) was entered in general linear models on mean fractional anisotropy across the skeleton and within significant clusters.

Medication effects were examined by comparing extracted anisotropy values between subgroups of patients who were currently using different classes of medications: antipsychotics, lithium, other mood stabilizers, and antidepressants.

Effects of current nicotine use, anxiety disorders, and past history of alcohol and substance abuse were examined using general linear models with the extracted fractional anisotropy values as dependent variables.

Results

Diagnostic Effects

Voxel-wise comparisons indicated that individuals with bipolar disorder exhibited reduced fractional anisotropy across the skeleton in seven clusters (Figure 1A and see Table S1 in the online data supplement; p<0.05, family-wise error corrected, df=105). We found no voxels in which fractional anisotropy was increased in patients relative to healthy comparison subjects. T statistics within clusters were between 0.83 and 4.89, and the histogram of voxels in the skeleton was symmetrically distributed with a peak at t=0.74 (Figure 1B), suggesting that the effect was subtle but spatially consistent. In line with this observation, average fractional anisotropy extracted across the entire skeleton mask was significantly reduced in patients (t=3.26, df=105, p<0.002). Using the more conventional cluster-extent method, we found three smaller clusters restricted to the voxels with the largest effect sizes

NIH-PA Author Manuscript

NIH-PA Author Manuscript

(6)

in the corpus callosum and superior parietal regions (see Figure S2 in the online data supplement; p<0.05 family-wise error corrected, df=105).

Similar results were obtained when only right-handed individuals were examined, when excluding patients with Young Mania Rating Scale or HAM-D score >7 (N=14), and when we did not covary for age, age squared, and sex.

Region-of-interest analyses also revealed that bipolar patients had significantly reduced anisotropy in most regions (p<0.05, false discovery rate corrected), including the cingulum, superior longitudinal fasciculi, and all thalamocortical tracts except the retrolenticular limb of the internal capsule (Table 2). No significant group-by-hemisphere interactions were found.

Familiality of Fractional Anisotropy Reductions in Bipolar Disorder

Comparing voxels within the significant case-comparison contrasts, we found reduced fractional anisotropy in unaffected siblings (p<0.05, family-wise error corrected; df=101) in the splenium and body of the corpus callosum, the posterior thalamic radiations, the posterior corona radiata, and the left superior longitudinal fasciculus (Figure 2A and see Table S2 in the online data supplement). We found no voxels in which anisotropy was significantly increased in siblings relative to comparison subjects. The histogram of the raw t statistic again showed a symmetric distribution, with the peak at t=0.86 (Figure 2B). Similar results were obtained when only right-handed individuals were included, when siblings with a history of depression (N=2) were excluded, when the two siblings with lowest fractional anisotropy were excluded, and when removing age, age squared, and sex covariates from the model.

In the siblings, region-of-interest analysis revealed a trend for reduced anisotropy in the forceps and the posterior thalamic radiations, which were not significant at 5% false discovery rate (Table 2). No significant hemisphere-by-group interactions were found. Average fractional anisotropy within the case-comparison cluster (Figure 1A) for unaffected siblings was intermediate between the comparison group (t=3.32, p=0.001, df= 105) and their affected siblings (t=3.21, p=0.0085, df=109; Figure 1B).

Fractional anisotropy correlated highly between siblings with significant intraclass correlations (p<0.05, false discovery rate corrected) for most regions except the right ret-rolenticular internal capsule, the right cingulum, and the callosal tracts, which correlated at a trend level (Table 3).

Associations With Clinical Measures

Duration of illness was negatively correlated with mean fractional anisotropy across the entire skeleton (rs=−0.41, p=0.0008) and with mean fractional anisotropy in the case-comparison cluster (rs=−0.54, p<10 −5) and in the sibling-comparison cluster (rs=−0.41, p=0.0008). Age was negatively correlated with extracted fractional anisotropy measures (−0.16>rs>−0.33) and with duration of illness (rs=0.86). In a general linear model including

NIH-PA Author Manuscript

NIH-PA Author Manuscript

(7)

age, age squared, and sex, the effect of duration of illness remained highly significant on mean fractional anisotropy across the skeleton (t=−2.93, df=58, p=0.0049), in the case-comparison cluster (t=−3.58, df=58, p=0.0007), and in the sibling-case-comparison cluster (t= −2.15, df=58, p=0.036), demonstrating that this relationship is largely independent of age. Adding a quadratic effect of duration of illness (t=1.70, p=0.09) did not change the above linear association between duration of illness and fractional anisotropy.

We found a significant effect of Lifetime Dimensions of Psychotic Symptoms scores on mean fractional anisotropy in the entire skeleton (t=−2.17, df=58, p=0.034), in the case-comparison cluster (t=−2.13, df=58, p=0.037), and in the sibling-case-comparison cluster (t= −2.66, df=58, p=0.010). This effect was independent of duration of illness, which did not correlate significantly with lifetime severity of psychotic symptoms.

Effects of Medication and Comorbid Disorders

We found no significant effects of antipsychotic, anti-depressant, lithium, or mood stabilizer use on mean fractional anisotropy in the entire skeleton or within either of the clusters (in all cases, t<1.82, df=58, p>0.08). Similarly, diagnoses of past alcohol or substance abuse or dependence did not significantly affect fractional anisotropy (in all cases, t<0.91, df=167, p>0.36). Lifetime history of anxiety disorders was associated with reduced fractional anisotropy in the case-control cluster (t=2.15, df=167, p=0.03), but when covarying for anxiety disorders, the differences between patients and comparison subjects (t=4.77, df=104, p<10−5) and between siblings and comparison subjects (t=3.34, df=100, p=0.001) remained significant. Finally, current smokers had significantly lower mean fractional anisotropy within the significant case-control cluster (t=2.3, df=167, p=0.02). However, when adjusted for smoking status, fractional anisotropy within the case-control cluster remained

significantly reduced in patients (F=5.36, df=104, p<10−6) and siblings (t=3.35, df=100, p=0.001). Together, these analyses demonstrate that medication use, substance abuse or dependence, and comorbid anxiety disorders alone cannot explain the observed group differences in fractional anisotropy.

Discussion

In the largest to date diffusion tensor imaging study of bipolar disorder to our knowledge, we found widespread white matter integrity reductions in patients that correlate with illness duration and severity of lifetime history of psychotic symptoms. These results are consistent with previous histological and imaging studies in bipolar disorder (7, 14). We found similar, but more subtle, fractional anisotropy reductions in unaffected siblings. Fractional

anisotropy values were also highly correlated between siblings, consistent with reports of high heritability for these measures (9, 10). Together, these results suggest an important role for white matter integrity in the pathology of bipolar disorder and support the validity of white matter integrity as an endophenotype for the illness.

White matter structure is an attractive intermediate phenotype for bipolar disorders, and potentially the wider psychosis spectrum, for several reasons: white matter integrity is reliably measured using diffusion tensor imaging (30); is directly related to relevant disconnectivity theories (31, 32); continues to mature throughout adolescence and early

NIH-PA Author Manuscript

NIH-PA Author Manuscript

(8)

twenties (33), corresponding to the typical age of symptom onset; and is suggestive of molecular pathways putatively implicated in the disorder (4, 34). Given the high heritability of fractional anisotropy (9, 10) and our observations of reductions in unaffected relatives and high intraclass correlations between siblings, we postulate that a shared set of genes are responsible for white matter abnormalities and risk for bipolar disorder. This notion is supported by a twin study showing genetic correlations between bipolar disorder and total white matter volume (35) and by decreased expression of white matter-related genes in patients with bipolar disorder (3). More speculatively, the present findings are consistent with the notion that white matter integrity is a mediator in the effects of risk genes on the clinical phenotype. If so, investigating white matter integrity in molecular and cellular studies may provide new insights into downstream biological pathways and mechanisms of risk genes and may ultimately result in the identification of new medication targets. Alternatively, an increased frequency of risk alleles for other heritable conditions (e.g., hypertension) in bipolar patients may indirectly affect white matter integrity. Hence, additional study of gene identification and genetic effects is warranted to better understand the potential pleiotropy between bipolar disorder and white matter.

Although more than 25 studies have reported abnormal fractional anisotropy in bipolar patients, the locations of the reported effects are heterogeneous. Consistent with cognitive neuroscience theories of emotion and mood regulation (32, 36), the most thoroughly described findings are within the frontal lobe and its connections with the medial temporal structures and the thalamus (4, 7). Yet, there are as many reported white matter deficits outside these regions (7, 14). In unaffected relatives, three studies showed localized effects (11, 13, 14) and one indicated a global effect (15). Our present voxel-wise and region-of-interest results also suggest widespread white matter perturbations in patients, while effects in the siblings were primarily restricted to the splenium of the corpus callosum, the posterior thalamic radiations, and the left superior longitudinal fasciculus. These results could reflect a true localization of familial influence in these regions, implying that fractional anisotropy reductions in other areas are determined by illness-specific factors. Alternatively, this apparent localization could reflect a statistical sensitivity bias favoring large, well-defined fiber bundles that enable the detection of subtler effects in unaffected siblings. Several observations are in favor of the latter interpretation, including those from a similarly large sample (15). First, average fractional anisotropy extracted from the entire case-control cluster, which spanned more than half of the tract-based skeleton, was significantly reduced in siblings (Figure 2). Second, the symmetrically rightward shift of the histogram of t statistics indicates a spatially consistent effect. Third, region-of-interest analysis revealed at least marginally reduced fractional anisotropy in all regions of interest except the anterior limbs of the internal capsule in unaffected relatives. Finally, histological data indicate that oligodendrocyte-related gene expression is highly homogeneous across the brain (37), suggesting that a common set of genes influence white matter integrity throughout the brain. Thus, while our results suggest that the familial aspect of fractional anisotropy reductions is restricted to a set of specific tracts, we cannot rule out a more global effect masked by differential sensitivity across the white matter skeleton.

Of note, none of the studies reporting localized effects in unaffected relatives employed threshold-free cluster enhancement as was done here and in the 2011 study by Sprooten et

NIH-PA Author Manuscript

NIH-PA Author Manuscript

(9)

al. (15), despite it being more sensitive than other methods of voxel-wise statistics,

particularly in the case of a subtle but spatially extended effect (27). A lack of sensitivity to this type of signal could be an explanation for the spatial inconsistencies of previous studies, in addition to small sample size and heterogeneity.

We found highly significant associations between fractional anisotropy and duration of illness, implying a disease-specific component. These results could represent a differential aging or neurodegenerative aspect to the illness that would require longitudinal studies to further investigate (38). Additionally, we show a negative association between severity of psychotic symptoms and fractional anisotropy, which is consistent with previous findings that history of psychosis in bipolar disorder is associated with abnormalities in prefrontal and fronto-limbic functional connectivity (18). These clinical associations imply that more severe deficits in structural and functional connectivity may be responsible for the psychotic subtype of bipolar disorder.

A few methodological limitations should be mentioned. First, the unaffected siblings were mostly past the typical age of bipolar disorder onset. Therefore, apart from familial effects, the presence of protective factors in the unaffected siblings cannot strictly be ruled out. However, the unaffected siblings had fractional anisotropy values intermediate between the comparison subjects and patients, which seems incompatible with pronounced effects of resilience. Second, a sibling design cannot technically separate genetic effects from common environmental effects. Nevertheless, previous twin (10) and pedigree (9) studies have established that the common environmental component of fractional anisotropy is small to negligible. Third, regarding diffusion imaging, several experiments have shown that fractional anisotropy is sensitive to various types of pathology in white matter, including myelin damage, axonal disorganization, fiber incoherence, and packing density (5, 6). Thus, while the interpretation of fractional anisotropy as a general index of white matter integrity has been validated, it cannot distinguish between specific microstructural detriments. Finally, tract-based spatial statistics optimize registration to white matter anatomy, allowing unbiased voxel-wise comparisons without a priori region selection, but they remain sensitive to registration errors. To localize results to specific tracts, complimentary methods such as tractography are desirable.

In summary, the present data confirm significant global fractional anisotropy reductions in affected individuals and more subtle reductions in unaffected relatives. Fractional anisotropy within tracts of interest and within significant clusters correlated highly between siblings, supporting a significant underlying familial component. Overall, these results confirm that white matter plays an important role in bipolar disorder and encourage its use as an endophenotype for genetic studies of the disorder.

Supplementary Material

Refer to Web version on PubMed Central for supplementary material.

Acknowledgments

Supported by grant RO1 MH080912 (D.C.G., principal investigator).

NIH-PA Author Manuscript

NIH-PA Author Manuscript

(10)

The authors thank all healthy volunteers, patients, and their families for participating in this study.

References

1. Vostrikov VM, Uranova NA, Orlovskaya DD. Deficit of peri-neuronal oligodendrocytes in the prefrontal cortex in schizophrenia and mood disorders. Schizophr Res. 2007; 94:273–280. [PubMed: 17566708]

2. Regenold WT, Phatak P, Marano CM, Gearhart L, Viens CH, Hisley KC. Myelin staining of deep white matter in the dorso-lateral prefrontal cortex in schizophrenia, bipolar disorder, and unipolar major depression. Psychiatry Res. 2007; 151:179–188. [PubMed: 17433451]

3. Tkachev D, Mimmack ML, Ryan MM, Wayland M, Freeman T, Jones PB, Starkey M, Webster MJ, Yolken RH, Bahn S. Oligo-dendrocyte dysfunction in schizophrenia and bipolar disorder. Lancet. 2003; 362:798–805. [PubMed: 13678875]

4. Mahon K, Burdick KE, Szeszko PR. A role for white matter abnormalities in the pathophysiology of bipolar disorder. Neurosci Biobehav Rev. 2010; 34:533–554. [PubMed: 19896972]

5. Li J, Li X-Y, Feng D-F, Gu L. Quantitative evaluation of microscopic injury with diffusion tensor imaging in a rat model of diffuse axonal injury. Eur J Neurosci. 2011; 33:933–945. [PubMed: 21385236]

6. Schmierer K, Wheeler-Kingshott CAM, Boulby PA, Scaravilli F, Altmann DR, Barker GJ, Tofts PS, Miller DH. Diffusion tensor imaging of post mortem multiple sclerosis brain. Neuroimage. 2007; 35:467–477. [PubMed: 17258908]

7. Vederine F-E, Wessa M, Leboyer M, Houenou J. A meta-analysis of whole-brain diffusion tensor imaging studies in bipolar disorder. Prog Neuropsychopharmacol Biol Psychiatry. 2011; 35:1820– 1826. [PubMed: 21624424]

8. Gottesman II, Gould TD. The endophenotype concept in psychiatry: etymology and strategic intentions. Am J Psychiatry. 2003; 160:636–645. [PubMed: 12668349]

9. Kochunov P, Glahn DC, Lancaster JL, Winkler AM, Smith S, Thompson PM, Almasy L, Duggirala R, Fox PT, Blangero J. Genetics of microstructure of cerebral white matter using diffusion tensor imaging. Neuroimage. 2010; 53:1109–1116. [PubMed: 20117221]

10. Chiang M-C, McMahon KL, de Zubicaray GI, Martin NG, Hickie I, Toga AW, Wright MJ, Thompson PM. Genetics of white matter development: a DTI study of 705 twins and their siblings aged 12 to 29. Neuroimage. 2011; 54:2308–2317. [PubMed: 20950689]

11. Frazier JA, Breeze JL, Papadimitriou G, Kennedy DN, Hodge SM, Moore CM, Howard JD, Rohan MP, Caviness VS, Makris N. White matter abnormalities in children with and at risk for bipolar disorder. Bipolar Disord. 2007; 9:799–809. [PubMed: 18076529]

12. Chaddock CA, Barker GJ, Marshall N, Schulze K, Hall MH, Fern A, Walshe M, Bramon E, Chitnis XA, Murray R, McDonald C. White matter microstructural impairments and genetic liability to familial bipolar I disorder. Br J Psychiatry. 2009; 194:527–534. [PubMed: 19478293] 13. Versace A, Ladouceur CD, Romero S, Birmaher B, Axelson DA, Kupfer DJ, Phillips ML. Altered

development of white matter in youth at high familial risk for bipolar disorder: a diffusion tensor imaging study. J Am Acad Child Adolesc Psychiatry. 2010; 49:1249–1259. 1259.e1. [PubMed: 21093774]

14. Mahon K, Burdick KE, Ikuta T, Braga RJ, Gruner P, Malhotra AK, Szeszko PR. Abnormal temporal lobe white matter as a bio-marker for genetic risk of bipolar disorder. Biol Psychiatry. 2013; 73:177–182. [PubMed: 23036958]

15. Sprooten E, Sussmann JE, Clugston A, Peel A, McKirdy J, Moor-head TWJ, Anderson S, Shand AJ, Giles S, Bastin ME, Hall J, Johnstone EC, Lawrie SM, McIntosh AM. White matter integrity in individuals at high genetic risk of bipolar disorder. Biol Psychiatry. 2011; 70:350–356. [PubMed: 21429475]

16. Pearlson GD, Wong DF, Tune LE, Ross CA, Chase GA, Links JM, Dannals RF, Wilson AA, Ravert HT, Wagner HN Jr, DePaulo JR. In vivo D2 dopamine receptor density in psychotic and non-psychotic patients with bipolar disorder. Arch Gen Psychiatry. 1995; 52:471–477. [PubMed: 7771917]

NIH-PA Author Manuscript

NIH-PA Author Manuscript

(11)

17. Strasser HC, Lilyestrom J, Ashby ER, Honeycutt NA, Schretlen DJ, Pulver AE, Hopkins RO, Depaulo JR, Potash JB, Schweizer B, Yates KO, Kurian E, Barta PE, Pearlson GD. Hippocampal and ventricular volumes in psychotic and nonpsychotic bipolar patients compared with

schizophrenia patients and community control subjects: a pilot study. Biol Psychiatry. 2005; 57:633–639. [PubMed: 15780850]

18. Anticevic A, Brumbaugh MS, Winkler AM, Lombardo LE, Barrett J, Corlett PR, Kober H, Gruber J, Repovs G, Cole MW, Krystal JH, Pearlson GD, Glahn DC. Global prefrontal and fronto-amygdala dysconnectivity in bipolar I disorder with psychosis history. Biol Psychiatry. 2013; 73:565–573. [PubMed: 22980587]

19. Glahn DC, Bearden CE, Barguil M, Barrett J, Reichenberg A, Bowden CL, Soares JC, Velligan DI. The neurocognitive signature of psychotic bipolar disorder. Biol Psychiatry. 2007; 62:910– 916. [PubMed: 17543288]

20. First, MB.; Spitzer, RL.; Gibbon, M.; Williams, JBW. Structured Clinical Interview for DSM-IV-TR Axis I Disorders. New York: Biometrics Research, New York State Psychiatric Institute; 2002. 21. Wechsler, D. Wechsler Abbreviated Scale of Intelligence. San Antonio: Psychological

Corporation; 1999.

22. Hamilton M. Development of a rating scale for primary depressive illness. Br J Soc Clin Psychol. 1967; 6:278–296. [PubMed: 6080235]

23. Young RC, Biggs JT, Ziegler VE, Meyer DA. A rating scale for mania: reliability, validity and sensitivity. Br J Psychiatry. 1978; 133:429–435. [PubMed: 728692]

24. Ventura J, Green MF, Shaner A, Liberman RP. Training and quality assurance with the Brief Psychiatric Rating Scale: “the drift busters”. Int J Methods Psychiatr Res. 1993; 3:221–244. 25. Levinson DF, Mowry BJ, Escamilla MA, Faraone SV. The Lifetime Dimensions of Psychosis

Scale (LDPS): description and interrater reliability. Schizophr Bull. 2002; 28:683–695. [PubMed: 12795498]

26. Smith SM, Jenkinson M, Johansen-Berg H, Rueckert D, Nichols TE, Mackay CE, Watkins KE, Ciccarelli O, Cader MZ, Matthews PM, Behrens TEJ. Tract-based spatial statistics: voxelwise analysis of multi-subject diffusion data. Neuroimage. 2006; 31:1487–1505. [PubMed: 16624579] 27. Smith SM, Nichols TE. Threshold-free cluster enhancement: addressing problems of smoothing,

threshold dependence, and localization in cluster inference. Neuroimage. 2009; 44:83–98. [PubMed: 18501637]

28. Mori, S.; Faria, AV.; Van Zijl, PCM.; Oishi, K. MRI Atlas of Human White Matter. 2. Amsterdam: Elsevier/Academic Press; 2011.

29. Wakana S, Caprihan A, Panzenboeck MM, Fallon JH, Perry M, Gollub RL, Hua K, Zhang J, Jiang H, Dubey P, Blitz A, van Zijl P, Mori S. Reproducibility of quantitative tractography methods applied to cerebral white matter. Neuroimage. 2007; 36:630–644. [PubMed: 17481925] 30. Huang L, Wang X, Baliki MN, Wang L, Apkarian AV, Parrish TB. Reproducibility of structural,

resting-state BOLD and DTI data between identical scanners. PLoS ONE. 2012; 7:e47684. [PubMed: 23133518]

31. Friston KJ, Frith CD. Schizophrenia: a disconnection syndrome? Clin Neurosci. 1995; 3:89–97. [PubMed: 7583624]

32. Strakowski SM, Delbello MP, Adler CM. The functional neuroanatomy of bipolar disorder: a review of neuroimaging findings. Mol Psychiatry. 2005; 10:105–116. [PubMed: 15340357] 33. Lebel C, Walker L, Leemans A, Phillips L, Beaulieu C. Microstructural maturation of the human

brain from childhood to adulthood. Neuroimage. 2008; 40:1044–1055. [PubMed: 18295509] 34. Sprooten E, Fleming KM, Thomson PA, Bastin ME, Whalley HC, Hall J, Sussmann JE, McKirdy

J, Blackwood D, Lawrie SM, McIntosh AM. White matter integrity as an intermediate phenotype: exploratory genome-wide association analysis in individuals at high risk of bipolar disorder. Psychiatry Res. 2013; 206:223–231. [PubMed: 23218918]

35. van der Schot AC, Vonk R, Brans RGH, van Haren NEM, Koolschijn PCMP, Nuboer V, Schnack HG, van Baal GCM, Boomsma DI, Nolen WA, Hulshoff Pol HE, Kahn RS. Influence of genes and environment on brain volumes in twin pairs concordant and discordant for bipolar disorder. Arch Gen Psychiatry. 2009; 66:142–151. [PubMed: 19188536]

NIH-PA Author Manuscript

NIH-PA Author Manuscript

(12)

36. Strakowski SM, Adler CM, Almeida J, Altshuler LL, Blumberg HP, Chang KD, DelBello MP, Frangou S, McIntosh A, Phillips ML, Sussman JE, Townsend JD. The functional neuroanatomy of bipolar disorder: a consensus model. Bipolar Disord. 2012; 14:313–325. [PubMed: 22631617] 37. Oldham MC, Konopka G, Iwamoto K, Langfelder P, Kato T, Horvath S, Geschwind DH.

Functional organization of the transcriptome in human brain. Nat Neurosci. 2008; 11:1271–1282. [PubMed: 18849986]

38. Brambilla P, Glahn DC, Balestrieri M, Soares JC. Magnetic resonance findings in bipolar disorder. Psychiatr Clin North Am. 2005; 28:443–467. [PubMed: 15826742]

NIH-PA Author Manuscript

NIH-PA Author Manuscript

(13)

FIGURE 1. Voxel-Wise Comparisons in a Study of White Matter Integrity in Bipolar Disordera a Panel A depicts voxel-wise analysis showing reduced fractional anisotropy in bipolar patients relative to healthy comparison subjects (p<0.05, family-wise error corrected; tract-based spatial statistics filled). Panel B depicts a histogram of raw t statistics of all voxels in the skeleton mask. Panel C depicts extracted mean fractional anisotropy within the

significant cluster per individual.

NIH-PA Author Manuscript

NIH-PA Author Manuscript

(14)

FIGURE 2. Voxel-Wise Comparisons in a Study of White Matter Integrity in Bipolar Disordera a Panel A depicts voxel-wise analysis showing reduced fractional anisotropy in unaffected siblings (p<0.05, family-wise error corrected, within the above patient < comparison cluster mask; tract-based spatial statistics filled). Panel B depicts a histogram of raw t statistics of all voxels in significant case-comparison cluster. Panel C depicts extracted mean fractional anisotropy within the significant cluster per individual.

NIH-PA Author Manuscript

NIH-PA Author Manuscript

(15)

NIH-PA Author Manuscript

NIH-PA Author Manuscript

NIH-PA Author Manuscript

TABLE 1

Demographic and Clinical Sample Characteristics in a Study of White Matter Integrity in Bipolar Disorder

a

Sample Characteristics

Patients (N=64)

Siblings (N=60)

Healthy Comparison Subjects (N=46)

Analysis Mean/Median SD/IQR Mean/Median SD/IQR Mean/Median SD/IQR F p Age (years) 31.69 11.38 30.35 12.50 30.07 10.63 0.57 0.45 Education (years) 14.22 1.82 14.22 1.92 14.52 2.04 0.61 0.44 IQ estimate b 103.68 14.53 104.55 14.87 107.67 13.96 1.85 0.18 Current symptoms

Hamilton Depression Rating Scale score

c 2.00 4.00 0.00 1.00 0.00 0.00

Young Mania Rating Scale score

c 1.00 4.00 0.00 1.00 0.00 0.00

Brief Psychiatric Rating Scale score

c 27.00 5.00 25.00 2.00 24.00 1.00 Clinical course

Age at onset of mania (years)

c,

d

18.00

5.00

Duration of illness (years)

a

,b

10.00

12.75

LDPS psychosis severity score

c 3.00 8.00 N % N % N % χ 2 p Female gender 46 71.88 36 60.00 31 67.39 1.98 0.37 Right handed e 48 75.00 59 98.33 37 80.43 0.004

Single-episode major depression

2

3.13

2

3.33

Major depression, recurrent

61 95.31 History of psychosis 30 46.88 Medication use f Mood stabilizer(s) 34 53.13 Antidepressant(s) 28 43.75 9 15.00 1 2.17 Atypical antipsychotic(s) 23 35.94 Anxiolytic/benzodiazepine(s) 23 35.94 3 5.00 Lithium 12 18.75 Unmedicated 11 17.19

(16)

NIH-PA Author Manuscript

NIH-PA Author Manuscript

NIH-PA Author Manuscript

Sample Characteristics

Patients (N=64)

Siblings (N=60)

Healthy Comparison Subjects (N=46)

Analysis Mean/Median SD/IQR Mean/Median SD/IQR Mean/Median SD/IQR F p Stimulant(s) 3 4.69 5 8.33 Comorbid diagnoses

Any anxiety disorder

e 30 46.88 5 8.33 2 4.35 10 −8

Any alcohol use disorder

e 33 51.56 7 11.67 2 4.35 10 −9

Any substance use disorder

e, g 29 45.31 6 10.00 3 6.52 10 −7

Nicotine dependence, current

e 21 32.81 9 15.00 3 6.52 0.002

(17)

NIH-PA Author Manuscript

NIH-PA Author Manuscript

NIH-PA Author Manuscript

TABLE 2

Between-Group Differences on Mean Fractional Anisotropy Within Atlas-Based Regions-Of-Interest

a

Fractional Anisotropy

Comparison Subjects – Patients (df=105)

Comparison Subjects – Siblings (df=101)

t p pFDR t p pFDR

Forceps major and minor

1.88 0.06 0.08 2.00 0.05 0.27 Fornix 2.06 0.04 0.06 1.13 0.26 0.68 Uncinate fasciculus 1.29 0.20 0.22 0.56 0.58 0.68 Cingulum bundle 2.31 0.02 0.04 0.64 0.52 0.68 Cingulum hippocampal 3.07 0.003 0.01 0.73 0.47 0.68

Posterior thalamic radiations

3.64 0.0004 0.004 1.98 0.05 0.25

Anterior limb of internal capsule

2.30 0.024 0.04 0.02 0.98 0.98

Posterior limb of internal capsule

2.16 0.03 0.05 0.63 0.53 0.68

Retrolenticular internal capsule

0.58 0.56 0.56 0.50 0.62 0.68 External capsule 2.77 0.007 0.02 1.42 0.16 0.58

Superior longitudinal fasciculus

3.37 0.001 0.006 0.99 0.33 0.68 a FDR=false-discovery rate.

(18)

NIH-PA Author Manuscript

NIH-PA Author Manuscript

NIH-PA Author Manuscript

TABLE 3

Intraclass Correlation Coefficients Between Siblings in a Study of White Matter Integrity in Bipolar Disordera

White Matter Tract or Region Intraclass Correlation Coefficient p pFDR

Left uncinate fasciculus 0.28 0.02 0.03*

Right uncinate fasciculus 0.38 0.002 0.006**

Left cingulum bundle 0.48 0.001 0.005**

Right cingulum bundle 0.19 0.08 0.09

Left cingulum (hippocampal) 0.36 0.003 0.008**

Right cingulum (hippocampal) 0.40 0.001 0.005**

Left superior longitudinal fasciculus 0.45 0.0002 0.001** Right superior longitudinal fasciculus 0.48 0.0004 0.001**

Left external capsule 0.27 0.02 0.03*

Right external capsule 0.31 0.01 0.02*

Left anterior limb of internal capsule 0.47 0.0002 0.001** Right anterior limb of internal capsule 0.36 0.004 0.008** Left posterior limb of internal capsule 0.34 0.005 0.01** Right posterior limb of internal capsule 0.33 0.006 0.01**

Left retrolenticular internal capsule −0.04 0.61 0.61

Right retrolenticular internal capsule 0.21 0.06 0.07

Left posterior thalamic radiation 0.23 0.05 0.06

Right posterior thalamic radiation 0.35 0.004 0.008**

Forceps major 0.22 0.06 0.06

Forceps minor 0.31 0.05 0.06

Fornix (column and body) 0.36 0.003 0.008**

Entire tract-based spatial statistics skeleton 0.37 0.003

Sibling < comparison cluster 0.44 0.0004

Patient < comparison cluster 0.40 0.001

a FDR=false-discovery rate. * pFDR<0.05. ** pFDR<0.01.

Figure

FIGURE 1. Voxel-Wise Comparisons in a Study of White Matter Integrity in Bipolar Disorder a a  Panel A depicts voxel-wise analysis showing reduced fractional anisotropy in bipolar patients relative to healthy comparison subjects (p&lt;0.05, family-wise err
FIGURE 2. Voxel-Wise Comparisons in a Study of White Matter Integrity in Bipolar Disorder a a  Panel A depicts voxel-wise analysis showing reduced fractional anisotropy in unaffected siblings (p&lt;0.05, family-wise error corrected, within the above patien

Références

Documents relatifs

Factors associated with adherence to medication according to linear regression models using MARS a total score, BIS-10 b nonplanning impulsivity sub-scale score, age, illness

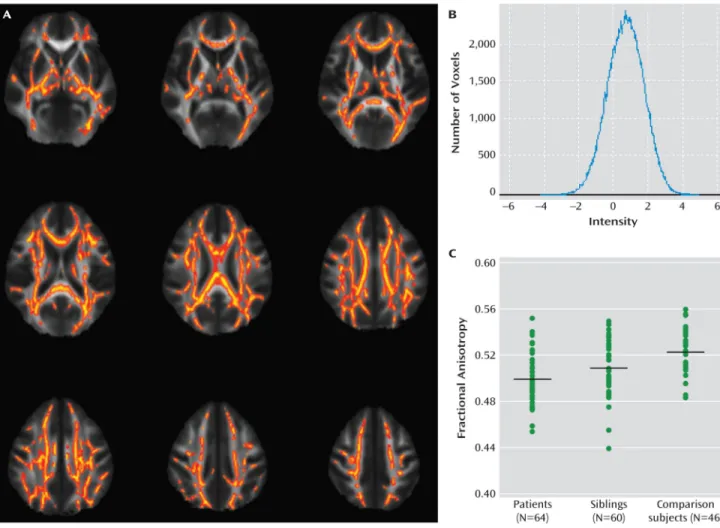
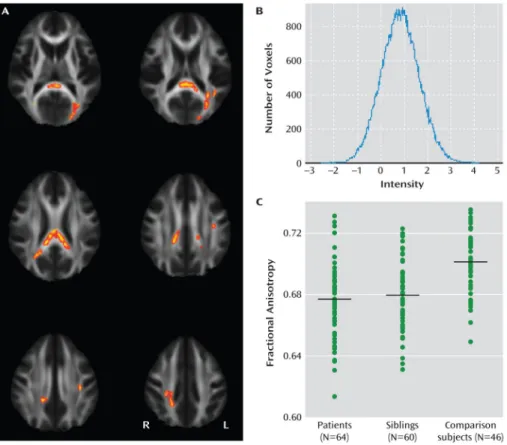
To study white matter abnormalities using whole-brain tractography in a large international multicenter sample of patients with bipolar disorder type 1 and to compare these

Bremer et al observed that polymorphisms in NTRK2 and INPP1 genes were associated with the response to lithium, and also with both suicidal ideation and post-traumatic

Distribution of the mean FA values for the selected white matter tracts within the fronto-cerebellar circuit (mcp = middle cerebellar peduncle, scp = superior cerebellar peduncle)

The golden rules for people being treated for bipolar disorder are: never stop taking medicines even if you feel completely recovered, contact your doctor immediately if you

Hou, Cleak and Peveler [12] focused more specifically on the impact of illness representation on adherence in bipolar disorder with the Revised Illness

Diffusion tensor imaging red-green-blue maps in a representative control subject and patients with frontal variant and temporal variant of frontotemporal dementia (fvFTD and