OATAO is an open access repository that collects the work of Toulouse
researchers and makes it freely available over the web where possible
Any correspondence concerning this service should be sent
to the repository administrator:
[email protected]
This is an author’s version published in: http://oatao.univ-toulouse.fr/25512
To cite this version:
Rousseau, Raphaël
and Ketep, Françoise
and Etcheverry, Luc
and
Délia, Marie-Line
and Bergel, Alain
Microbial electrolysis cell (MEC): A
step ahead towards hydrogen-evolving cathode operated at high current
density. (2020) Bioresource Technology Reports, 9. 1-9. ISSN 2589-014X
Official URL :
https://doi.org/10.1016/j.biteb.2020.100399
Microbial electrolysis cell (MEC): A step ahead towards hydrogen-evolving
cathode operated at high current density
Raphaël Rousseau, Stéphanie F. Ketep, Luc Etcheverry, Marie-Line Délia, Alain Bergel
⁎Laboratoire de Genie Chimique, Université de Toulouse, CNRS, INP, UPS, Toulouse, France
Keywords:
Hydrogen Saline medium
Microbial electrochemical technology Microbial fuel cell
Bioelectrochemical system
A B S T R A C T
A microbial electrolysis cell (MEC) 6 L in volume was designed with the objective of maximizing the current density at the cathode. The highly saline electrolyte (NaCl 45 g·L−1) led to a low ohmic resistance, of 0.10 Ω, and
made it possible to maintain current density of around 50 A·m−2for weeks, with peak values up to 90 A·m−2for
hours. This was the highest current density reached in a MEC prototype so far. The gas outlet contained at least 66% H2, which gave a hydrogen flow rate up to 650 Ld−1m−2of cathode surface area. The energy and thermal
yields were discussed. A numerical mass balance model was designed, which explained the value of the anode Faradaic yield above 100% and pointed out new issues related to high current density operation. In particular, it was shown that, at high current density, carbonate deposit can impact the gas composition.
1. Introduction
Microbial electrolysis proposes an innovative route for converting electrical energy to chemical energy in the form of hydrogen or me-thane. The concept of microbial electrolysis cells (MECs), first proposed in 2005 (Liu et al., 2005;Rozendal et al., 2006), is to couple a microbial anode with a hydrogen-evolving cathode. In comparison to conven-tional water electrolysis, the oxidation of water at the anode is replaced by the oxidation of low-cost organic compounds, which is made pos-sible by the microbial anode (Kadier et al., 2014;Pandey et al., 2016;
Pant et al., 2010). The equilibrium cell voltage of an MEC, 0.123 V in standard conditions, is thus considerably lower than that of water electrolysis, equal to 1.23 V. On the basis of thermodynamics, the electrical power consumed by an MEC should be lower than that con-sumed by water electrolysis (Rousseau et al., 2020).
In spite of huge research efforts, the attempts to scale up to large-sized MECs have encountered great difficulties (Escapa et al., 2015). Most MEC pilots with volumes of at least several litres have operated with very low current density, < 1 A·m−2(Baeza et al., 2017;Brown
et al., 2014;Chen et al., 2019;Cusick et al., 2011;Escapa et al., 2015;
Gil-Carrera et al., 2013b, 2013c, 2013a;Heidrich et al., 2014, 2013;
Luo et al., 2017;Sugnaux et al., 2017). One of the reasons for such poor performance was the usual choice to develop MEC pilots for wastewater treatments. Wastewaters have very low ionic conductivity, commonly of the order of 0.2 Ω·m−1, sometimes less (Oliot et al., 2016). Scaling up
an electrochemical process with such electrolytes is a very tough
challenge (Oliot et al., 2017). Slightly higher current density, of 1.75 A·m−2, has been obtained with a specific effluent, pig slurry, which
ensured higher ionic conductivity (2.6 S·m−1), with added acetate as
the substrate (San-Martín et al., 2019). Using a synthetic medium with acetate has been necessary to increase the current density to 10 A·m−2
(Guo et al., 2017). To the best of our knowledge, in the context of MEC pilots of several litres, the highest current densities of 9.2 A·m−2, with
peak value of up to 42.5 A·m−2(with respect to the cathode surface
area), have been reached by using a saline electrolyte (35 g/L NaCl), which ensured an ionic conductivity of 9 S·m−1(Carmona-Martinez
et al., 2015).
The purpose of the present study was to design an MEC pilot that produced the highest possible current density at the cathode. This op-timization criterion was chosen because it corresponded to the highest possible hydrogen flux per cathode surface area.
It has recently been highlighted that the cathode current density, or the hydrogen production rate related to the cathode surface area, is the essential parameter to be maximised if the objective is to boost MEC technology towards commercial interest (Rousseau et al., 2020). This is also the essential parameter to be considered to compare different technological options, as it is the case for any electrochemical process (Wendt and Kreysa, 1999). Actually, volumetric hydrogen production rates are often reported and used for comparison of different devices in the literature devoted to MEC, but using this parameter is not scienti-fically supported and may lead to wrong conclusions (Rousseau et al., 2020). For this reason, according to common rule of electrochemical
⁎Corresponding author.
E-mail address:[email protected](A. Bergel). https://doi.org/10.1016/j.biteb.2020.100399
diameter, 254 SMO stainless steel pipe (Outokumpu, Sweden). The volume of the electrolyte, 5.25 L, filled the reactor to a height of 35 cm, so the cathode surface area exposed to the electrolyte was 220 cm2. The
reactor was surrounded with an external water jacket to maintain the temperature at 40 °C. The anode was polarized at 0.1 V vs. a saturated calomel reference electrode (0.24 V/SHE, Radiometer), which was set in the lid of the reactor, with a Biologic potentiostat.
Unless otherwise stated, current densities are expressed with respect to the surface area of the cathode (220 cm2). The Faradaic yield related
to acetate oxidation at the anode was calculated as the ratio of the charge that circulated in the electrical circuit during a given period to the charge that could be produced by the oxidation of the amount of acetate consumed during the same period, according toreaction (1):
+ + ++
CH COO3 – 2H O2 2CO2 7H 8e (1)
Sediments collected from a salt marsh (Mediterranean Sea, Gruissan, France) were used as the inoculum, at 5–10% v/v inoculum ratio. The electrolyte was based on Starkey medium (detailed compo-sition published elsewhere (Rousseau et al., 2013)) supplemented with NaCl 45 g·L−1and various concentrations of sodium acetate used as the
substrate. The conductivity of the final solution was 10.4 S·m−1, and its
pH was 7.5.
2.2. Analytical procedures
The reactor was hermetically sealed and the gas composition was analysed in the outlet stream by micro gas chromatography (μCPG-490GC, Agilent). A zeolite molecular sieve column was used to measure the H2(argon as carrier gas, 100 °C, 150 kPa) and a
polystyrene-divi-nylbenzene column to measure the CO2and CH4(helium as carrier gas,
45 °C, 150 kPa). Calibration was performed with pure gases and an H2
-CH4-CO2 mix (60:10:30%). The mineral deposit observed on the
cathode surface was analysed by Inductively Coupled Plasma Spectroscopy (Jobin Yvon Ultima ICP).
The acetate concentration was regularly measured with an enzy-matic kit (Libios, K-ACETAK). When the concentration fell below a given minimum threshold (usually 5 to 10 mM), sodium acetate, in the form of a concentrated solution (4 M), was added to recover the initial concentration (usually 40 mM).
The compositions of the cathode deposits were determined by en-ergy-dispersive-X-ray spectroscopy (EDX, SAEDX Oxford detector) with a scanning electron microscope (Leo 436 VP). The deposits were re-moved by scraping and the average values and standard deviations were based on four different samples, which gave similar spectra.
3. Results and discussion
3.1. Ohmic drops
The global internal resistance of the reactor was checked experi-mentally in abiotic conditions. The reactor was filled with the electro-lyte, without inoculum, and current was imposed from 1 to 3.5 A, i.e. with current densities from 45 to 159 A·m−2with respect to the cathode
surface area. The cell voltage varied linearly with the current, which was evidence of ohmic behaviour in this range of current values. In such operating conditions, the slope of the curve gave the ohmic resistance of the reactor, which was 0.31 Ω.
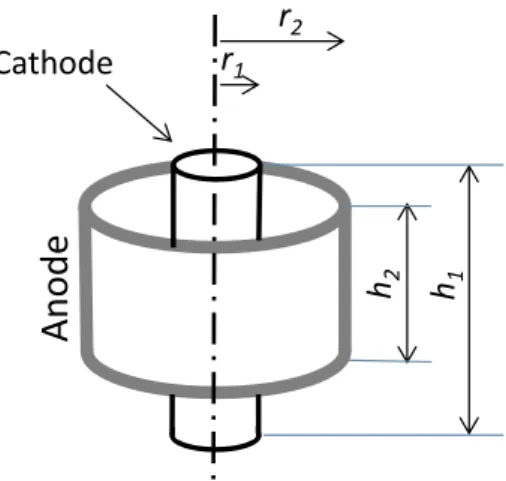
The contribution of the electrolyte to the ohmic drop can be eval-uated theoretically. In a coaxial reactor (Fig. 1) the resistance of the electrolyte is given by:
= R r hdr 2 S r r 1 2 (2) where r1(m) is the cathode radius, r2(m) is the anode radius, h (m) is
the electrode height and ρ (Ω·m) is the electrolyte resistivity. Here, the engineering, maximizing the cathode current was the essential
objec-tive of this study.
A volume of 6 L was chosen as a first pilot step, i.e. around one order of magnitude above conventional laboratory cells. Then, all choices concerning operating conditions and reactor design were made in this single aim: to improve the cathode current density. No choice of ap-plication sector was made a priori. Optimal conditions were thus sought without the influence of any constraint related to an intended appli-cation domain and were notably free from the detrimental conditions related to domestic wastewater treatment.
In this framework, halotolerant microbial anodes were chosen be-cause they can operate in electrolytes with high ionic conductivity (Grattieri and Minteer, 2018). In particular, microbial anodes formed from salt marsh inoculum have produced current densities up to 85 A·m−2 in well-controlled lab conditions (Rousseau et al., 2014, 2013).
They have shown optimum performance in solutions containing 45 g·L−1 NaCl, with ionic conductivity of 10.4 S·m−1.
To reach the objective of the highest possible cathode current density, the MEC was designed with coaxial electrodes: external gra-phite felt anode and an internal stainless steel cathode. The coaxial architecture with the cathode at the core concentrated the current line on the cathode, which had a smaller surface area than the anode, and thus favoured high current density at the cathode.
The anode was made of graphite felt because this structure had already been successfully used with the salt marsh microbial anode chosen here. All microbial anodes require MECs to work at pH values near neutrality. In such conditions, the conventional catalysts for hy-drogen evolution at the cathode, notably platinum, lose their catalytic properties. Consequently, the cathode was made of stainless steel, which is known to be appropriate for MEC cathodes (Selembo et al., 2009). Moreover, near neutral pH, stainless steel in association with weak acids is involved in a catalytic pathway of hydrogen evolution (Da Silva et al., 2004; Munoz et al., 2010; Roubaud et al., 2018).
It was chosen to run the MEC by controlling the potential applied to the anode vs. a reference electrode because the potential has been shown to impact the characteristics and performance of the microbial anode (Rousseau et al., 2016). This solution could not be scaled up to industrial level, where galvanostatic control is preferred. However, galvanostatic control is not suitable for a microbial anode because, should the reaction catalysed by the micro-organisms be deficient, the anode would start to oxidize water and/or chlorides to ensure the im-posed current (Rousseau et al., 2020). The production of oxygen and/or chlorine at the anode surface would definitively d estroy t he electro-active biofilm. Consequently, in the current state of the art, control of the potential applied to the anode appeared as the best alternative to maximize current density (Rimboud et al., 2014). Another solution will have to be found to scale the process up for industrial applications, using the cathode as a pseudo-reference, for example.
The cathode current densities reported for MEC pilots so far are so low compared to those reached by water electrolysis cells (for instance, a proton exchange membrane (PEM) electrolysis cell can reach 20,000 A·m−2) that it seems urgent to raise the current density levels in order
to promote the technology and provide arguments for continuing to support the research efforts. We hope this work will give some elements going in this direction.
2. Materials and methods
2.1. MEC design
The MEC was a polycarbonate cylinder of 40 cm height and 14 cm internal diameter, with a total volume of 6 L. It was equipped with a 12 mm thick graphite felt anode (RVG 4000, Mersen, France), 20 cm high and 40 cm wide (surface area 800 cm2), sandwiched between two
cylindrical titanium grids used as current collectors. The anode was placed against the reactor wall. In the centre, the cathode was a 2 cm
height (h2= 0.20 m) of the anode, which was fully embedded in the
electrolyte, was smaller than the length of the cathode exposed to the electrolyte (h1= 0.35 m) (Fig. 1). Consequently, the height h in the
integral depends on the parameter r as:
= + h h h h r r r r ( ) 2 1 2 2 2 1 (3)
where h1is the cathode height and h2is the anode height. Eq.(2)
be-comes: = + R r ar b dr 2 1 ( ) S r r 1 2 (4) where a and b are two constants:
= = + a h h r r b h h h r r r 1 2 2 1 2 1 2 2 1 2 (5)
Eq.(4)can be solved to give:
= + + R b r ar b ar b r 2 1 ln S 2 2 1 1 (6)
For the MEC designed here, the values of the parameters
r1= 0.01 m, r2= 0.0635 m and ρ = 0.096 Ω·m gave a resistance of the
electrolyte of 0.10 Ω.
The difference between the theoretical value of the electrolyte re-sistance, of 0.10 Ω, and the total ohmic rere-sistance, measured at 0.31 Ω, shows the importance of the resistances due to the electrical connec-tions. These resistances particularly include the contact between the carbon felt and the titanium collector (Rousseau et al., 2015), welds and clamps. This points out that technical issues can become more im-portant sources of power loss than the electrolyte resistance when a high conductivity electrolyte is used. These technical sources of power loss should obviously be tracked down and lowered as far as possible when the objective is to scale up to large-sized electrolysers with highly conductive electrolytes.
3.2. MEC operation
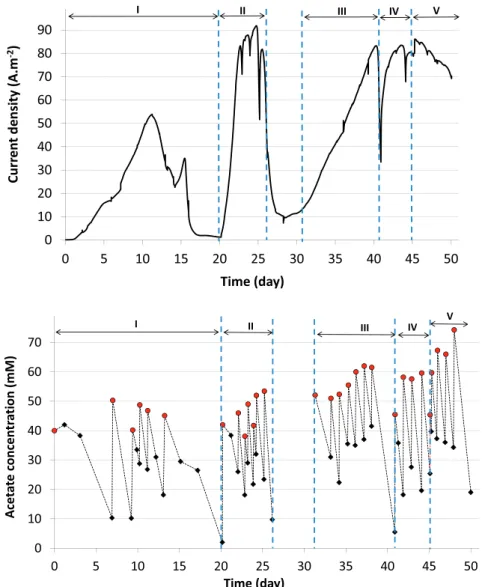
The MEC was inoculated with 5% v/v salt marsh sediment and run at 40 °C with the bioanode polarized at 0.1 V/SCE. After 2 days of initial time lag, the current density increased continuously to above 50 A·m−2
at day 11, and then decreased although the acetate concentration was maintained between 10 and 50 mM (Fig. 2). At day 14, addition of 3% v/v sediments led to a fast increase of current density, by around 10 A·m−2. It can be concluded that the initial amount of inoculum was not
sufficient to ensure sustainable development of an electrochemically efficient biofilm. Unfortunately, the current increase was transient and
the current fell again from day 15, while the acetate concentration was still around 30 mM. The addition of inoculum, which required opening the reactor, changed the gaseous head space of the reactor to air. We suspected that the slow diffusion of oxygen to the bioanode was the reason for the current density fall observed after day 15. Acetate ad-dition was stopped from day 15 in order let the reactor recover regular operating conditions, which proved to be successful at day 20.
Acetate concentration was allowed to fall to zero to start a new phase on day 20. At day 20 (phase II) acetate was added and the current density increased to above 80 A·m−2in < 3 days. The successive
ad-ditions of acetate ranging from 40 to 55 mM (Fig. 2) caused the current density to increase, reaching 90 A·m−2at day 25.
Acetate concentration was again allowed to fall and phase III was then performed by adding acetate at day 28. Current density again increased continuously, but at a lower rate than during phase II. Increasing the concentration of acetate to above 50 mM did not ac-celerate the recovery phase. When the current density reached around 80 A·m−2, the acetate level was allowed to fall again but the MEC was
not left in starvation conditions for as long a time as previously. Phase IV started with faster current recovery (day 41). Phase V was started at day 45 by emptying 3 L of solution (of the 5.25 L), which was replaced by fresh electrolyte. The production of current was not disturbed by this drastic operation. Finally, increasing the successive acetate additions to above 65 mM and up to 74 mM had an inhibiting effect on current production.
The decrease in current density observed for acetate concentrations below around 10 mM and the inhibiting effect observed for high con-centrations indicated an optimal range of acetate concentration of 10 to 60 mM. This behaviour is consistent with general observations showing that the current provided by microbial anodes fed with acetate varies with the substrate concentration according to a Michaelis-Menten type law: = + j j acetate K acetate [ ] [ ] max S (7)
where KSis an affinity constant of the order of a few mM (Marcus et al.,
2007;Pocaznoi et al., 2012b). Substrate inhibition is generally found to occur for concentrations above about 50 mM (Pocaznoi et al., 2012b). The successive five phases imposed on the MEC revealed good ro-bustness of the process with respect to acetate depletion. Actually, an over-long period of starvation, as between phases II and III, for in-stance, should be avoided because the rate of current restoration was then slower. Nevertheless, the maximum current density was reached again, and the MEC did not show any further disturbance.
The five successive phases of the MEC operation gave anode Faradaic yields that were related to acetate consumption slightly higher than 100% (Table 1). The values higher than 100% indicate that more electrons were released into the circuit than the amount that could result from the substrate oxidation. This phenomenon reveals hydrogen cycling to the bioanode (Escapa et al., 2015;Gil-Carrera et al., 2013c;
Lee et al., 2009;Parameswaran et al., 2009;Rousseau et al., 2020). Actually, a point not even observed in the context of MECs yet: similar oxidation at the anode may occur with methane (Rousseau et al., 2020). Here, the slight increase of the Faradaic yields from the first to the fifth phase may indicate the involvement of microbial catalysis in such a re-oxidation cycle. The bioanode adapted to the presence of hydrogen or methane and thus became more and more efficient at oxidizing them.
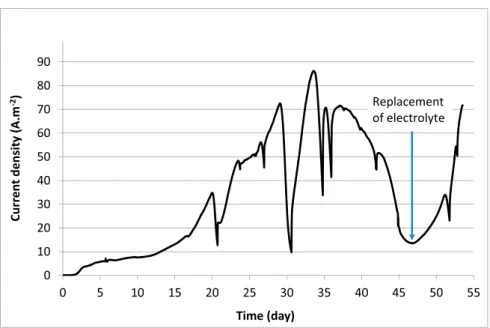
The reactor was run again with a clean anode and cathode, with an inoculum ratio of 10% v/v and with the acetate concentration main-tained around 40 mM by daily measurement and addition. After 2 days of initial time lag, it took 25 days for the current density to reach 70 A·m−2(Fig. 3). After a few days of acetate depletion (days 29 and 30),
the current density increased again and reached the maximum of 85 A·m−2at day 33. The current then started to decrease from day 37,
although the acetate concentration was maintained around 40 mM. At day 46, the reactor was emptied, except for the sediment deposited at
Fig. 1. Scheme of coaxial MEC. The length of the cathode exposed to the
the bottom, and refilled with fresh electrolyte. The current density immediately increased and recovered the value of 70 A·m−2found at
day 53.
The second run confirmed the possibility of maintaining the current density above 50 A·m−2for weeks. It also confirmed that the initial
phase of the bioanode formation was poorly mastered but, finally, the reactor always succeeded in producing similar, high current densities. The uncontrolled current decrease from day 37 was fully repaired by replacing the whole electrolyte by fresh medium at day 46, which suggests that the current decrease may have been due to the depletion of some micro-nutriments contained in the Starkey medium.
The gas flow rate (Qgas) measured for different values of the current
(0.5, 1.0, 1.5 and 2.0 A at days 7, 10, 22 and 24 of the first run) showed a linear correlation with the current density:
=
Qgas 11.6j 59.2 (8)
where Qgas (L·d−1·m−2) is the gas flow rate related to the cathode
surface area and j (A·m−2) the current density. This correlation was
valid (R2= 0.99) for current densities above around 20 A·m−2. The
composition of the gas was measured at various times corresponding to different current densities. The outlet gas was mainly composed of hydrogen (66 to 71%) and carbon dioxide (16 to 29%). A significant percentage of methane was always present (5 to 13%). The composition at the maximum current density of 90 A.m−2, at day 23, was 66, 29 and
5% in H2, CO2and CH4, respectively.
At the end of MEC operations, the cathode was seen to be covered by a compact, strongly adherent layer composed of brown and white deposits. EDX analysis of the white deposits revealed a high oxygen content (54.4 ± 0.9 atom%) and carbon (22.1 ± 1.0 atom%), which strongly suggests the presence of carbonate as the main anion. The other major components of the deposits were magnesium (11.1 ± 0.2 and 11.7 ± 0.5 atom% in the white and brown deposits, respectively), phosphorous (9.2 ± 0.7 and 10.5 ± 0.3 atom%) and calcium (3.1 ± 0.9 atom% in the brown deposit only). The phosphorous came from the Starkey medium and magnesium and calcium from the sedi-ment. The OH–ions produced at the cathode provoked the
alkaliniza-tion of the interface, which made carbonates and phosphates of mag-nesium and calcium precipitate onto the cathode surface.
Fig. 2. Current density and acetate concentration vs. time recorded with the MEC pilot. The bioanode was polarized at 0.1 V/SCE. Current density values were
related to the cathode surface area. For acetate concentration, red circles correspond to acetate additions. (For interpretation of the references to color in this figure legend, the reader is referred to the web version of this article.)
Table 1
Anode Faradaic yields related to acetate consumption. Faradaic yields were calculated for each of the five phases reported inFig. 2.
Phase I II III IV V
Total amount of acetate oxidized during the
phase (mole) 0.96 0.88 1.01 0.70 0.79 Faradaic yield (%) 103 107 116 113 123
In conclusion, the formation of the salt marsh bioanode is still poorly mastered and the periods of time needed to reach high elec-troactive performance can be fairly different. Here, 10 to 25 days were necessary to reach 50 A·m−2. A high inoculation ratio of 10% v/v with
salt marsh seemed necessary, while the significant concentration of magnesium and calcium ions it provided may have favoured fouling of the cathode by precipitation. Such chemical fouling is obviously det-rimental to the cathode performance. Nevertheless the cathode surface was perfectly cleaned with HCl 1 M, which quickly dissolved the whole deposit.
The MEC showed fair robustness. It accepted several days of acetate starvation, after which it was able to slowly recover its maximum current density. When acetate depletion did not last more than one day, the current density recovered very quickly after addition. The MEC accepted partial (3 L) or total replacement of the solution. This op-eration was required after a period of high current production, certainly because of the depletion of some micro-nutriment(s). Current density of up to 90 A·m−2was reached and values above 50 A·m−2were sustained
for weeks. It should be noted that the current density values were ex-pressed with respect to the surface area of the cathode, which had a smooth stainless steel surface. These current density values were con-sequently obtained without any enhancement due to porosity or three-dimensional effects.
3.3. Energy efficiency
The MEC was operated under constant applied potential at the bioanode. As explained in the introduction, this operating mode is not appropriate for industrial implementation but was used here to keep the bioanode at the optimal condition. When the MECs produced 50 to 90 A·m−2the voltage ranged from 1.3 to 1.6 V. These values are far from
the equilibrium cell voltage of 0.123 V in standard conditions for MECs fed with acetate.
The current-potential curve of each electrode was recorded by varying the potential applied at the bioanode and measuring the po-tential of the cathode (Fig. 4). They were recorded at the end of the first MEC run. These curves showed significant overpotential on both the bioanode and the cathode. For instance, with the potential of the bioanode at 0.1 V/SCE, the MEC produced 62 A·m−2under 1.4 V
vol-tage. In this operating condition, the overpotential of both the bioanode and the cathode was around 0.64 V. Improving the electrode kinetics
would consequently be a worthwhile purpose of further research for both the bioanode and the cathode.
For comparison, theoretical bioanode kinetics was plotted with a Nernst-Michaelis-Menten equation (Torres et al., 2008;Rimboud et al., 2015). This equation represents the best kinetics that could be reached by assuming that electron transfer at the electrode surface is fast en-ough to ensure the Nernst equilibrium of the redox species. It showed the large range of improvement that could be gained by improving the bioanode kinetics. Actually, multi-species bioanodes have already proved to be able to generate very high current density with kinetics close to Nernst-Michaelis-Menten type but in solutions of low salinity (Chen et al., 2012;Pocaznoi et al., 2012a;Ketep et al., 2014;Baudler et al., 2015). The bioanodes used here had the great advantage of working in a highly saline medium but their kinetics remain to be im-proved. A gain close to 400 mV might be reached at a current density of the order of 60 A·m−2if we could accelerate the electron transfers. This
shows the great interest of working on the basic understanding of the electron transfer mechanism of halotolerant bioanodes (Grattieri et al., 2017; Grattieri and Minteer, 2018) and the practical ways to apply them (Alkotaini et al., 2018).
Fig. 3. Current density vs. time recorded with the MEC pilot. The bioanode was polarized at 0.1 V/SCE. Current density values were related to the cathode surface
area. Acetate concentration was maintained around 40 mM by daily adjustments except on days 20, 29 and 30.
Fig. 4. Current density vs. potential recorded in the MEC pilot by applying
different potentials at the bioanode. Record was performed at the end of the first run, day 51. The dotted line is the theoretical Nernst-Michaelis-Menten kinetics plotted with Jmax= 65 A·m−2and E1/2= −0.40 V/SCE (Torres et al.,
The energy yield (γG) of an electrolyser whose function is to produce
pure hydrogen is expressed as the ratio of the energy that could be recovered from the hydrogen produced to the electric energy consumed to generate it (Wendt and Kreysa, 1999):
=N G U J H c H G 2 0, 2 (9) where NH2 (mol·s−1·m−2) is the molar flux of hydrogen per unit
cathode surface area, U (V) is the cell voltage, J (A·m−2) is the current
density and ΔG0
c,H2(J·mol−1) is the absolute value of the standard Gibbs
free energy change for hydrogen combustion (237.1 kJ·mol−1).
If hydrogen is intended to be burned, the thermal energy yield (γH)
is assessed by using the standard enthalpy change of hydrogen com-bustion. Moreover, in this case, it may be useful to produce a mix of hydrogen and methane, for instance to be introduced into the gas dis-tribution network. Both methane and hydrogen are used for their heat of combustion. The thermal energy yield γHis consequently calculated
by taking the enthalpies of combustion of both hydrogen and methane into account: = N H +N H U J H c H CH c NH H 2 0, 2 4 0, 4 (10) where ΔH0
c,H2is the absolute value of the standard enthalpy change of
hydrogen combustion (286 kJ·mol−1), ΔH0
c,CH4is the absolute value of
the standard enthalpy change of methane combustion (891 kJ·mol−1), NH2and NCH4(mol·s−1·m−2) are the molar flux of hydrogen and
me-thane per unit cathode surface area.
The energy yield, γG, and the thermal energy yield, γH, were
eval-uated (Table 2) by using the experimental measurement of the whole gas flow rate (Eq.(8)) with a composition of 66% H2, 29% CO2and 5%
CH4, which was representative of the gas produced at high current
density (phase II).
The γGvalues reported for MEC pilots so far range from 0 (complete
transformation to CH4) to 1.2 (Gil-Carrera et al., 2013c) and 1.25 (
San-Martín et al., 2019), with most values around 0.5 to 0.7 ( Carmona-Martinez et al., 2015;Gil-Carrera et al., 2013a;Heidrich et al., 2013;
Luo et al., 2017). Some very high values, up to 7.5, are beyond the scope of MECs because the majority of hydrogen was produced by sugar fermentation in this case (Cusick et al., 2011). Apart from this value, the highest values obtained in MEC pilots, of 1.25 (San-Martín et al., 2019), 1.2 (Gil-Carrera et al., 2013c), 1.03 (Baeza et al., 2017), and 0.69 (Heidrich et al., 2013;Luo et al., 2017), were obtained for current densities significantly lower than those sustained here (< 2 A·m−2).
Here, at current density of 20 A·m−2, hydrogen was produced at a
significant flow rate (114 L·d−1·m−2), with an energy yield γ
G= 0.85.
The energy yield remained above 0.5 at 60 A·m−2. Here, the cathode
current density was considerably increased with respect to those in previous MEC pilots, while keeping energy yield at the same level. These results represent significant progress with respect to the experi-mental state of the art for MEC pilots.
The value of the thermal energy yield, 1.26, at the current density of 20 A·m−2, is encouraging because it is higher than the theoretical
maximum limit of a conventional water electrolysis cell, equal to 1.21. This value confirmed the interest of MECs for producing a mix of me-thane and hydrogen (Geppert et al., 2016;Luo et al., 2017). Never-theless, much room remains for improvement if we are to tend to the theoretical limit value of around 12 (Rousseau et al., 2020).
Two major causes explain the energy loss. On the one hand, when it operated in the range from 20 to 90 A·m−2, the MEC had a cell voltage
of 0.72 to 1.6 V, far from the formal equilibrium cell voltage (0.123 V). When the current density increased, the energy and thermal energy yields decreased significantly, as could be anticipated by glancing at the large overpotentials shown by the current-potential curves (Fig. 4). To produce significant current density, the MEC pilot operated far from the thermodynamic threshold. In this objective, improving the kinetics of both the bioanode and the cathode is an essential challenge. There is great scope for progress in this regard.
4. Mass balance modelling
The theoretical production of the MEC was calculated via the electron balance sheet associated with a simple reactional scheme. Acetate is oxidized at the bioanode:
+ + ++
CH COO3 – 2H O2 2CO2 7H 8e (1)
Hydrogen is produced at the cathode:
+ +
2H O2 2e H2 2OH (11)
Hydrogen can react with CO2in the bulk to give methane:
+ +
4H2 CO2 CH4 2H O2 (12)
Hydrogen can be re-oxidized on the bioanode:
+ +
H2 2H 2e (13)
CO2can be lost by precipitation to carbonate on the cathode
sur-face.
The balance sheet was drawn up on the basis on 1 mol of electrons passing through the electrical circuit. Three unknown parameters are introduced:
- nCH4: the number of moles of CH4produced by reaction of CO2with
H2(Reaction (12)),
- nH2: the number of moles of H2lost by re-oxidation at the anode
(Reaction (13)),
- ncarbo: the number of moles of CO2lost by precipitation to carbonate
at the cathode.
When 1 mol of electrons passes through the circuit:
- (1 − 2nH2) mole of electrons is produced by the oxidation of
acetate,
- (1 − 2nH2) 0.25 mol of CO2is produced at the bioanode (Reaction
(1)), nCH4mole of this CO2is transformed to CH4(Reaction (12)),
and ncarbomole is lost at the cathode, which results in ((1 − 2nH2)
0.25 − nCH4− ncarbo) mole of CO2coming out of the MEC,
- 0.5 mol of H2is produced at the cathode (Reaction (11)), 4nCH4mole
of this H2is converted to CH4, (Reaction (12)) and nH2mole is lost
by oxidation at the bioanode (Reaction (13)), which results in (0.5 − 4nCH4− nH2) mole of H2coming out of the MEC,
- nCH4mole of CH4is produced by the combination of H2with CO2
(Reaction (12)).
The molar flux of each compound produced by a current density equal to J is obtained by multiplying the numbers of moles resulting from the mass balance sheet detailed above (Table 3, first column) by J/
F. Finally, the total molar flux of gas that comes out of the MEC is given
by the sum of all the fluxes (Table 3, last line). The gas composition in percentages is obtained by dividing the molar flux of each compound by
Table 2
Experimental energy and thermal energy yields. QH2and QCH4were calculated
from the experimental correlation (8) with a gas composition of 66% H2, 29%
CO2and 5% CH4.Molar fluxes were calculated by dividing the volume flow
rates, Q, by the molar volume of perfect gas (25.69 L at 313.15 K). U was extracted fromFig. 4, except for 90 A·m−2, which corresponded to day 24 of the
first run. J (A·m−2) Q H2(L·d−1·m−2) QCH4(L·d−1·m−2) U (V) γG(−) γH(−) 20 114.0 8.6 0.72 0.85 1.26 40 267.2 20.2 1.01 0.71 1.05 60 420.3 31.8 1.34 0.56 0.83 90 650.0 49.2 1.6 0.48 0.72
the total gas molar flux (Table 3, second column). The total gas molar flux, equal to J
F(0.75 −
1.5nH2− 4nCH4− ncarbo) (mol·s−1·m−2) gives the overall gas flow rate
related to the cathode surface area Qgas model(L·d−1·m−2) as:
= × ×
Q J
F(0.75 1.5n 4n )V 3600 24
gas model H2 CH4 m (14)
where Vmis the molar volume of a perfect gas (Vm= 24.0 L at 20 °C,
temperature of the measurement).
According to the mass balance sheet above, the anode Faradaic yield related to acetate oxidation is:
= n 1 1 2 H 100 acetate 2 (15)
The theoretical mass balance was used in order to match the ex-perimental data recorded when the highest value of the current density was reached (J = 90 A·m−2) at day 23, phase II of the first run (Fig. 2).
The overall gas flow rate related to the cathode surface area was 985 L·d−1·m−2, the Faradaic yield related to acetate was 107% and the
gas composition 66, 29 and 5% of H2, CO2 and CH4 respectively
(Table 4).
The three unknown parameters (nCH4, nH2, ncarbo) had to be
nu-merically fitted in order to check the capacity of the model to match the experimental data. Firstly, the parameter nH2was set to 0.033 so that
Faradaic yield was equal to 107% (Eq. (15)). This value was kept constant thereafter. Then, the parameter nCH4was set at 0.029 so that
the CH4ratio was equal to 5%. In this case (Case 1 inTable 4) H2and
CO2ratios were 60 and 35%, respectively. These values did not fully
match the experimental data: the H2ratio was lower and the CO2ratio
higher than the measured values. Case 2 was consequently calculated by adjusting the nCH4and ncarboparameters simultaneously. The values nCH4= 0.027 and ncarbo= 0.049 led to a perfect match of the gas
composition. This result points out that the deposit of carbonate on the cathode impacts the overall mass balance.
The overall gas flow rate (Eq. (14)) was slightly higher than the experimental value, but by < 7%. This small increase may be explained
by some leaks, which are difficult to identify technically with the rather low gas production rates given by the MEC.
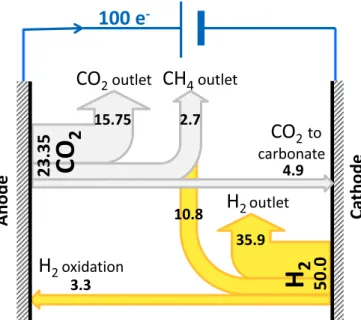
The mass balance model, which includes the deposition of carbo-nates, matches the experimental data. It therefore provides a relevant description of the gas flows within the MEC. On the basis of 1 mol of electrons passing through the electrical circuit, the model shows that 0.5 mol of hydrogen was produced at the cathode, of which 0.108 mol (22%) was consumed to form CH4and 0.033 mol (6.6%) was oxidized
at the cathode (Fig. 5).
Concerning CO2, (1 − 2nH2) 0.25 = 0.2335 mol of CO2was
pro-duced at the anode, of which 0.027 mol (12%) was converted to CH4,
and 0.049 mol (21%) was lost to the cathode deposit. It is well known that cathode deposit is a major issue in MECs because it masks the cathode surface and decreases the hydrogen evolution rate (Sugnaux et al., 2017). Nevertheless, the numerical model pointed out the sig-nificant impact of carbonate deposit on the overall mass balance, to an extent that we had not anticipated before. Actually, this high impact may have been linked to the high current density ensured here by the cathode, which provoked severe local alkalinization of the cathode neighbourhood.
This effect might be seen as virtuous as it tends to decrease the proportion of CO2 in the gas outlet. In contrast, it would be a
dis-advantage if the objective was to produce CH4. Nevertheless, in any
case, carbonate precipitation is detrimental to the cathode performance and would impose periodic cleaning of the cathode surface.
Carbonate deposition also induces the extraction of cations such as Mg2+and Ca2+from the medium, which may have a detrimental
im-pact on the electroactive biofilm. For instance, the uncontrolled current decrease observed from day 37 in the second run, which was repaired by replacing the electrolyte by fresh medium at day 46, may have been due to such depletion of mineral compounds. This hypothesis, which was suggested here by the numerical model, should be checked by experimental measurements in the future. When high current density is sustained at the cathode, the strong local alkalinization may become a major issue to be considered. The key importance of cathode alkalini-sation has already been observed in terms of overpotential (Ruiz et al., 2016), it was shown to be strengthened here because of carbonate de-posit.
The highly saline medium used here was a key to success by
Gas molar flux
(mol·s−1·m−2) Gas composition(%)
CO2 J
F((1 − 2nH2) 0.25 − nCH4− ncarbo) nHnH nCHnCH ncarboncarbo (1 2 2)0.25 4 0.75 1.5 2 4 4 100 H2 J F(0.5 − 4nCH4− nH2) nCH nH nH nCH ncarbo 0.5 4 4 2 0.75 1.5 2 4 4 100 CH4 J FnCH4 nCH nH nCH4 ncarbo 0.75 1.5 2 4 4 100 Total J F(0.75 − 1.5nH2− 4nCH4− ncarbo) 100 Table 4
Experimental and theoretical values of the gas composition, the overall flow rate and the anode Faradaic yield. Experimental data were recorded at J = 90 A·m−2. The mass balance model was run for two cases: Case 1 did not take
carbonate deposit on the cathode into account (nH2= 0.033, nCH4= 0.029 and
ncarbo= 0); Case 2 included carbonate deposit (nH2= 0.033, nCH4= 0.027 and
ncarbo= 0.049).
Experimental values Case 1 Case 2
CO2(%) 29 35 29
H2(%) 66 60 66
CH4(%) 5 5 5
Qgas model(L·d−1·m−2) 985 1131 1051
Φacetate(%) 107 107 107
Fig. 5. Gas balance sheet for the MEC operating at 90 A·m−2. Balance is
pre-sented on the basis of 100 mol of electrons passing through the electrical cir-cuit. The figures in the scheme give the number of moles of each compound in the different fluxes given by the model with nH2= 0.033, nCH4= 0.027 and
ncarbo= 0.049. Table 3
Theoretical molar fluxes and gas composition produced by a MEC. nCH4 is the
number of mole of CH4 produced per mole of electrons passing through the
circuit, and nH2 is the number of mole of H2 lost by re-oxidation at the bioanode
5. Conclusions
A significant step forward has been made here by making a cathode work at 90 A·m−2in a MEC 6 L in volume, and by maintaining the
current density above 50 A·m−2for several weeks. Only one order of
magnitude remains to be gained to bring the technology up to the level of low-cost commercial electrolysers performing water electrolysis. Furthermore, analysis of the results described here show that there is still much room for improvement, particularly by mitigating pH gra-dients in MECs and by working to master the formation phase and to improve the kinetics of halo-tolerant microbial anodes.
Declaration of competing interest
The authors declare that they have no known competing financial interests or personal relationships that could have appeared to influ-ence the work reported in this paper.
CRediT authorship contribution statement
Raphaël Rousseau: Conceptualization, Investigation, Writing
-original draft. Stéphanie F. Ketep: Investigation. Luc Etcheverry: Methodology. Marie-Line Délia: Conceptualization, Validation, Writing - original draft, Supervision, Project administration. Alain
Bergel: Conceptualization, Validation, Writing - original draft, Writing
- review & editing, Supervision, Funding acquisition.
Acknowledgements
This work was part of the “Défi H12” project financially supported by the “Bioénergies” programme of the French “Agence Nationale de la Recherche” (ANR-09-BioE-010 DéfiH12).
References
Alkotaini, B., Tinucci, S.L., Robertson, S.J., Hasan, K., Minteer, S.D., Grattieri, M., 2018. Alginate-encapsulated bacteria for the treatment of hypersaline solutions in microbial fuel cells. ChemBioChem 19, 1162–1169.https://doi.org/10.1002/cbic.201800142. Baeza, J.A., Martínez-Miró, À., Guerrero, J., Ruiz, Y., Guisasola, A., 2017.
Bioelectrochemical hydrogen production from urban wastewater on a pilot scale. J. Power Sources 356, 500–509.https://doi.org/10.1016/j.jpowsour.2017.02.087. Baudler, A., Schmidt, I., Langner, M., Greiner, A., Schroeder, U., 2015. Does it have to be
carbon? Metal anodes in microbial fuel cells and related bioelectrochemical systems. Energy Environ. Sci. 8, 2048–2055.https://doi.org/10.1039/c5ee00866b. Brown, R.K., Harnisch, F., Wirth, S., Wahlandt, H., Dockhorn, T., Dichtl, N., Schröder, U.,
2014. Evaluating the effects of scaling up on the performance of bioelectrochemical systems using a technical scale microbial electrolysis cell. Bioresour. Technol. 163, 206–213.https://doi.org/10.1016/j.biortech.2014.04.044.
Carmona-Martinez, A.A., Trably, E., Milferstedt, K., Lacroix, R., Etcheverry, L., Bernet, N., 2015. Long-term continuous production of H-2 in a microbial electrolysis cell (MEC) treating saline wastewater. Water Res. 81, 149–156.https://doi.org/10.1016/j. watres.2015.05.041.
Chen, S., He, G., Liu, Q., Harnisch, F., Zhou, Y., Chen, Y., Hanif, M., Wang, S., Peng, X., Hou, H., Schröder, U., 2012. Layered corrugated electrode macrostructures boost microbial bioelectrocatalysis. Energy Environ. Sci. 5, 9769–9772.https://doi.org/10. 1039/C2EE23344D.
Chen, J., Xu, W., Wu, X., E, J., Lu, N., Wang, T., Zuo, H., 2019. System development and environmental performance analysis of a pilot scale microbial electrolysis cell for hydrogen production using urban wastewater. Energy Convers. Manag. 193, 52–63. https://doi.org/10.1016/j.enconman.2019.04.060.
Cusick, R.D., Bryan, B., Parker, D.S., Merrill, M.D., Mehanna, M., Kiely, P.D., Liu, G., Logan, B.E., 2011. Performance of a pilot-scale continuous flow microbial electrolysis cell fed winery wastewater. Appl. Microbiol. Biotechnol. 89, 2053–2063.https://doi. org/10.1007/s00253-011-3130-9.
Da Silva, S., Basséguy, R., Bergel, A., 2004. Electrochemical deprotonation of phosphate on stainless steel. Electrochim. Acta 49, 4553–4561.https://doi.org/10.1016/j. electacta.2004.04.039.
Escapa, A., San-Martín, M.I., Mateos, R., Morán, A., 2015. Scaling-up of membraneless microbial electrolysis cells (MECs) for domestic wastewater treatment: Bottlenecks and limitations. Bioresour. Technol. 180, 72–78.https://doi.org/10.1016/j.biortech. 2014.12.096.
Geppert, F., Liu, D., van Eerten-Jansen, M., Weidner, E., Buisman, C., ter Heijne, A., 2016. Bioelectrochemical power-to-gas: state of the art and future perspectives. Trends Biotechnol. 34, 879–894.https://doi.org/10.1016/j.tibtech.2016.08.010. Gil-Carrera, L., Escapa, A., Carracedo, B., Morán, A., Gómez, X., 2013a. Performance of a
semi-pilot tubular microbial electrolysis cell (MEC) under several hydraulic retention times and applied voltages. Bioresour. Technol. 146, 63–69.https://doi.org/10. 1016/j.biortech.2013.07.020.
Gil-Carrera, L., Escapa, A., Mehta, P., Santoyo, G., Guiot, S.R., Moran, A., Tartakovsky, B., 2013b. Microbial electrolysis cell scale-up for combined wastewater treatment and hydrogen production. Bioresour. Technol. 130, 584–591.https://doi.org/10.1016/j. biortech.2012.12.062.
Gil-Carrera, L., Escapa, A., Moreno, R., Moran, A., 2013c. Reduced energy consumption during low strength domestic wastewater treatment in a semi-pilot tubular microbial electrolysis cell. J. Environ. Manag. 122, 1–7.https://doi.org/10.1016/j.jenvman. 2013.03.001.
Grattieri, M., Minteer, S.D., 2018. Microbial fuel cells in saline and hypersaline en-vironments: Advancements, challenges and future perspectives. Bioelectrochemistry 120, 127–137.https://doi.org/10.1016/j.bioelechem.2017.12.004.
Grattieri, M., Suvira, M., Hasan, K., Minteer, S.D., 2017. Halotolerant extremophile bacteria from the Great Salt Lake for recycling pollutants in microbial fuel cells. J. Power Sources 356, 310–318.https://doi.org/10.1016/j.jpowsour.2016.11.090. Guo, K., Prevoreau, A., Rabaey, K., 2017. A novel tubular microbial electrolysis cell for
high rate hydrogen production. J. Power Sources 356, 484–490.https://doi.org/10. 1016/j.jpowsour.2017.03.029.
Heidrich, E.S., Dolfing, J., Scott, K., Edwards, S.R., Jones, C., Curtis, T.P., 2013. Production of hydrogen from domestic wastewater in a pilot-scale microbial elec-trolysis cell. Appl. Microbiol. Biotechnol. 97, 6979–6989.https://doi.org/10.1007/ s00253-012-4456-7.
Heidrich, E.S., Edwards, S.R., Dolfing, J., Cotterill, S.E., Curtis, T.P., 2014. Performance of a pilot scale microbial electrolysis cell fed on domestic wastewater at ambient tem-peratures for a 12month period. Bioresour. Technol. 173, 87–95.https://doi.org/10. 1016/j.biortech.2014.09.083.
Kadier, A., Simayi, Y., Kalil, M.S., Abdeshahian, P., Hamid, A.A., 2014. A review of the substrates used in microbial electrolysis cells (MECs) for producing sustainable and clean hydrogen gas. Renew. Energy 71, 466–472.https://doi.org/10.1016/j.renene. 2014.05.052.
Ketep, S.F., Bergel, A., Calmet, A., Erable, B., 2014. Stainless steel foam increases the current produced by microbial bioanodes in bioelectrochemical systems. Energy Environ. Sci. 7, 1633–1637.https://doi.org/10.1039/c3ee44114h.
Lee, H.-S., Torres, C.I., Parameswaran, P., Rittmann, B.E., 2009. Fate of H-2 in an upflow single-chamber microbial electrolysis cell using a metal-catalyst-free cathode. Environ. Sci. Technol. 43, 7971–7976.https://doi.org/10.1021/es900204j. Liu, H., Grot, S., Logan, B.E., 2005. Electrochemically assisted microbial production of
hydrogen from acetate. Environ. Sci. Technol. 39, 4317–4320.https://doi.org/10. 1021/es050244p.
Luo, S., Jain, A., Aguilera, A., He, Z., 2017. Effective control of biohythane composition through operational strategies in an innovative microbial electrolysis cell. Appl. Energy 206, 879–886.https://doi.org/10.1016/j.apenergy.2017.08.241. Marcus, A.K., Torres, C.I., Rittmann, B.E., 2007. Conduction-based modeling of the
bio-film anode of a microbial fuel cell. Biotechnol. Bioeng. 98, 1171–1182.https://doi. org/10.1002/bit.21533.
Munoz, L.D., Erable, B., Etcheverry, L., Riess, J., Basséguy, R., Bergel, A., 2010. Combining phosphate species and stainless steel cathode to enhance hydrogen evo-lution in microbial electrolysis cell (MEC). Electrochem. Commun. 12, 183–186. https://doi.org/10.1016/j.elecom.2009.11.017.
Nam, J.-Y., Logan, B.E., 2012. Optimization of catholyte concentration and anolyte pHs in two chamber microbial electrolysis cells. In: Int. J. Hydrog. Energy, 2011 International Workshop on Molten Carbonates & Related Topics. 37. pp. 18622–18628.https://doi.org/10.1016/j.ijhydene.2012.09.140.
Oliot, M., Galier, S., Roux de Balmann, H., Bergel, A., 2016. Ion transport in microbial fuel cells: key roles, theory and critical review. Appl. Energy 183, 1682–1704. https://doi.org/10.1016/j.apenergy.2016.09.043.
Oliot, M., Chong, P., Erable, B., Bergel, A., 2017. Influence of the electrode size on mi-crobial anode performance. Chem. Eng. J. 327, 218–227.https://doi.org/10.1016/j. cej.2017.06.044.
Pandey, P., Shinde, V.N., Deopurkar, R.L., Kale, S.P., Patil, S.A., Pant, D., 2016. Recent advances in the use of different substrates in microbial fuel cells toward wastewater treatment and simultaneous energy recovery. Appl. Energy 168, 706–723.https:// doi.org/10.1016/j.apenergy.2016.01.056.
Pant, D., Van Bogaert, G., Diels, L., Vanbroekhoven, K., 2010. A review of the substrates used in microbial fuel cells (MFCs) for sustainable energy production. Bioresour. Technol. 101, 1533–1543.https://doi.org/10.1016/j.biortech.2009.10.017. Parameswaran, P., Torres, C.I., Lee, H.-S., Krajmalnik-Brown, R., Rittmann, B.E., 2009.
Syntrophic interactions among anode respiring bacteria (ARB) and non-ARB in a biofilm anode: electron balances. Biotechnol. Bioeng. 103, 513–523.https://doi.org/ 10.1002/bit.22267.
Pocaznoi, D., Calmet, A., Etcheverry, L., Erable, B., Bergel, A., 2012a. Stainless steel is a promising electrode material for anodes of microbial fuel cells. Energy Environ. Sci. 5, 9645–9652.https://doi.org/10.1039/C2EE22429A.
Pocaznoi, D., Erable, B., Etcheverry, L., Delia, M.-L., Bergel, A., 2012b. Towards an en-gineering-oriented strategy for building microbial anodes for microbial fuel cells. Phys. Chem. Chem. Phys. 14, 13332–13343.https://doi.org/10.1039/C2CP42571H.
minimizing the ohmic drop due to the electrolyte. In counterpart, such saline media are detrimental to the mitigation of the pH gradients by the buffering species (Nam and Logan, 2012; Oliot et al., 2016). Fur-thermore, the buffer capacity of the Starkey medium used here was very low. Considering the importance of the impact of cathode alkalinisa-tion, it would be advisable to increase the buffering c apacity o f the electrolyte as a priority way for future progress (Ruiz et al., 2015).
Rimboud, M., Pocaznoi, D., Erable, B., Bergel, A., 2014. Electroanalysis of microbial anodes for bioelectrochemical systems: basics, progress and perspectives. Phys. Chem. Chem. Phys. 16, 16349–16366.https://doi.org/10.1039/c4cp01698j. Rimboud, M., Desmond-Le Quemener, E., Erable, B., Bouchez, T., Bergel, A., 2015.
Multi-system Nernst-Michaelis-Menten model applied to bioanodes formed from sewage sludge. Bioresour. Technol. 195, 162–169.https://doi.org/10.1016/j.biortech.2015. 05.069.
Roubaud, E., Lacroix, R., Da Silva, S., Bergel, A., Basséguy, R., Erable, B., 2018. Catalysis of the hydrogen evolution reaction by hydrogen carbonate to decrease the voltage of microbial electrolysis cell fed with domestic wastewater. Electrochim. Acta 275, 32–39.https://doi.org/10.1016/j.electacta.2018.04.135.
Rousseau, R., Dominguez-Benetton, X., Délia, M.-L., Bergel, A., 2013. Microbial bioa-nodes with high salinity tolerance for microbial fuel cells and microbial electrolysis cells. Electrochem. Commun. 33, 1–4.https://doi.org/10.1016/j.elecom.2013.04. 002.
Rousseau, R., Santaella, C., Achouak, W., Godon, J.-J., Bonnafous, A., Bergel, A., Delia, M.-L., 2014. Correlation of the electrochemical kinetics of high-salinity-tolerant bioanodes with the structure and microbial composition of the biofilm. Chemelectrochem 1, 1966–1975.https://doi.org/10.1002/celc.201402153. Rousseau, R., Rimboud, M., Delia, M.-L., Bergel, A., Basseguy, R., 2015. Electrochemical
characterization of microbial bioanodes formed on a collector/electrode system in a highly saline electrolyte. Bioelectrochemistry 106, 97–104.https://doi.org/10.1016/ j.bioelechem.2015.06.011.
Rousseau, R., Santaella, C., Bonnafous, A., Achouak, W., Godon, J.-J., Delia, M.-L., Bergel, A., 2016. Halotolerant bioanodes: the applied potential modulates the electro-chemical characteristics, the biofilm structure and the ratio of the two dominant genera. Bioelectrochemistry 112, 24–32.https://doi.org/10.1016/j.bioelechem. 2016.06.006.
Rousseau, R., Etcheverry, L., Roubaud, E., Basséguy, R., Délia, M.-L., Bergel, A., 2020.
Rozendal, R.A., Hamelers, H.V.M., Euverink, G.J.W., Metz, S.J., Buisman, C.J.N., 2006. Principle and perspectives of hydrogen production through biocatalyzed electrolysis. Int. J. Hydrog. Energy 31, 1632–1640.https://doi.org/10.1016/j.ijhydene.2005.12. 006.
Ruiz, Y., Baeza, J.A., Guisasola, A., 2015. Enhanced performance of bioelectrochemical hydrogen production using a pH control strategy. ChemSusChem 8, 389–397. https://doi.org/10.1002/cssc.201403083.
Ruiz, Y., Baeza, J.A., Guisasola, A., 2016. Microbial electrolysis cell performance using non-buffered and low conductivity wastewaters. Chem. Eng. J. 289, 341–348. https://doi.org/10.1016/j.cej.2015.12.098.
San-Martín, M.I., Sotres, A., Alonso, R.M., Díaz-Marcos, J., Morán, A., Escapa, A., 2019. Assessing anodic microbial populations and membrane ageing in a pilot microbial electrolysis cell. Int. J. Hydrog. Energy.https://doi.org/10.1016/j.ijhydene.2019.01. 287.
Selembo, P.A., Merrill, M.D., Logan, B.E., 2009. The use of stainless steel and nickel alloys as low-cost cathodes in microbial electrolysis cells. J. Power Sources 190, 271–278. https://doi.org/10.1016/j.jpowsour.2008.12.144.
Sugnaux, M., Happe, M., Cachelin, C.P., Gasperini, A., Blatter, M., Fischer, F., 2017. Cathode deposits favor methane generation in microbial electrolysis cell. Chem. Eng. J. 324, 228–236.https://doi.org/10.1016/j.cej.2017.05.028.
Torres, C.I., Marcus, A.K., Parameswaran, P., Rittmann, B.E., 2008. Kinetic experiments for evaluating the Nernst-Monod model for anode-respiring bacteria (ARB) in a biofilm anode. Environ. Sci. Technol. 42, 6593–6597.https://doi.org/10.1021/ es800970w.
Wendt, H., Kreysa, G., 1999. Electrochemical Engineering: Science and Technology in Chemical and Other Industries. Springer-Verlag, Berlin Heidelberg.
Microbial electrolysis cell (MEC): strengths, weaknesses and research needs from electrochemical engineering standpoint. Appl. Energy 257, 113938. https://doi.org/ 10.1016/j.apenergy.2019.113938.