HAL Id: hal-01510628
https://hal.archives-ouvertes.fr/hal-01510628
Submitted on 19 Apr 2017
HAL is a multi-disciplinary open access
archive for the deposit and dissemination of
sci-entific research documents, whether they are
pub-lished or not. The documents may come from
teaching and research institutions in France or
abroad, or from public or private research centers.
L’archive ouverte pluridisciplinaire HAL, est
destinée au dépôt et à la diffusion de documents
scientifiques de niveau recherche, publiés ou non,
émanant des établissements d’enseignement et de
recherche français ou étrangers, des laboratoires
publics ou privés.
Spatio-temporal trends in fire weather in the French
Alps
S. Dupire, Thomas Curt, Sylvain Bigot
To cite this version:
S. Dupire, Thomas Curt, Sylvain Bigot. Spatio-temporal trends in fire weather in the French Alps.
Science of the Total Environment, Elsevier, 2017, 595, pp.801 - 817. �0.1016/j.scitotenv.2017.04.027�.
�hal-01510628�
Author version of the article accepted in Science of the Total Environment. The final document is available in Science of the Total Environment Volume 595, Pages 801-817, 2017 :10.1016/j.scitotenv.2017.04.027
Spatio-temporal trends in fire weather in the French Alps
S. Dupirea,∗, T. Curtb, S. Bigotc
aUniversit´e Grenoble Alpes, Irstea, UR EMGR, 2 rue de la Papeterie-BP 76, F-38402 St-Martin-d’H`eres, France bIrstea, UR RECOVER, F-13185 Aix-en-Provence, France
cUniversit´e Grenoble Alpes, IGE, F-38402 Grenoble, France
Abstract
The Alpine area is particularly sensitive to climatic and environmental changes that might impact socio-ecosystems and modify the regime of natural hazards. Among them, wildfire is of major importance as it threatens both ecosystems and human lives and infrastructures. Wildfires result from complex interactions between available vegetation fuels, climate and weather, and humans who decide of the land use and are the main source of fire ignitions.
The changes in fire weather during the past decades are rather unknown in the French Alps especially due to their complex topography. Moreover, local institutions and managers wonder if the ongoing climate changes might increase fire risk and affect the environmental quality and the different ecosystem services provided by the mountain forests.
In this context, we used the national forest fires database together with daily meteorological observations from 1959 to 2015 to investigate the changes in wildfire danger in the French Alps. We analysed the spatial and temporal variations in terms of intensity, frequency, seasonality and window of opportunity of two fire weather indices: the fine fuel moisture code (FFMC) and the fire weather index (FWI) that measure the daily water content of vegetation and the potential intensity of fires, respectively.
Our results showed a major contrast between Southern Alps with a high fire weather danger on average and a significant increase in the past decades, and Northern Alps with low to moderate danger on average that increased only at low elevations. This study contributes to the understanding of the consequences of ongoings climate changes on wildfires in the French Alps. It produced high resolution results that account for the topographic and climatic variability of the area. Finally, the maps of the different fire weather components have practical implications for fire management and modelling and for preventing indirect effects of fires on ecosystems and human assets.
Keywords: Mountain forest, Wildfire, Fire weather, Climate Change, Alps
1. Introduction
Mountains environments are especially sensitive to climatic changes (Pachauri et al.,2014;Kohler et al.,2010;
Beniston,2005). The ongoing changes have already resulted in many impacts on natural hazards in the Alps (Einhorn et al., 2015) including snow conditions and avalanches (Castebrunet et al., 2014; Le Meur et al.,2007), rockfalls (Ravanel and Deline,2011) or debris flows (Jomelli et al.,2004). Forest fires might also be a major hazard and a threat for many mountain ecosystems and human assets in the next decades. Wildfires may disturb plant and fauna communities (Gibson et al.,2016;Moretti et al.,2002) and alter soil stability with implications on water resources (Cerd`a,1998), soil erosion (Pardini et al.,2017;Shakesby et al.,2016) and runoff (Ebel and Moody,2017). They may
∗
Corresponding author at: Irstea, UR EMGR, 2 rue de la Papeterie-BP 76, F-38402 St-Martin-d’H`eres, France Email address: sylvain.dupire@irstea.fr (S. Dupire)
also affect Alpine forests which ensure protection against natural hazards (Dupire et al.,2016b), thus reducing their effectiveness in protecting human stakes which are generally located down slope (Maringer et al.,2016).
Recent investigations have stated the main effects of climate changes in the Alps (Gobiet et al.,2014) and demon-strated an increase of temperature throughout the French Alps, especially since the 1980’s (Dumas,2013). Due to their extension and their topoclimatic complexity, the Alps experience many climatic influences and a strong region-alization of climate. In the French Alps (Fig. 1) the overall annual increase in temperature is about+1°C on the period 1958-2002 (Durand et al.,2009). However, there are strong seasonal (Dumas,2013) and spatial (Durand et al.,2009) variations. Mid elevations (1500-2000 m) and, in a lesser extent, low elevations, exhibited higher increases. Northern Alps showed a higher temperature increase than Southern Alps.
In the conceptual framework described byBradstock(2010), climate is the only biogeographic factor that influ-ences the four ”switches” of fire regimes (e.g. biomass, availability to burn, fire spread and fire ignition). Thus, climate exerts a strong influence on fire activity in the Alps at different spatial and temporal scales. In the long term, it controls the vegetation composition and biomass (Blarquez and Carcaillet,2010). In the short term, it controls vegetation moisture content that drives flammability (Fr´ejaville et al.,2016) and weather conditions that control fire behaviour (Valese et al.,2014). In the classification ofMeyn et al.(2007), the Alpine environments would mostly fit the ”biomass-rich and rarely dry ecosystems” with favourable conditions to fuel growth. Therefore, in the French Alps, the fire regimes are mostly driven by fuel moisture and fire ignition. Thus, surface fires of low-to-moderate intensity are the majority (Valese et al.,2014), while intense crown fires are rare and mostly located in the Southern Alps (Curt et al.,2016). Fire size distribution is very asymmetric with many very small fires (< 1 ha) and few large fires, which generally develop during exceptional droughts like in 2003 (Poumad`ere et al.,2005;Luterbacher et al.,
2004). Fires caused by lightning strikes are infrequent (only 15% of the fires) and mostly concentrated during the summer months (Arndt et al.,2013) at the highest altitudes where they primarily affect conifer forests, generally caus-ing small to medium fires (M¨uller et al.,2015;M¨uller et al.,2013). In contrast, human-caused fires are prevailing and range from small to large fires. They mostly result from human activities (Reineking et al.,2010) and are predominant in winter and summer. In the last decades, new generation of intense wildfires are observed, they are linked to fuel accumulation due to both land abandonment, increase of the human stakes (Wildland-Urban Interfaces) and climate changes (Valese et al.,2014;Lahaye et al.,2014).
Climate-induced changes in wildfire activity and fire regime may affect Alpine territories and assets (Harris et al.,
2016). The increase of temperature and droughts are hypothesized to increase fire frequency and intensity (Arpaci et al.,2013;Wastl et al.,2012), while exceptional droughts or heatwaves like in 2003 promote large and devastative wildfires (Gobron et al.,2005;Poumad`ere et al.,2005;Fink et al.,2004). Seasonal changes in weather conditions can also modify the fire regime in interaction with the use of fire by humans which are the main source of ignitions (Fr´ejaville and Curt,2015).
Few studies exist concerning wildfire hazard in the Alpine region but none focused on the French Alps.Moriondo et al.(2006) included the Mediterranean Alps in their analysis and indicated that global warming would increase the length of the fire season and the probability of extreme meteorological events. In Switzerland,Reinhard et al.(2005) indicated that long episodes without rain and sunshine duration increased since 30 years, thus potentially decreasing the fuel moisture. Reineking et al.(2010) also depicted the increase in the severity and intensity of droughts and of lightning fires. In a study of 25 meteorological stations located throughout the Alps,Wastl et al.(2012) demonstrated that fire danger increased on average since 1951, but with high regional differences.
The overall aim of this study was to bridge the knowledge gaps on climate-fire relationships in the French Alps by jointly analysing fire weather and fire activity. Detecting hotspots of fire weather danger and spatial-temporal trends becoming more conducive to fire is of paramount importance for fire risk assessment and sustainable management of mountain socio-ecosystems. We investigated the climatic changes over the period 1959–2015 in order to determinate: (i) the fire weather hotspots with high fire weather frequency and intensity; (ii) the changes in fire weather along seasons; (iii) the hotspots where fire weather danger is increasing on average and for extreme conditions which promote large and destructive fires.
This approach has scientific and practical implications. First, it enhances knowledge of changing weather condi-tions on different components of fire weather at the regional scale which is a key scale for operational guidelines on the adaptation of forest management to ongoing climate changes and fire impacts. Second, it provides useful information and maps for a better prevention and suppression of fires.
2. Material and methods 2.1. Study area
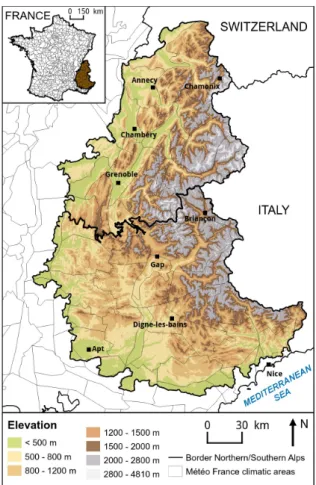
The study area corresponds to the French Alpine area (Fig. 1) as defined by the French Institutions (Decree n°2016-1208). Located at the South-East of France, it represents about 40600 km2 with an elevation ranging from
15 m to 4809 m (Mont-Blanc). This territory is divided into Northern and Southern Alps representing respectively 41% and 59% of the total area. Southern French Alps are marked by a mountain climate with a strong Mediterranean influence (dry summer and wet autumn and winter). Northern Alps are characterized by a mountain climate with degraded oceanic influences (rainfall distributed all the year with summer thunderstorm). Moreover, in both areas, the climate undergoes a strong continental component in the Eastern part (inner Alps) (Joly et al.,2010).
The threshold of 800 m of elevation was chosen in order to differentiate the ecosystems from the sub-montane elevation level (low elevation) with those from the montane and Alpine elevation levels (high elevation) (Ozenda and Wagner,1975). It resulted in a sub-division of the Northern and Southern Alps with low elevation representing 36% of the total area and and high elevations 64%.
Figure 1: Map of the French Alpine area. The border between Northern French Alps and Southern French Alps is delimited with a thick black line. The contours of the M´et´eo France Safran homogeneous climatic zones are shown with a thin black line.
2.2. Climatic data
The climatic data used in this study were taken from the Safran analysis system implemented by M´et´eo France (Vidal et al.,2010). Safran had initially been designed to provide atmospheric forcing data in mountainous areas for avalanche hazard forecasting and was then used to develop a long-term meteorological reanalysis over the French
Alps (Durand et al.,2009). A detailed description of Safran and its application over France is given byQuintana-Segui et al.(2008).
Safran computes, for each climatically homogeneous zone, the vertical profiles of precipitation, temperature, hu-midity, wind speed and cloudiness every day at noon (precipitation) or every 6 h (others variables). For each variable, a first guess of the values along the vertical profiles is predicted from large-scale operational weather prediction model and it is then refined according to surface observations from the M´et´eo France weather stations network. These verti-cal profiles were available for 57 complete years (1959–2015) and for 615 climativerti-cally homogeneous zones covering France (65 zones for the Alpine area) as shown inFig. 1. The daily vertical profiles return the values of the different weather variables with an elevation step of 300 m for each Safran zone.
2.3. Fire weather indices
At local scale and on a daily basis, weather controls the moisture of fuels thus their potential for ignition and propagation of fire. Consequently, many methods and indices have been produced to assess the daily wildfire risk based on meteorological data (Amatulli et al.,2013;Van Wagner,1987).
In this study, we used the Canadian Fire Weather Danger Rating System (CFFDRS) (Van Wagner,1987) defined by six daily meteorological-based indices, each one measuring a different aspect of fire danger. CFFDRS uses three weather variables measured daily at solar noon (temperature, relative humidity and wind speed) together with the precipitation sum of the last 24 h. The first three indices estimate the daily moisture content of vegetation fuels with specific drying rates. The fine fuel moisture code (FFMC) rates the moisture of live fine fuels including grass, fine shrubs and the surface litter (5-10 cm depth). It ranges from 0 to 100, and it evaluates the ease of ignition of these light fuels. FFMC is especially fitted for detecting rapid and short-duration changes in fine fuel moisture, which often occur in mountains. The duff moisture code (DMC) rates fuel moisture in medium sized surface fuels and in loosely compacted duff (10-20 cm depth). It evaluates the ease of ignition of the light duff and medium fuels (range 0 - ∞). The drought code (DC) is for the deep and compact organic layers, in which fire can smoulder. It estimates if deep duff can ignite, and the mop-up difficulty (range 0 - ∞). Strong increase of DC indicates that severe droughts and heats were established for weeks. As these indices have specific drying rates, they have specific time-lag constants: 16 h for FFMC, 12 days for DMC, and 52 days for DC.
The other three indices indicate the potential fire behaviour. The initial spread index (ISI) combines FFMC and wind speed to estimate the fire spread rate in light fuels in case of ignition. The build-up index (BUI) is a weighted combination of DMC and DC which indicates the total amount of fuel available for consumption. Finally, the fire weather index (FWI) is a combination of ISI and BUI which evaluates the fire-front intensity, and is generally used for public information about fire danger conditions (Van Wagner,1987).
As recommended inLawson et al.(2008), the presence of snow has to be taken into account for the calculation of CFFDRS indices in mountain areas. Safran dataset provides the total daily amount of precipitations as well as the distribution between the solid (snow or hail) and liquid (rain) phases. Therefore, in this study, the total amount of precipitation (including snow) was used to calculate FFMC, DMC and DC and FWI values were set to zero in presence of snow.
All CFFDRS indices were computed and their ranges of variation and statistical links with fire activity were compared. We finally focused on FWI and FFMC that performed better than the others indices, thus fitting with the results ofViegas et al.(2000) in Southern Europe andSchunk et al. (2017) in German forests. Moreover, the two indices are complementary as FWI is very integrative and indicates well the overall fire danger and the potential intensity of fire. FFMC detects minor changes in fuel moisture content of surface fuels which are the first most likely to ignite in the Alpine environments and to burn in the predominant surface fires.
2.4. Analysis of the national forest fire databases and fire danger assessment
Fire recording practices are heterogeneous in France which led us to use two different fire databases. In the Mediterranean area, subjected to many fires, the authorities launched in 1973 the Prom´eth´ee(2017) database. It includes all the Southern Alps area and gathers the wildland and forest fires with an indication of the date, hour, size, and location on a 2×2 km grid.
In other parts of France, the authorities started to record wildland and forest fires much later in the national forest fire database calledBDIFF(2017) which has exactly the same structure as Prom´eth´ee. The fire recording history is therefore much more recent. In Northern Alps, the oldest record dates back to 2006.
The objectives of the analysis of the national forest fire databases were first to study the spatial and monthly distributions of the fire records across the French Alps and second to define different fire weather danger from the weather observations on fire days. The annual fire density was first computed for all the French Alps with a resolution of 2 km × 2 km taking into account the two different fire recording periods. The average number of fires registered per month was then analysed distinguishing Northern Alps and Southern Alps.
Several thresholds of fire weather indices have been proposed initially in Canada to indicate the level of fire danger and the potential intensity of fire. These thresholds are commonly acknowledged as correct and are used worldwide in boreal (Flannigan et al.,2016), tropical (de Groot et al.,2005) or Mediterranean regions (Bedia et al., 2013). However, they generally need to be fine-tuned to adapt to local conditions (Ven¨al¨ainen et al.,2014). For this reason, we calculated both FWI and FFMC based on the weather observations from Safran for each fire record according to their date, elevation and location. The empirical distribution function for both FWI and FFMC values observed on fire days were then computed at the Northern Alps and Southern Alps levels.
Four fire weather dangers were then defined for each index according to the mean value of the 50th, 75thand 90th percentiles of the two regions. Values below the 50thpercentile were defined with a low fire weather danger, those in the range 50th-75th percentiles with a moderate danger, 75th-90thwith a high danger and above 90thwith an extreme fire weather danger. These threshold values were used in the following steps of the study in order to address different fire weather dangers.
2.5. Fire weather components
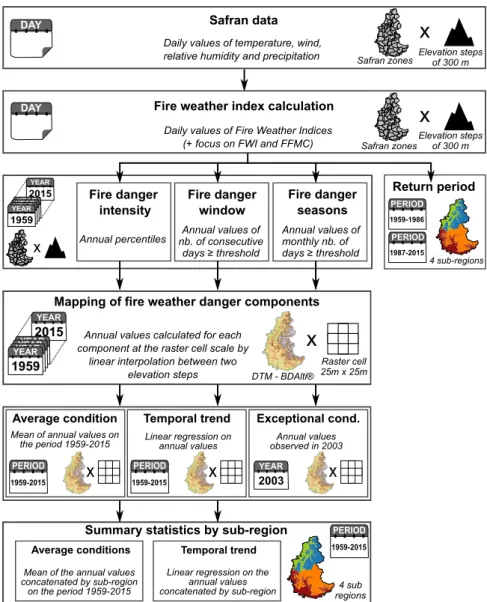
For each elevation step (300 m) of each 65 Safran zone, we calculated the daily values of the different CFFDRS indices from 01 January 1959 to 31 December 2015. It resulted in 11.2 millions of daily values covering 57 complete years. The main components of fire weather danger were derived from these daily values and investigated in both space and time (Fig. 2).
2.5.1. Intensity of fire weather
The intensity of fire weather is hereafter called the fire weather danger. It was assessed using the annual absolute values taken by FWI and FFMC for three different percentiles of annual values (95th, 75th and 50th). For each per-centile, the average value observed on the period 1959–2015 was calculated in order to determinate the fire weather danger on average climatic conditions. The annual values observed on the year 2003 were also extracted in order to determinate the fire weather danger during exceptional drought year (Poumad`ere et al.,2005). Finally, the linear temporal trends for the three percentile levels were investigated.
2.5.2. Length of the fire weather window
The fire weather window (FWW) is defined by the number of consecutive days with a defined fire weather danger. It indicates the annual maximum duration of the period according to a gradient of favourable meteorological conditions (from moderate to extreme fire weather danger). A high FWW value indicates a long time period during which there is a greater likelihood that multiple fires occur, thus increasing the difficulty of suppression for firemen. The FWW was investigated for both FWI and FFMC and for the three highest fire weather dangers defined atsection 2.4. As for the fire weather intensity, we calculated the FWW for average climatic conditions and exceptional climatic conditions and we investigated the linear temporal trend over the period 1959–2015.
2.5.3. Monthly analysis of the fire weather
Wildfires can be ignited throughout the year by humans or lightening strikes in the Alps and it is of importance to know what is the period with favourable meteorological conditions for the fires. This point was investigated following the number of days (not necessarily consecutive) per month with a defined fire weather danger. As for the FWW, the thresholds corresponding to the three highest fire weather dangers defined atsection 2.4were used. The number of days per month was first computed for each year of the period 1959–2015 before calculating the mean number of days per month observed considering the whole time period.
Finally, the linear temporal trends over the period 1959–2015 in the monthly number of days of each one of the fire weather danger were analysed.
x
Safran data
Daily values of temperature, wind, relative humidity and precipitation
Fire weather index calculation
Daily values of Fire Weather Indices (+ focus on FWI and FFMC)
Fire danger intensity Annual percentiles Fire danger window Annual values of nb. of consecutive days ≥ threshold Fire danger seasons Annual values of monthly nb. of days ≥ threshold
Mean of annual values on the period 1959-2015
Average condition
Mapping of fire weather danger components
x
DAY 2015 YEAR 1959 YEAR 1959 YEAR 1959 YEAR 1959 YEAR 2015 YEAR 1959 YEAR 1959 YEAR 1959 YEAR 1959 YEAR 1959-2015 PERIOD 2003 YEAR 1959-1986 PERIOD Temporal trend Return period DAYx
x 1987-2015 PERIODSafran zonesElevation stepsof 300 m
Safran zonesElevation stepsof 300 m
4 sub-regions
Annual values calculated for each component at the raster cell scale by
linear interpolation between two
elevation steps DTM - BDAlti®
Raster cell 25m x 25m Exceptional cond. Annual values observed in 2003 Linear regression on annual values
x
x
x
Summary statistics by sub-region
4 sub regions
Average conditions Temporal trend
Mean of the annual values concatenated by sub-region
on the period 1959-2015
Linear regression on the annual values concatenated by sub-region 1959-2015 PERIOD 1959-2015 PERIOD
Figure 2: Workflow chart of the spatio-temporal analysis. Calendar icons and map icons indicate respectively the time and the spatial scales of analysis for each step of the work.
2.5.4. Return period
The return period, or the recurrence interval is an estimate of the likelihood of an event to occur which is commonly used in natural hazard assessment (Jomelli et al.,2004). It estimates the frequency of different fire weather danger. In our study, the return period was calculated using the generalized extreme value (GEV) distribution (Coles et al.,2001) as proposed byWastl et al.(2012). For both FWI and FFMC, the time series of daily values were used to compute the probability distribution of extreme events using the R package extRemes (Gilleland and Katz,2016). The computation gave the return level (e.g., a FWI or FFMC value) associated to a given return period, e.g. the number of years to wait to observe the same or a greater index value. To investigate temporal trends in the return period we divided the observations into two sub-periods of 28 (1959-1986) and 29 (1987-2015) years.
2.6. Mapping and statistical analysis
In mountain areas, the fire weather danger may be spatially heterogeneous, especially due to variation of elevation (Moriondo et al.,2006) and to topoclimates (Wastl et al.,2012). The Safran dataset used in this study already integrates
topoclimates by dividing the French Alpine area into 65 homogeneous climatic zones. The elevation issue was dealt combining the elevation step of 300 m of Safran zone with the BD Alti®, a digital elevation model (DTM) provided by the French National Institute of Geographic and Forest Information (IGN) with a 25m × 25m resolution.
2.6.1. Fire weather component mapping
Each fire weather component was first annually calculated for each Safran zone and each elevation as described insection 2.5. These annual components were then computed for each raster cell of 25m × 25m according to the elevation and the Safran zone of the cell. The component value of the cell was calculated by linear interpolation between the values with a 300 m step of elevation given by the Safran zone. As example, if a raster cell had an elevation of 700 m, we did a linear interpolation between the two component values of the Safran zone corresponding to 600 m and 900 m.
The mean fire weather danger component observed on the period 1959–2015 were then calculated for each raster cell from the annual rasters in order to produce a map of the component on average climatic conditions. The raster maps corresponding to the year 2003 were used to illustrate exceptional climatic years. Finally, the linear temporal trends were computed for each raster cell using a linear regression over annual values of the fire weather component. 2.6.2. Regional statistics
To facilitate and summarize the analysis over the French Alps, we divided the area into four regions according to the latitude (Northern Alps/ Southern Alps) and the elevation (Low / High). The border between Northern and Southern Alps was used for the latitude splitting. The threshold value for the elevation was 800 m as explained in
section 2.1.
The summary statistics by region were obtained with the following steps. First, the annual fire weather component values were calculated by averaging the values observed for each raster cell corresponding to the region. Second, the mean component value over the period 1959–2015 (average climatic conditions), was calculated from annual values. Finally, the linear temporal trends were computed for each region using a linear regression over mean regional annual values of the fire weather danger component.
3. Results
3.1. Analysis of fire records
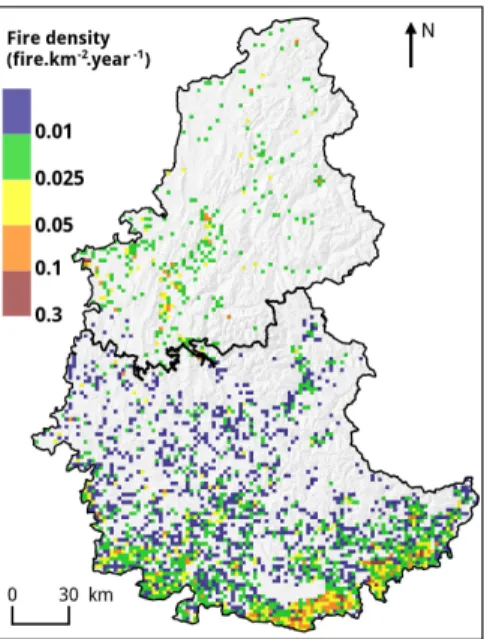
5731 fires (since 1973) have been recorded in the South and 413 fires (since 2006) in the North, although, for both areas, the recordings might not fully exhaustive. Once normalized to the same time period and the same area, we observed five times as many fires in the South (7·10−3fires·year−1·km−2) as in the North (1.4·10−3fires·year−1·km−2).
The mean annual burnt area was 80 ha·year−1(55% in summer) in the North and 938 ha·year−1(70% in summer) in
the South.
Fig. 3shows the location and density of the forest fires recorded in the National databases across the French Alpine area. Independently of the latitude, 75% of the fires were located at low elevations (≤ 800 m). Both areas showed a bimodal repartition of fire frequency with two peaks of fire activity rather similar: one centred on March, and one centred on July/August (Fig. 4.a). The first period is mostly characterized by small vegetation fires due to agriculture and management of vegetation (shrub clearing and burning of vegetation residues). These winter fires burning during periods with moderate FFMC and low FWI values generate low-intensity surface fires. The second period corresponds to the summer with fires covering larger areas. These summer fires happen with low fuel moisture and dry weather that promote high-intensity fires.
The fire weather indices were calculated for each historical fire record in order to determinate different fire weather danger. Fig. 4.bandFig. 4.cshows the Empirical Cumulative Density Functions (ECDF) according to the values observed for FWI and FFMC on fire days. Lower FWI values were observed on the fire days in the Northern Alps compared to Southern Alps while FFMC values were quite similar for both areas. Three different thresholds indicating four fire weather dangers were calculated from the ECDF curves. They were characterized by the average values of each index corresponding to the 50th, 75thand 90thpercentiles, standing respectively for moderate (FWI ∈ [10.5-21.5[
; FFMC ∈ [88.1-90.5[), high (FWI ∈ [21.5-34.5[ ; FFMC ∈ [90.5-92.3[) and extreme (FWI ≥ 34.5 ; FFMC ≥ 92.3) fire weather dangers. These values are similar to FFMC and FWI values encountered in literature for the Mediterranean area (Bedia et al.,2013;Moriondo et al.,2006).
Figure 3: Map of the fire density computed from BDIFF and Prom´eth´ee fire databases. Resolution: 2 km × 2 km.
Months
a. Number of fires per month
10 21.5 34.5 0 25 50 75 90 100 0 10 20 30 40 50 60 70 80 90 FWI Cum ulativ e probability Low Mod. High Ext. b. FWI [10 − 21.5 − 34.5] 88.1 90.5 92.3 70 73 76 79 82 85 88 91 94 97 100 FFMC c. FFMC [88.1 − 90.5 − 92.3]
Northern Alps (413 fires) Southern Alps (5731 fires) J F M A M J J A S O N D 26 24 22 20 18 16 14 12 10 8 6 4 2 0 ≥10 ha 1-10 ha <1 ha Numbe r of fires [an -1]
Figure 4: Distribution of the average annual number of fire records per month observed in the databases (a.) and Empirical Cumulative Density Function (ECDF) of FWI (b.) and FFMC (c.) values measured at the different dates and locations of the fire records. Figures between hook brackets in the title of (b.) and (c.) indicate the thresholds values for moderate, high and extreme fire weather danger.
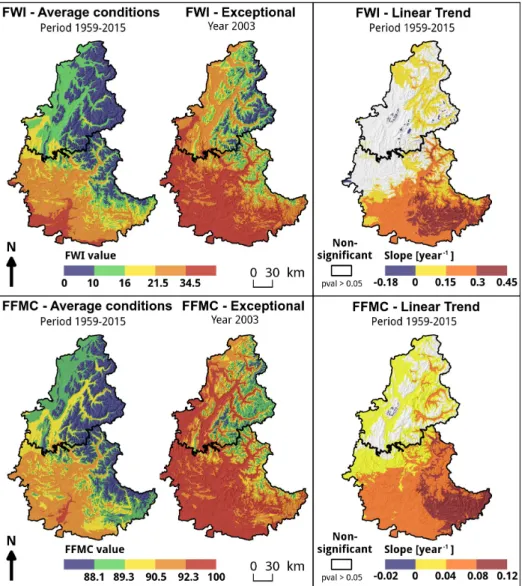
3.2. Intensity of fire weather
Fig. 5shows the intensity of the fire weather danger (annual 95thpercentile) and the linear temporal trends of the
fire weather indices during the period 1959–2015. In the Northern Alps, mean index values indicated a moderate fire weather danger at low elevations (≤ 800 m) and a low fire weather danger at higher elevations. In average conditions, the fire weather danger regarding any index was therefore low to moderate. In exceptional conditions (year 2003), it increased significantly at any elevation. A high fire weather danger was reached in the foothills (+100-150%) and a moderate danger between 800 m and 1800 m (+50-100%). Above 1800 m the rise was in the same range, although the fire weather danger remained low. Finally, FFMC and, to a lesser extent FWI, showed a positive linear trend in most of the low elevations of Northern Alps indicating an increase of the average fire weather danger. Non-significant trend was observed at higher elevations except for some Prealps mountains such as Chartreuse and Belledonne where
a light negative trend was detected. Percentile North Elevation ≤ 800 m North Elevation > 800 m South Elevation ≤ 800 m South Elevation > 800 m
M ± Sd Trend M ± Sd Trend M ± Sd Trend M ± Sd Trend
FWI 95th 14.1 ± 4 57* 7.8 ± 2.2 13 31 ± 6.4 202** 17.2 ± 4.9 163** 75th 4.3 ± 1.8 20 1.7 ± 0.8 5 15.1 ± 4 103** 6.7 ± 2.5 77** 50th 0.6 ± 0.3 3 0.3 ± 0.1 0 4.9 ± 1.8 34* 1.7 ± 0.9 25** FFMC 95th 89.2 ± 1 26** 87.7 ± 0.9 14 91.3 ± 1.2 55** 89.2 ± 1.2 59** 75th 84.1 ± 1.6 21 80.5 ± 2.5 -8 88.4 ± 1 43** 85.7 ± 1.5 49** 50th 70.5 ± 4.8 31 61 ± 5.9 -58 83.6 ± 1.9 37* 76.5 ± 3.9 72*
M and Sd are without unit. Trend unit is 10−3·year−1 Signif. codes: **: p-value≤0.001, *: p-value≤0.05
Table 1: Average period value (M), standard deviation (Sd) and linear temporal trend of FWI and FFMC observed during the period 1959–2015 for different percentiles of annual values and for the 4 sub-regions of the French Alps.
In the Southern Alps, mean index values indicated high to extreme fire weather danger at low elevations (≤ 800 m) and moderate at higher elevations. In average conditions, the fire weather danger regarding any index was therefore moderate to high. In exceptional conditions, it increased significantly at any elevation to reach a high or extreme danger in most of the area. Average raise was between+20% and +50% on extreme year except for the South-East with an increase between+50% and +100%. Finally, in most of the Southern Alps, positive temporal trends were observed on the period 1959–2015 regarding the 95th percentile annual values of FWI and FFMC with a positive gradient from North-West to South-East.
Average values and linear temporal trends were also analysed for the annual 50th and 75th percentiles for both
FWI and FFMC indicesTable 1. The same areas appeared with non-significant trends independently of the percentile. However, when significant, the trends were more pronounced for higher percentiles.
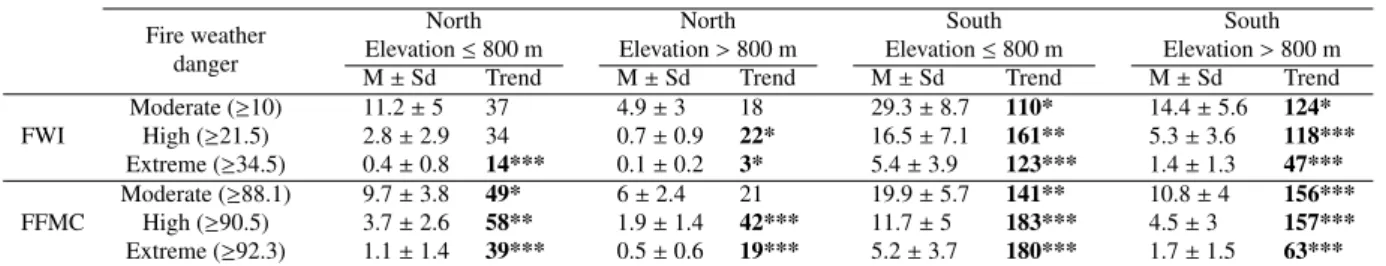
3.3. Length of the fire weather window
The FFW was studied for both FWI and FFMC indices (Fig. 6andTable 2).
Fire weather danger North Elevation ≤ 800 m North Elevation > 800 m South Elevation ≤ 800 m South Elevation > 800 m
M ± Sd Trend M ± Sd Trend M ± Sd Trend M ± Sd Trend
FWI Moderate (≥10) 11.2 ± 5 37 4.9 ± 3 18 29.3 ± 8.7 110* 14.4 ± 5.6 124* High (≥21.5) 2.8 ± 2.9 34 0.7 ± 0.9 22* 16.5 ± 7.1 161** 5.3 ± 3.6 118*** Extreme (≥34.5) 0.4 ± 0.8 14*** 0.1 ± 0.2 3* 5.4 ± 3.9 123*** 1.4 ± 1.3 47*** FFMC Moderate (≥88.1) 9.7 ± 3.8 49* 6 ± 2.4 21 19.9 ± 5.7 141** 10.8 ± 4 156*** High (≥90.5) 3.7 ± 2.6 58** 1.9 ± 1.4 42*** 11.7 ± 5 183*** 4.5 ± 3 157*** Extreme (≥92.3) 1.1 ± 1.4 39*** 0.5 ± 0.6 19*** 5.2 ± 3.7 180*** 1.7 ± 1.5 63*** M and Sd units are days. Trend unit is 10−3·day·year−1
Signif. codes: ***: p-value ≤ 0.001, **: p-value ≤ 0.01, *: p-value ≤ 0.05
Table 2: Fire weather windows for three different fire weather danger. Mean (M), standard deviation (Sd) and linear temporal trends (Trends) are given for the period 1959–2015 and for each subregion of the French Alps. Bold values indicate significant temporal trends.
The FWW for a moderate to extreme fire weather danger (Fig. 6) was relatively short in Northern Alpine low elevations (about 10 days for both indices) and very short at higher elevations (about 5 days for both indices) during an average year. This partly explained the low occurrence of big fires in this part of the area. In the Southern Alps, the FWW was much longer with at least 20 consecutive days at low elevations (29 days for FWI) and 10 consecutive days at highest elevations (14 days for FWI). During an extreme year such as 2003, the FWW increased by 4 to 8 days regardless of the area.
The linear temporal trends of FWW for FFMC over the period 1959–2015 (Table 2) were positive in all parts of the French Alps, and so independently of the fire weather danger, except for moderate danger at high elevations of the North. The trend was however more pronounced in Southern Alps especially for high fire weather danger. This indicates an increase of the period favourable to surface fire in all the French Alps. The temporal trends regarding FWI were non-significant in Northern Alps for moderate to high fire weather danger. They were lightly positive for
Figure 5: Maps of the intensity of the fire weather observed during the period 1959–2015. The annual values considered in these maps were annual 95th percentile values observed for each raster cell. Average conditions stand for the average of the annual values observed on the period 1959– 2015. Exceptional values correspond to the annual values observed in the dry year 2003. The temporal trends observed on the period 1959–2015 were mapped on the right column for each index. Significant trends (p-value ≤ 0.05) are shown using colors, non significant trends are shown in white.
extreme fire weather danger although the FWW for such events remained very short. However in Southern Alps, the temporal trends were marked for all fire weather dangers.
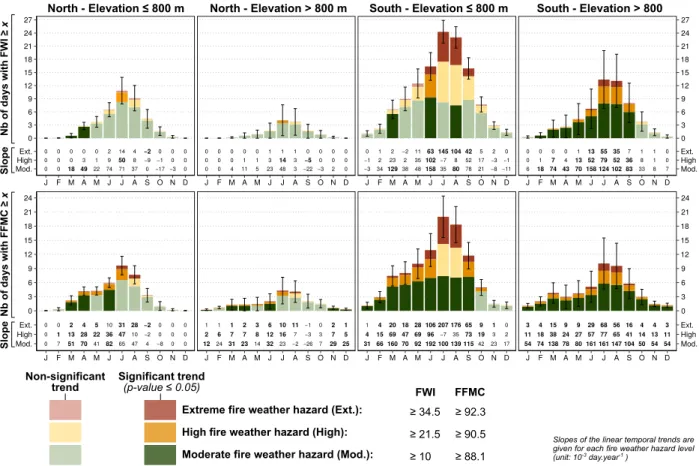
3.4. Seasonal variations of fire weather
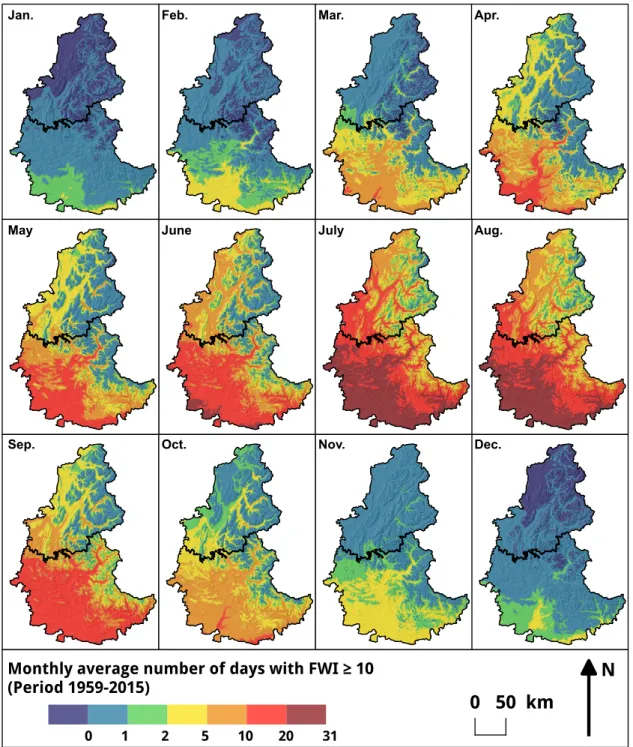
The seasonal variations of fire weather were analysed regarding the number of days per month with a moderate to extreme fire weather danger, for each month of the year and for FWI and FFMC (Fig. 7andAnnexes A.1, A.2, A.3
and A.4). The linear temporal trends considering the number of days by month for each year of the period 1959–2015 were also analysed.
Regarding FWI (Fig. 7andAnnexes A.1,A.2), the first days with moderate or higher fire weather danger appeared earlier on average in the Southern Alps (March at low elevations, July in high) than in Northern Alps (April at low elevation, July in intermediate, no start in high elevations). In average, for the North and for high elevations of the
Figure 6: Maps of the average fire weather window FWW for moderate to extreme fire weather danger (FWI≥10 and FFMC≥88.1) observed during the period 1959–2015. Average conditions stand for the average number of days above the threshold observed on the period 1959–2015. Exceptional values correspond to the dry year 2003. The temporal trend of the annual FWW values observed on the period 1959–2015 is mapped on the right column for each index. Significant trends (p-value ≤ 0.05) are shown using colors, non significant trends are shown in white
South, the last days with moderate or higher fire weather danger were in October while they lasted one month more in intermediate elevation and two months more in low elevations in the South. The temporal trends underlined an earlier start of the fire weather danger in most of the Southern Alps and in some Northern valleys. However, the trend was not significant regarding the last day with fire weather danger for FWI regardless of the latitude except a negative trend in the Northern mountains in September. Summer fire weather presented a positive trend for the Southern Alps for all fire weather dangers.
Regarding FFMC (Fig. 7andAnnexes A.3,A.4), the first days with moderate or higher fire weather danger started at the same time at low elevations in both areas (March) but earlier at high elevations in the South (April - June) than in the North (June - July). It lasted until October in Southern Alps and in the valleys in the Northern inner Alps while it ended in September for the rest of the Northern Alps. The temporal trends were characterized by an earlier start in most Alps and a later ending for all the inner Alps (Eastern Alps). More generally, the temporal trends regarding FFMC were more marked than for FWI especially in high elevations in the South where all months presented an
0 0 0 0 0 0 0 0 18 0 3 49 0 1 22 2 9 74 14 50 71 4 8 37 −2 −9 0 0 −1 −17 0 0 −3 0 0 0 Mod.High Ext. 0 3 6 9 12 15 18 21 24 27 J F M A M J J A S O N D 0 0 0 0 0 0 0 0 4 0 1 11 0 1 5 1 3 23 1 14 48 1 3 3 0 −5 −22 0 0 −3 0 0 2 0 0 0 J F M A M J J A S O N D 0 −1 −3 1 2 34 2 23 129 −2 2 38 11 35 48 63 102 158 145 −7 35 104 8 80 42 52 78 5 17 21 2 −3 −8 0 −1 −11 J F M A M J J A S O N D 0 0 6 0 1 18 0 7 74 0 4 43 1 13 70 13 52 158 55 79 124 35 52 102 7 36 83 1 8 33 1 1 8 0 0 7 Mod.High Ext. 0 3 6 9 12 15 18 21 24 27 J F M A M J J A S O N D 0 0 0 0 1 7 2 13 51 4 28 70 5 22 41 10 36 82 31 47 65 28 10 47 −2 −2 4 0 0 −8 0 0 0 0 0 0 Mod.High Ext. 0 3 6 9 12 15 18 21 24 J F M A M J J A S O N D 1 2 12 1 6 24 1 7 31 2 7 23 3 8 14 6 12 32 10 16 23 11 7 −2 −1 −3 −26 0 3 7 2 7 29 1 5 25 J F M A M J J A S O N D 1 4 31 4 15 66 20 69 160 18 47 70 28 69 92 106 96 192 207 −7 100 176 35 139 65 73 115 9 19 42 1 3 23 0 2 17 Mod.High Ext. 0 3 6 9 12 15 18 21 24 J F M A M J J A S O N D 3 11 54 4 18 74 15 38 138 9 24 78 9 27 80 29 57 161 68 77 161 56 65 147 16 41 104 4 14 50 4 13 54 3 11 54 J F M A M J J A S O N D
North - Elevation ≤ 800 m North - Elevation > 800 m South - Elevation ≤ 800 m South - Elevation > 800
Nb of day s with FFMC ≥ x
Nb of days with FWI
≥ x Slope Slope Non-significant trend
Extreme fire weather hazard (Ext.): High fire weather hazard (High): Moderate fire weather hazard (Mod.): Significant trend (p-value ≤ 0.05) FWI FFMC ≥ 34.5 ≥ 21.5 ≥ 10 ≥ 92.3 ≥ 90.5 ≥ 88.1
Slopes of the linear temporal trends are given for each fire weather hazard level (unit: 10-3 day.year-1 )
Figure 7: Average monthly number of days according to the fire weather danger regarding FWI and FFMC on the period 1959–2015. Dark color indicates a significant trend over the period, light color a non-significant trend. The slope of the linear trend for each fire weather danger are indicated under each barplot, bold values indicating significant trends (p-value ≤ 0.05). Slope unit is 10−3·day·year−1. Error bars correspond to the standard deviation for the monthly number of days considering moderate to extreme fire weather danger.
increasing trend regardless the fire weather danger.
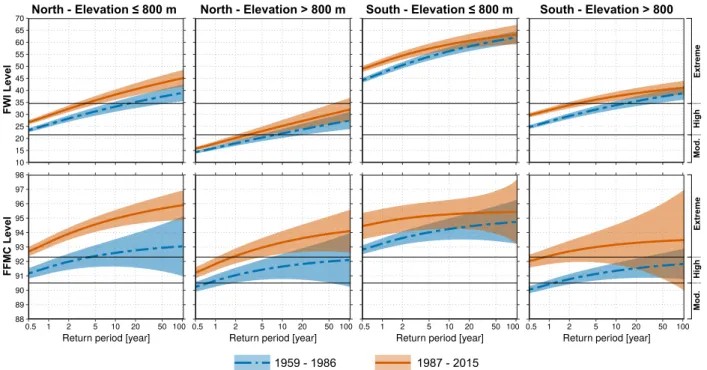
Both FWI and FFMC trends underlined a rise of the number of days with a moderate to extreme fire weather danger for almost all months in the French inner Alps (Eastern Alps) and especially from November to December. 3.5. Return period
Extreme values statistics were used to calculate return periods of extreme FWI and FFMC values in 4 sub-regions (Fig. 8). Whatever the subregion or the index, the analysis underlined shorter return periods in the most recent time period. Regarding FWI, extreme fire weather danger (FWI>34.5) presented a return period lower than 1 year for low elevations in the South. Its return period for low elevations in the North and high elevation in the South were close, with respectively 3.5 years and 2.6 years for 1987-2015, 16.5 years and 13 years for 1959-1986. Therefore, in the recent period, the chance to have important crown fires increased by a factor 5 in these subregions. Finally in high elevations of the North, high fire weather danger was the most critical level reached with a return period of 3 years for 1987-2015 and 8 years for 1959-1986. Therefore, the chance to have a high danger increased by a factor 2.7 in this subregion.
Concerning FFMC, extreme fire weather danger (FFMC>92.3) presented a return period lower than 2 years for high elevations of the North and lower than 1 year for the others subregions for the recent period. This hazard level had a much longer return period in high elevations (> 100 years) and in low elevations of the North (> 5 years) in the period 1959-1987. This indicated drier moisture rates of fine fuel material in the recent years and by extension a higher probability of surface fires occurrence in these areas.
10 15 20 25 30 35 40 45 50 55 60 65 70 88 89 90 91 92 93 94 95 96 97 98 0.5 1 2 5 10 20 50 100
Return period [year] 0.5 1 Return period [year]2 5 10 20 50 100 0.5 1 Return period [year]2 5 10 20 50 100 0.5 1 Return period [year]2 5 10 20 50 100
North - Elevation ≤ 800 m North - Elevation > 800 m South - Elevation ≤ 800 m South - Elevation > 800
FFMC Le vel FWI Level 1959 - 1986 1987 - 2015 Mod. High Extreme Mod. High Extreme
Figure 8: Generalized extreme value return level plots for FWI and FFMC in the 4 Alpine subregions. The solid orange line refers to the period 1987-2015, the dashed blue line to the period 1959-1986. Shading indicates the respective 95% confidence intervals. Black horizontal lines represent the threshold value for high (lower line) and extreme (upper line) fire weather danger.
4. Discussion
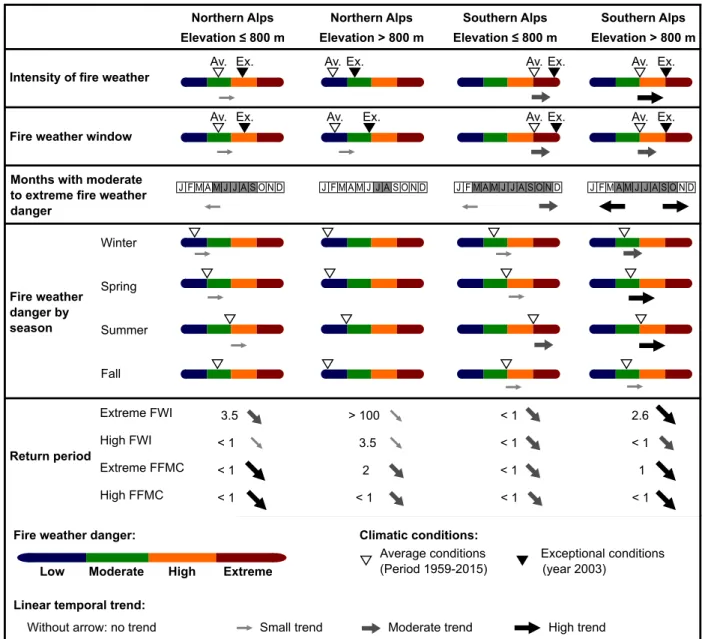
4.1. Ongoing changes in fire weather in the French Alps
This study highlighted several ongoing changes in fire weather in both spatial and temporal dimensions (summa-rized inFig. 9). Thus, three main hotspots of fire danger were identified across the French Alps but also some areas with low and stable fire weather danger. The most critical hotspot concerns the high elevations and inner valleys of Southern Alps which suffered a significant increase for all components of fire weather over the past decades. In average climatic conditions, the fire weather danger was moderate in the 1960’s and it is nowadays high. In addition, the FWW and the length of the period with a moderate or higher fire weather danger also increased significantly and extreme fire weather dangers are more and more common. Our results are consistent with previous studies (Ruffault et al.,2016;Durand et al.,2009) that demonstrated this part of France suffered one of the most important temperature increase in the past-decades with a trend that should continue during the 21stcentury (Gobiet et al.,2014).
The second hotspot corresponded to low elevations of Southern Alps which are the most prone to intense fires due to Mediterranean influence that combines high temperature and long summer period without rainfall. In this region, all fire weather components reached the highest values observed in the French Alps (Fig. 9). However, this point has to be tempered given that the fire weather danger was already high and increased moderately in the past decade compared to the first hotspot. Moreover, in this area, people are used to forest fires and fire-fighting is quite developed and performing (Curt et al.,2016;Lahaye et al.,2014) which can mitigate the ongoing trends in fire weather.
The last critical hotspot was located in the low elevations of Northern Alps. In this area, on average climatic conditions, fire weather danger is low to moderate and wildfires are rare and generally small making fire suppression easy. Beside this “ordinary” fire activity, the fire weather reached a high danger during the 2003 exceptional drought which was marked by several large fires. The analysis underlined a rise in the frequency of such exceptional climatic conditions which might produce more large crown fires in the next decades. In addition to the frequency of extreme events, all other fire weather components showed a slight increase over the past decades in this area.
Despite these three hotspots, some parts of the French Alps remain with a low and stable fire weather danger. These areas are located in the high elevations (> 800 m) of Northern Alps which are characterized by cool temperatures and
Northern Alps Elevation ≤ 800 m Northern Alps Elevation > 800 m Southern Alps Elevation ≤ 800 m Southern Alps Elevation > 800 m Intensity of fire weather
Fire weather window Months with moderate to extreme fire weather danger
Fire weather danger by season
Return period
Av. Ex. Av. Ex. Av. Ex. Av. Ex.
Av. Ex. Av. Ex. Av. Ex. Av. Ex.
J F M A M J J A S O N D J F M A M J J A S O N D J F M A M J J A S O N D J F M A M J J A S O N D 3.5 > 100 < 1 2.6 < 1 3.5 < 1 < 1 < 1 2 < 1 1 < 1 < 1 < 1 < 1 Winter Spring Summer Fall Extreme FWI High FWI Extreme FFMC High FFMC
Low Moderate High Extreme
Fire weather danger: Climatic conditions:
Average conditions Exceptional conditions (Period 1959-2015) (year 2003)
Linear temporal trend:
Without arrow: no trend Small trend Moderate trend High trend
Figure 9: Summary table of the current fire weather danger and its temporal trend during the period 1959–2015 for each subregion of the French Alps.
precipitations well distributed along the year. Until now, this cool and relatively humid climate mitigated the effect of the global temperatures increase and allowed keeping a moderate fire weather danger even during exceptional drought. However, one may question about the future fire weather because it has been proved that significant increases in rainfall amounts are needed to maintain the current fuel moisture levels when mean temperature increase of 1°C (Flannigan et al.,2016).
Favourable climatic conditions alone are not sufficient to produce forest fires and an increase in fire weather danger does not necessary mean a direct rise in the number of fires (Curt et al.,2016). Indeed, the number of fires depends mostly on human-caused ignitions, thus on the density of human settlement and activities, and the burned area also depends on fuel types, landscape configuration, and the fire suppression capability. This is in line with the results of
Wastl et al.(2012) which indicates that an increase in fire weather danger did not necessarily produced an increase in fire activity throughout the Alps. Therefore, future works should also consider land use, probability of ignition and
fire management strategy to get a complete overview of the spatio-temporal trends of fire danger in the French Alps (Zumbrunnen et al.,2012). A first step could be to cross our analysis with a map of Wildland-Urban Interface areas (Modugno et al.,2016) to account for ignition caused by human activities (about 85% of the ignition) and a map of fuels that could be obtained using Lidar data (Skowronski et al.,2016).
Several works have used Safran to analyse observed fire weather in the South of France (Ruffault et al.,2017;
Fr´ejaville and Curt,2015,2014). However, these works directly used a gridded outputs with a resolution of 8km × 8km which might suit relatively flat area but are not adapted to the complex topography found in the Alps. In this study, we proposed to use the raw Safran dataset has it as been already done for others natural hazards such as avalanches (Castebrunet et al.,2014). The main shortcomings of this dataset in the Alpine region were discussed inQuintana-Segui et al.(2008) and might affect the fire weather index calculation. In the Alps, an overall positive temperature bias was observed but it might be compensated by an under-estimation of wind speed in the calculation of FWI and FFMC. Recently, Safran system was used in Spain (Quintana-Segu´ı et al.,2016) and an over-estimation of precipitation was identified even if it does not seem to be the case in the Alps (Quintana-Segui et al.,2008). 4.2. Projected trends in a context of global changes
The results of this study are consistent with the climate changes observed and predicted for the French Alps. Models and simulations indicate higher temperature on average with+1.5°C at the mid-21st century and between
+2 and +4°C by the end of 21stcentury with higher increases in the Southern Alps (Gobiet et al.,2014). Rainfall
changes are not so obvious but increases are predicted mainly in spring and winter, and decreases during summer. These conditions might promote fire because spring and winter rainfalls allow accumulating fuel biomass in forests (Fr´ejaville et al.,2016) while higher temperatures and low rainfall in summer indicate lower fuel moisture (Flannigan et al.,2016). Severe droughts and heat waves are also predicted to be more frequent, although their duration cannot be modelled (Gobiet et al.,2014). This study showed that exceptional meteorological years such as 2003 increase fire weather danger almost everywhere in the French Alps, thus reducing the regional contrasts that exist during “normal” years. All these prospects are made under the assumption that the future Alpine climate will evolve linearly and follow the trends observed since 1959. However, non-linear trends and uncertainties can modify the past-to-present changes (Flannigan et al.,2016).
To go further in the fire weather projection, it could be interesting to integrate regional climate change scenarios (Bedia et al.,2014) in the analysis. However, most climate change models have a much lower spatial resolution than the 25 m × 25 m used in this study. Therefore we could add a source of uncertainty by post-processing those low resolution projections with the DTM from BDAlti®.
4.3. Indirect consequences and practical implications for fire prevention policy
The identification of the three hotspots of fire danger might improve the fire prevention policy in the French Alpine area. Therefore, with a significant increase of all fire weather components, inner area and high elevations of Southern Alps might need a growing attention in the next decades. On the other hand, Northern Alps remain relatively unaffected by big fires but authorities must prepare for exceptional years such as 2003 which promote large and destructive wildfires.
Mountain forests provide a wide range of ecosystem services (Briner et al.,2013). Among them, the protection of human beings and infrastructures against natural hazards is essential, especially in Alpine regions (Bebi et al.,2001). In France, a significant part of the forested area in the Alps provides a natural protection against rockfall (Dupire et al.,
2016a) or erosion (Stoffel et al.,2013). An increase of forest fires might degrade these important ecosystem services (Maringer et al.,2016;De Graff et al.,2015). A better knowledge of the climatic component of the fire danger crossed with the map of protection forests (Toe and Berger,2015) might also help the stakeholders in the allocation of fire fighting resources.
5. Conclusion
The ongoing climate changes lead to a major contrast between Northern Alps with low and slightly increasing fire danger, and Southern and inner Alps with high and increasing fire danger. The number of days days prone to fire slightly increased at spring in the North and significantly throughout the year in the South. Based on the increase of
days with high fire weather danger, fires should also become more intense on average. These trends should reinforce in the next decades according to climate change predictions, due to increasing temperatures and higher variations in rainfall. The increasing frequency of heatwaves and severe droughts may generate large and intense fires, mostly in Southern and inner Alps, but also at low elevation in the North like in the year 2003. This study can help science-based decision for better alerting, prevention, suppression of wildfires and an adaptation of forests and French Alpine territories to wildfire risk.
Funding
This work was supported by the French Ministry of Ecology, Sustainable Development and Energy [grant n° 2101527657] and the H2020 project NAIAD [grant n° 730497] from the European Union’s Horizon 2020 research and innovation programme.
Acknowledgement
We acknowledge the DCSC-AVH and CEN from the Grenoble center of M´et´eo France for providing us Safran data as well as useful advices for their manipulation.
Appendix A
SeeFigs. A.1,A.2,A.3andA.4.
References
Amatulli, G., Camia, A., San-Miguel-Ayanz, J., 2013. Estimating future burned areas under changing climate in the EU-Mediterranean countries. Science of The Total Environment 450–451, 209 – 222.
Arndt, N., Vacik, H., Koch, V., Arpaci, A., Gossow, H., 2013. Modeling human-caused forest fire ignition for assessing forest fire danger in Austria. iForest - Biogeosciences and Forestry 6 (6), 315–325.
Arpaci, A., Eastaugh, C. S., Vacik, H., 2013. Selecting the best performing fire weather indices for Austrian ecoregions. Theoretical and Applied Climatology 114 (3-4), 393–406.
BDIFF, 2017. BDIFF: Base de donn´ees sur les incendies de forˆet en France. URLhttp://bdiff.ifn.fr/
Bebi, P., Kienast, F., Sch¨onenberger, W., 2001. Assessing structures in mountain forests as a basis for investigating the forests’ dynamics and protective function. Forest Ecology and Management 145 (1-2), 3–14.
Bedia, J., Herrera, S., Camia, A., Moreno, J., Guti´errez, J., 2014. Forest fire danger projections in the Mediterranean using ENSEMBLES regional climate change scenarios. Climatic Change 122 (1-2), 185–199.
Bedia, J., Herrera, S., Mart´ın, D., Koutsias, N., Guti´errez, J., 2013. Robust projections of Fire Weather Index in the Mediterranean using statistical downscaling. Climatic Change 120 (1-2), 229–247.
Beniston, M., 2005. Climatic change and its possible impacts in the Alpine region. Journal of Alpine Research 93 (2), 25–32. Blarquez, O., Carcaillet, C., 08 2010. Fire, fuel composition and resilience threshold in subalpine ecosystem. PLOS ONE 5 (8), 1–8.
Bradstock, R. A., 2010. A biogeographic model of fire regimes in australia: current and future implications. Global Ecology and Biogeography 19 (2), 145–158.
Briner, S., Huber, R., Bebi, P., Elkin, C., Schmatz, D. R., Grˆet-Regamey, A., 2013. Trade-offs between ecosystem services in a mountain region. Ecology and Society 18 (3).
Castebrunet, H., Eckert, N., Giraud, G., Durand, Y., Morin, S., 2014. Projected changes of snow conditions and avalanche activity in a warming climate: the French Alps over the 2020-2050 and 2070-2100 periods. The Cryosphere 8 (5), 1673–1697.
Cerd`a, A., 1998. Changes in overland flow and infiltration after a rangeland fire in a mediterranean scrubland. Hydrological Processes 12 (7), 1031–1042.
Coles, S., Bawa, J., Trenner, L., Dorazio, P., 2001. An introduction to statistical modeling of extreme values. Vol. 208. Springer, London. Curt, T., Fr´ejaville, T., Lahaye, S., 2016. Modelling the spatial patterns of ignition causes and fire regime features in southern France: implications
for fire prevention policy. International Journal of Wildland Fire 25 (7), 785–796.
De Graff, J. V., Shelmerdine, B., Gallegos, A., Annis, D., 2015. Uncertainty associated with evaluating rockfall hazard to roads in burned areas. Environmental & Engineering Geoscience 21 (1), 21–33.
de Groot, W. J., Wardati, Wang, Y., 2005. Calibrating the fine fuel moisture code for grass ignition potential in Sumatra, Indonesia. International Journal of wildland fire 14 (2), 161–168.
Dumas, D., 2013. Changes in temperature and temperature gradients in the French Northern Alps during the last century. Theoretical and Applied Climatology 111, 223–233.
Dupire, S., Bourrier, F., Monnet, J.-M., Bigot, S., Borgniet, L., Berger, F., Curt, T., 2016a. Novel quantitative indicators to characterize the protective effect of mountain forests against rockfall. Ecological Indicators 67, 98–107.
Dupire, S., Bourrier, F., Monnet, J.-M., Bigot, S., Borgniet, L., Berger, F., Curt, T., 2016b. The protective effect of forests against rockfalls across the French Alps: Influence of forest diversity. Forest Ecology and Management 382, 269–279.
Durand, Y., Laternser, M., Giraud, G., Etchevers, P., Lesaffre, B., M´erindol, L., 2009. Reanalysis of 44 yr of climate in the French Alps (1958-2002): methodology, model validation, climatology, and trends for air temperature and precipitation. Journal of Applied Meteorology and Climatology 48, 429.
Ebel, B. A., Moody, J. A., 2017. Synthesis of soil-hydraulic properties and infiltration timescales in wildfire-affected soils. Hydrological Processes 31 (2), 324–340.
Einhorn, B., Eckert, N., Chaix, C., Ravanel, L., Deline, P., Gardent, M., V., B., Richard, D., Giraud, G., Schoeneich, P., 2015. Climate change and natural hazards in the Alps. Journal of Alpine Research 103 (2).
Fink, A. H., Br¨ucher, T., Kr¨uger, A., Leckebusch, G. C., Pinto, J. G., Ulbrich, U., 2004. The 2003 european summer heatwaves and drought –synoptic diagnosis and impacts. Weather 59 (8), 209–216.
URLhttp://dx.doi.org/10.1256/wea.73.04
Flannigan, M. D., Wotton, B. M., Marshall, G. A., de Groot, W. J., Johnston, J., Jurko, N., Cantin, A. S., 2016. Fuel moisture sensitivity to temperature and precipitation: climate change implications. Climatic Change 134 (1), 59–71.
Fr´ejaville, T., Curt, T., 2014. Pyroclimatic classification of Mediterranean and mountain landscapes of south-eastern France. Imprensa da Univer-sidade de Coimbra, Coimbra, Ch. 4 - Fire Risk Assessment and Climate Change, pp. 1249–1255.
Fr´ejaville, T., Curt, T., 2015. Spatiotemporal patterns of changes in fire regime and climate: defining the pyroclimates of south-eastern France (Mediterranean Basin). Climatic Change 129 (1), 239–251.
Fr´ejaville, T., Curt, T., Carcaillet, C., 2016. Tree cover and seasonal precipitation drive understorey flammability in Alpine mountain forests. Journal of Biogeography 43 (9), 1869–1880.
Gibson, C. M., Turetsky, M. R., Cottenie, K., Kane, E. S., Houle, G., Kasischke, E. S., 2016. Variation in plant community composition and vegetation carbon pools a decade following a severe fire season in interior alaska. Journal of Vegetation Science 27 (6), 1187–1197.
Gilleland, E., Katz, R. W., 2016. extRemes 2.0: An extreme value analysis package in R. Journal of Statistical Software 72 (8), 1–39.
Gobiet, A., Kotlarski, S., Beniston, M., Heinrich, G., Rajczak, J., Stoffel, M., 2014. 21st century climate change in the European Alps — A review. Science of The Total Environment 493, 1138 – 1151.
Gobron, N., Pinty, B., M´elin, F., Taberner, M., Verstraete, M. M., Belward, A., Lavergne, T., Widlowski, J., 2005. The state of vegetation in europe following the 2003 drought. International Journal of Remote Sensing 26 (9), 2013–2020.
Harris, R. M. B., Remenyi, T. A., Williamson, G. J., Bindoff, N. L., Bowman, D. M. J. S., 2016. Climate–vegetation–fire interactions and feedbacks: trivial detail or major barrier to projecting the future of the Earth system? Wiley Interdisciplinary Reviews: Climate Change 7 (6), 910–931. Joly, D., Brossard, T., Cardot, H., Cavailhes, J., Hilal, M., Wavresky, P., 2010. Types of climates on continental France, a spatial construction.
Cybergeo : European Journal of Geography.
Jomelli, V., Pech, V. P., Chochillon, C., Brunstein, D., 2004. Geomorphic variations of debris flows and recent climatic change in the French Alps. Climatic Change 64 (1), 77–102.
Kohler, T., Giger, M., Hurni, H., Ott, C., Wiesmann, U., Wymann von Dach, S., Maselli, D., 2010. Mountains and climate change: a global concern. Mountain Research and Development 30 (1), 53–55.
Lahaye, S., Curt, T., Paradis, L., H´ely, C., 2014. Classification of large wildfires in South-Eastern France to adapt suppression strategies. Imprensa da Universidade de Coimbra, Coimbra, Ch. 3 - Fire Management, pp. 696–708.
Lawson, B. D., Armitage, O., et al., 2008. Weather guide for the Canadian forest fire danger rating system. Nat. Resour. Can., Can. For. Serv. Le Meur, E., Gerbaux, M., Sch¨afer, M., Vincent, C., 2007. Disappearance of an Alpine glacier over the 21st century simulated from modeling its
future surface mass balance. Earth and Planetary Science Letters 261 (3–4), 367 – 374.
Luterbacher, J., Dietrich, D., Xoplaki, E., Grosjean, M., Wanner, H., 2004. European seasonal and annual temperature variability, trends, and extremes since 1500. Science 303 (5663), 1499–1503.
Maringer, J., Ascoli, D., Dorren, L., Bebi, P., Conedera, M., 2016. Temporal trends in the protective capacity of burnt beech forests (Fagus sylvatica L.) against rockfall. European Journal of Forest Research 135 (4), 657–673.
Meyn, A., White, P. S., Buhk, C., Jentsch, A., 2007. Environmental drivers of large, infrequent wildfires: the emerging conceptual model. Progress in Physical Geography 31 (3), 287–312.
Modugno, S., Balzter, H., Cole, B., Borrelli, P., 2016. Mapping regional patterns of large forest fires in Wildland–Urban Interface areas in Europe. Journal of Environmental Management 172, 112 – 126.
Moretti, M., Conedera, M., Duelli, P., Edwards, P. J., 2002. The effects of wildfire on ground-active spiders in deciduous forests on the swiss southern slope of the alps. Journal of Applied Ecology 39 (2), 321–336.
Moriondo, M., Good, P., Durao, R., Bindi, M., Giannakopoulos, C., Corte-Real, J., 2006. Potential impact of climate change on fire risk in the Mediterranean area. Climate Research 31 (1), 85–95.
M¨uller, M. M., Vacik, H., Diendorfer, G., Arpaci, A., Formayer, H., Gossow, H., 2013. Analysis of lightning-induced forest fires in Austria. Theoretical and Applied Climatology 111 (1), 183–193.
M¨uller, M. M., Vacik, H., Valese, E., 2015. Anomalies of the Austrian forest fire regime in comparison with other Alpine countries: A research note. Forests 6 (4), 903–913.
Ozenda, P., Wagner, H., 1975. Les s´eries de v´eg´etation de la chaine alpine et leurs ´equivalences dans les autres syst`emes phytog´eographiques. Laboratoire de biologie v´eg´etale de l’Universit´e de Grenoble.
Pachauri, R. K., Allen, M. R., Barros, V. R., Broome, J., Cramer, W., Christ, R., Church, J. A., Clarke, L., Dahe, Q., Dasgupta, P., et al., 2014. Climate change 2014: synthesis report. Contribution of Working Groups I, II and III to the fifth assessment report of the Intergovernmental Panel on Climate Change. IPCC.
Pardini, G., Gispert, M., Emran, M., Doni, S., 2017. Rainfall/runoff/erosion relationships and soil properties survey in abandoned shallow soils of ne spain. Journal of Soils and Sediments 17 (2), 499–514.
Poumad`ere, M., Mays, C., Le Mer, S., Blong, R., 2005. The 2003 heat wave in france: Dangerous climate change here and now. Risk Analysis 25 (6), 1483–1494.
Prom´eth´ee, 2017. PROM ´ETH ´EE 2 : La banque de donn´ees sur les incendies de forˆets en r´egion M´editerran´eenne en France. URLhttp://www.promethee.com/
Quintana-Segui, P., Le Moigne, P., Durand, Y., Martin, E., Habets, F., Baillon, M., Canellas, C., Franchisteguy, L., Morel, S., 2008. Analysis of near-surface atmospheric variables: Validation of the SAFRAN analysis over France. Journal of applied meteorology and climatology 47 (1), 92–107.
Quintana-Segu´ı, P., Turco, M., Herrera, S., Miguez-Macho, G., 2016. Validation of a new safran-based gridded precipitation product for spain and comparisons to spain02 and era-interim. Hydrology and Earth System Sciences Discussions 2016, 1–26.
Ravanel, L., Deline, P., 2011. Climate influence on rockfalls in high-Alpine steep rockwalls: The north side of the Aiguilles de Chamonix (Mont-Blanc massif) since the end of the ‘Little Ice Age’. The Holocene 21 (2), 357–365.
Reineking, B., Weibel, P., Conedera, M., Bugmann, H., 2010. Environmental determinants of lightning-v. human-induced forest fire ignitions differ in a temperate mountain region of Switzerland. International Journal of Wildland Fire 19 (5), 541–557.
Reinhard, M., Rebetez, M., Schlaepfer, R., 2005. Recent climate change: Rethinking drought in the context of forest fire research in ticino, south of switzerland. Theoretical and Applied Climatology 82 (1), 17–25.
Ruffault, J., Moron, V., Trigo, R. M., Curt, T., 2016. Objective identification of multiple large fire climatologies: an application to a Mediterranean ecosystem. Environmental Research Letters 11 (7).
Ruffault, J., Moron, V., Trigo, R. M., Curt, T., 2017. Daily synoptic conditions associated with large fire occurrence in Mediterranean France: evidence for a wind-driven fire regime. International Journal of Climatology 37 (1), 524–533.
Schunk, C., Wastl, C., Leuchner, M., Menzel, A., 2017. Fine fuel moisture for site- and species-specific fire danger assessment in comparison to fire danger indices. Agricultural and Forest Meteorology 234–235, 31 – 47.
Shakesby, R. A., Moody, J. A., Martin, D. A., Robichaud, P. R., 2016. Synthesising empirical results to improve predictions of post-wildfire runoff and erosion response. International Journal of Wildland Fire 25 (3), 257–261.
Skowronski, N. S., Haag, S., Trimble, J., Clark, K. L., Gallagher, M. R., Lathrop, R. G., 2016. Structure-level fuel load assessment in the wildland– urban interface: a fusion of airborne laser scanning and spectral remote-sensing methodologies. International Journal of Wildland Fire 25 (5), 547–557.
Stoffel, M., Corona, C., Ballesteros-C´anovas, J. A., Bodoque, J. M., 2013. Dating and quantification of erosion processes based on exposed roots. Earth-Science Reviews 123, 18 – 34.
Toe, D., Berger, F., 2015. Regional mapping of forest with a protection function against rockfall. In: Lollino, G., Giordan, D., Crosta, G. B., Corominas, J., Azzam, R., Wasowski, J., Sciarra, N. (Eds.), Engineering Geology for Society and Territory. Vol. 2. Springer International Publishing, Cham, pp. 1957–1959.
Valese, E., Conedera, M., Held, A., Ascoli, D., 2014. Fire, humans and landscape in the European Alpine region during the Holocene. Anthropocene 6, 63 – 74.
Van Wagner, C., 1987. Development and structure of the Canadian Forest Fire Weather Index System. Vol. 35. Canadian Forestry Service, Forestry Technical Report 35.
Ven¨al¨ainen, A., Korhonen, N., Hyv¨arinen, O., Koutsias, N., Xystrakis, F., Urbieta, I. R., Moreno, J. M., 2014. Temporal variations and change in forest fire danger in Europe for 1960–2012. Natural Hazards and Earth System Sciences 14 (6), 1477–1490.
Vidal, J.-P., Martin, E., Franchist´eguy, L., Baillon, M., Soubeyroux, J.-M., 2010. A 50-year high-resolution atmospheric reanalysis over France with the Safran system. International Journal of Climatology 30 (11), 1627–1644.
Viegas, D. X., Bovio, G., Ferreira, A., Nosenzo, A., Sol, B., 2000. Comparative study of various methods of fire danger evaluation in southern europe. International Journal of wildland fire 9 (4), 235–246.
Wastl, C., Schunk, C., Leuchner, M., Pezzatti, G. B., Menzel, A., 2012. Recent climate change: long-term trends in meteorological forest fire danger in the Alps. Agricultural and Forest Meteorology 162–163, 1 – 13.
Zumbrunnen, T., Men´endez, P., Bugmann, H., Conedera, M., Gimmi, U., B¨urgi, M., 2012. Human impacts on fire occurrence: a case study of hundred years of forest fires in a dry alpine valley in Switzerland. Regional Environmental Change 12 (4), 935–949.
Jan. Feb. Mar. Apr.
May June July Aug.
Sep. Oct. Nov. Dec.
Monthly average number of days with FWI ≥ 10
(Period 1959-2015)
0 1 2 5 10 20 31
0 50 km
N
Jan. Feb. Mar. Apr.
May June July Aug.
Sep. Oct. Nov. Dec.
Temporal linear trend of the number of days with FWI ≥ 10 (Period 1959-2015)
-0.05 0 0.02 0.09 0.18 0.30
0 50 km
N
Non-significant pval > 0.05
Slope [day.year ]-1
Figure A.2: Maps of the temporal trend of number of days with FWI ≥ 10 for each month. Significant trends (p-value ≤ 0.05) are shown using colors, non significant trends are shown in white.
Jan. Feb. Mar. Apr.
May June July Aug.
Sep. Oct. Nov. Dec.
Monthly average number of days with FFMC ≥ 88.1
(Period 1959-2015)
0 1 2 5 10 20 31
0 50 km
N
Jan. Feb. Mar. Apr.
May June July Aug.
Sep. Oct. Nov. Dec.
Temporal linear trend of the nb. of days with FFMC ≥ 88.1 (Period 1959-2015)
-0.05 0 0.02 0.09 0.18 0.43
0 50 km
N
Non-significant pval > 0.05
Slope [day.year ]-1
Figure A.4: Maps of the temporal trend of number of days with FFMC ≥ 88.1 for each month. Significant trends (p-value ≤ 0.05) are shown using colors, non significant trends are shown in white.