Science Arts & Métiers (SAM)
is an open access repository that collects the work of Arts et Métiers Institute of
Technology researchers and makes it freely available over the web where possible.
This is an author-deposited version published in:
https://sam.ensam.eu
Handle ID: .
http://hdl.handle.net/10985/14635
To cite this version :
Erlantz LIZUNDIA, Alain GUINAULT, Jose Luis VILAS, Sandra DOMENEK - mpact of ZnO
nanoparticle morphology on relaxation and transport properties of PLA nanocomposites - Polymer
Testing - Vol. 75, p.175-184 - 2019
Any correspondence concerning this service should be sent to the repository
Administrator :
archiveouverte@ensam.eu
Impact of ZnO nanoparticle morphology on relaxation and transport
properties of PLA nanocomposites
Erlantz Lizundia
a,b,*, Marie Cristina Penayo
c, Alain Guinault
d, Jose Luis Vilas
b,e,
Sandra Domenek
c,**aDept. of Graphic Design and Engineering Projects, Faculty of Engineering in Bilbao, University of the Basque Country (UPV/EHU), Spain bBCMaterials, Basque Center for Materials, Applications and Nanostructures, UPV/EHU Science Park, 48940, Leioa, Spain
cUMR Ingénierie Procédés Aliments, AgroParisTech, INRA, Université Paris-Saclay, 1 Avenue des Olympiades, F-91300, Massy, France dPIMM, Arts et Métiers ParisTech/CNRS/CNAM, 151 Bd de l’Hôpital, F–75013, Paris Cedex, France
eMacromolecular Chemistry Research Group (LABQUIMAC), Dept. of Physical Chemistry, Faculty of Science and Technology, University of the Basque Country (UPV/
EHU), Spain A R T I C L E I N F O Keywords: Polylactide Metallic nanoparticle Nanocomposites Relaxation Gas transport Packaging A B S T R A C T
In this work we study the effect of zinc oxide (ZnO) nanoparticle morphology and concentration on the resulting relaxation and transport properties of polylactide (PLA) nanocomposites. Films containing spherical and rod-shaped ZnO nanoparticles were incorporated into an amorphous polylactide (PLA) matrix through a solvent-precipitation and compression moulding method. Morphological analyses carried out by scanning electron microscopy (SEM) together with ultraviolet–visible (UV-Vis) spectroscopy and thermogravimetric analysis (TGA). Results indicate a much better distribution of rod-shaped ZnO within PLA matrix. Relaxation experiments reveal faster physical aging kinetics of PLA in presence ZnO nanoparticles notwithstanding their shape, sug-gesting the presence of non-interacting surfaces between the amorphous PLA matrix and the ZnO nanoparticles. Interestingly, both helium and oxygen permeability remained stable or increase upon nanoparticle addition, and anisole sorption kinetics showed faster mass transport in the nanocomposites, suggesting that the low interfacial adhesion between PLA and ZnO brings supplementary voids to the material increasing mass transport. Overall, the experimentalfindings here reported provide a deeper understanding on the influence of metal oxide na-noparticle morphology on the resulting relaxation and gas transport properties of amorphous polymeric nano-composites.
1. Introduction
One of the most promising biopolymers able to replace the petro-leum-derived polymers for industrial applications is poly (lactide) (PLA). PLA is a linear aliphatic thermoplastic polyester derived from 100% renewable resources such as sugar, corn, potatoes, cane, beet, etc. [1]. PLA possesses interesting physical properties together with bio-compatibility and biodegradability character, which are all strongly influenced by its stereochemistry and molecular weight. Industrial PLA is mostly polymerized from lactide and D,lactide, where the L-isomer is the main fraction. PLA emerges as a potential candidate for consumer products such as packaging due to its transparency, degrad-ability, low toxicity and environmentally benign characteristics. Nevertheless, there are some drawbacks, such as its high brittleness,
poor crystallization behaviour and low gas barrier properties that limit its current use [2,3].
In order to maintain food quality, food packaging materials should protect the product from the environment. When using PLA as a packaging material, this requires minimising both UV and gas perme-ability of the neat polymer, critical properties to increase the packaged-food shelf-life as oxygen and water vapour permeation through thefilm would cause oxidation of lipids and microbial growth respectively [4]. Usually, traditional polymers such as polyethylene terephthalate (PET), polyethylene (PE) and polypropylene (PP), are laminated to other materials (barrierfilms or aluminium foil), coextruded with barrier resins (PVOH, EVOH), coated or metalized to improve their barrier properties. This implies the use of a considerable amount of plastic, materials and adhesives, which can make the recycling processes
*Corresponding author. Dept. of Graphic Design and Engineering Projects, Faculty of Engineering in Bilbao, University of the Basque Country (UPV/EHU), Spain. **
Corresponding author.
E-mail addresses:erlantz.liizundia@ehu.eus(E. Lizundia),sandra.domenek@agroparistech.fr(S. Domenek).
difficult [5]. In contrast, blending polymers with nanoscale particles have been shown as a cost-effective and easily scalable approach to tackle this matter, making the hosting PLA a competitive alternative to currently used petrochemical polymers [6].
To improve the light barrier properties of PLA, we chose to add inorganic nanoparticles, namely zinc oxide (ZnO). ZnO is a multi-functional inorganic material with: i) an optical band gap in the UV region (3.37 eV) that makes it appropriate as UV-light absorber additive similarly to other inorganic materials [7] ii) high thermal stability and proper antimicrobial properties [8], iii) high photostability and has been approved by the American Food and Drug Administration (FDA) due to its low toxicity [9]. In this line, recent studies have highlighted the efficiency of ZnO inclusion into a PLA matrix in order to obtain films which improve the shelf-life of packaged fresh-cut products [10], and effectively inactivate microbial growth when in contact with food [11].
Whereas numerous aspects of the inorganic-polymeric nano-composites have been extensively studied, ranging from their proces-sing to the characterization of their mechanical and physical properties, the effect of nanoscale fillers on the so-called physical aging behaviour of glassy polymers remains relatively uncharted. This aging behaviour deals with the evolution of thermodynamic properties (enthalpy, vo-lume, etc.) towards equilibrium, occurring below the glass transition temperature (Tg) [12,13]. Since physical aging may result in many
deleterious effects ranging from embrittlement to reduction in perme-ability and dimensional instperme-ability, it has been extensively studied for bulk polymer systems in the past years [14–17]. In the case of polymer nanocomposites and, more generally, nanoscale confined materials such as polymer thinfilms or polymers in nanopores, the physical aging process can be dramatically modified in comparison to the same process in bulk polymers [18,19]. This is due to the fact that nanoscale con-finement may induce two kinds of effects on polymer segmental mo-bility: i) molecular mobility in glass-forming systems is generally as-sociated with a typical length scale and the presence of a physical barrier in confined materials may modify the size and the temperature dependence of such a length scale; ii) the surface effect is responsible for mobility changes at the interface: polymer-nanoparticle interface in nanocomposites; polymer-matrix in nanoporous materials; polymer-air or substrate in thinfilms. These peculiarities of physical aging in na-noscale confined polymers explain the emerging interest of the scien-tific community in the subject [18].
In this work, a non-crystallisable polylactide has been selected to develop nanocomposites having both spherical (PLA/ZnO_s) and rod-shaped ZnO nanoparticles (PLA/ZnO_r). Contrarily to the majority of the works reported so far, a non-crystallisable polymer has been se-lected as a model matrix in order to avoid the effects associated with the presence of crystalline phases on the resulting physical aging of the nanocomposite. The effect of nanoparticles on the glass transition, physical aging of the polymer and polymer relaxation during mass transport studies has been investigated. Physical aging has been eval-uated through the study of mass transport across aged samples, using Helium, Oxygen and Anisole, an organic vapour able to swell PLA.
2. Materials and methods 2.1. Starting materials
PLA with a commercial name Ingeo™ 4060D was purchased from NatureWorks LLC. Rod-shaped ZnO nanoparticles (termed as ZnO_r) were purchased by L'Urederra technological centre (Spain), while spherical ZnO nanoparticles (termed as ZnO_s) were supplied by Plasmachem GmbH (Germany). Dichloromethane (CH2Cl2), methanol
(CH4O) and anisole were obtained from LabScan, Panreac and Sigma
Aldrich (France) respectively.
2.2. Sample preparation
Samples have been prepared by solvent-precipitation followed by compression moulding. Nanoparticles (NPs) were homogeneously sus-pended in CH2Cl2via sonication (and they were added to previously
dissolved PLA to yield nanocomposites containing 0, 0.2, 0.5, 1, 5 and 10 wt%. Another sonication step has been applied to dispersions before precipitating them in an excess of cold methanol. After vacuum drying (48 h at 60 °C), films were fabricated by compression moulding at 200 °C for 3 min under a pressure of 150 MPa (films were water quen-ched to allow their solidification). The films were stored in a desiccator over P2O5.
2.3. Morphological analysis
Transmission electron microscopy (TEM) analyses were carried out using a Philips CM120 Biofilter apparatus with STEM module at an acceleration voltage of 120 kV. Raw ZnO nanoparticles were analyzed depositing a droplet of nanoparticle suspension (0.1% (w/w)) in dis-tilled water on a carbon-coated grid. The dispersion ZnO within the PLA matrix was evaluated using ultrathin sections of the nanocomposites (thickness of approx. 150 nm; samples cutted using a Leica Ultracut UCT ultramicrotome equipped with a diamond knife).
2.4. Thermogravimetric analysis
Thermal stability of nanocomposites was analyzed in a TGA MET-TLERTOLEDO 822e Thermal Gravimetric Analysis (TGA) instrument by heating the samples from room temperature to 500 °C at 10 °C/min under N2atmosphere.
2.5. Ultraviolet-visible (UV–Vis) spectroscopy
UV–Vis transmittance spectra were recorded with a Shimadzu MultiSpec-1501 spectrophotometer. Total transmittance experiments have been analyzed in the range of 190–800 nm with a sampling in-terval of 1 nm and 25 accumulations.
2.6. Differential Scanning Calorimetry analysis (DSC)
Thermal analyses of the samples were analyzed by means of the Differential Scanning Calorimetry analysis (DSC) (DSC-Q100 from TA Instruments) apparatus under 50 mL/min N2-flow. The samples
(3–5 mg) were sealed in TZero aluminium pans. The DSC was tem-perature calibrated with Zn and In standards. The calibration of the heat-flow was carried out with In-standards and the calibration of the baseline with a sapphire disk. The samples were scanned by a heat-cool-heat loop from 0 to 180 °C at 10 °C/min and the glass transition tem-perature (Tg) was determined as the mid-point of the heat capacity step
at the second heating scan. The value of the glass transition tempera-ture of PLA was used for the determination of the temperatempera-ture program of physical aging with aging temperature equal to Ta= Tg
-15 °C = 39 °C. Fig. S1 in the Supporting Information represents the applied aging program.
For the study of physical aging, all experiments began with a heating ramp until 180 °C in order to erase the material's previous thermal history. The samples were subsequently cool-heat loop from 0 to 150 °C at a scanning speed of 10 °C/min.
Physical aging times ta varied from 0 to 120 h in the DSC.
Furthermore, a longer aging experiment was carried out in an external oven at 39 °C ( ≥ta 2weeks). These samples were scanned in the DSC
with the same temperature program (heat-cool-heat cycle from 0 to 150 °C at 10 °C/min). The enthalpy of recovery was calculated by in-tegration of the recovery peak using Eq.(1):
∫
= − H T t C T C T dT Δ ( ,a a) ( ( ) ( )) , T T p a pu x y (1) whereCpaandCpuare respectively the specific heat of the aged andun-aged samples normalized by the PLA content, and Tx and Ty are
re-spectively temperatures below and above the calorimetric Tg. For each
polymer, Tx and Tywere chosen as the temperatures at which the
un-aged and the un-aged sample scans superimposed below and above Tg,
respectively.
2.7. Gas permeability testing
The oxygen permeability was measured using a Systec (France) permeability tester 8001 at 23 °C and 0% Relative humidity (RH) and a pressure gradient of 1 atm. The recorded oxygen transmission rate was normalized by the sample surface and thickness (measured at 10 points) for the calculation of the oxygen permeability.
Based on the same principle the helium permeability was measured by a home-made apparatus developed at CNAM with the help of a mass spectrometer. The measurements were performed at 23 °C and 0% RH on the sample that was used for measuring oxygen permeability. 2.8. Anisole sorption experiments
The gravimetric method was used for the measurement of the ani-sole sorption kinetics (seeTable S1for the physicochemical properties of anisole) [20]. The sorption curves were recorded at 40 °C and 0% RH, using an electronic microbalance operating at afixed partial pressure (Intelligent Gravimetric Analyser 002, Hiden Isochema Ltd, War-rington, UK, (precision 0.2μg). Films of ~15 mg and thickness ~100–300 μm were suspended from the microbalance by a stainless steel pan, which was contained in a thermo-regulated cell. The micro-balance itself was maintained at 50 °C to ensure stability during the weight measurement and prevent solvent condensation. To ensure low water content, the samples were stored in a desiccator over P2O5before
use.
After the samples had been loaded into the microbalance, they were purged for 24 h at 10−5mbar (10−3Pa) to remove all volatile com-pounds, which were sorbed in thefilm and present in the chamber. The anisole partial pressure, which corresponded to an activity of 0.2 (Table S1, Supporting Information), was set in the measuring chamber, which was connected to a tank with a vapour phase saturated in anisole. The partial pressure was regulated using a pressure transducer (Baratron®, MKS Instruments, Wilmington, MA, USA). The mass uptake of the samples was recorded automatically over 5 days. The results of the preliminary experiments showed that there is some inevitable leakage past the copper seals, which, over time, leads to the dilution of the organic vapours by incoming air. Therefore, a pressure perturbation was introduced at regular time intervals to ensure a constant partial pressure while the measurement was being performed. This pressure perturbation forces the electronics of the microbalance to re-regulate the partial pressure by pumping part of the atmosphere in the chamber and re-regulating by connecting the organic vapour reservoir. It has a time constant, which is very different from the characteristic time of diffusion. Therefore, it was easily cancelled out in the curve analysis. In the following, the pressure perturbation is visible in the experimental data and corresponds to the spikes in the mass uptake curves.
The data treatment was performed using Crank's solution of Fick's second law for diffusion in a plane sheet [21]. At short times and as-suming constant surface concentrations, the solution becomes:
∑
= ⋅⎡ ⎣ ⎢ + ⎤ ⎦ ⎥ = ∞ − m m Dt L π n erf nL Dt 4 1 2 ( ) 2 , t eq n n 2 0 1 (2) with mtbeing the relative mass uptake at time t, meqbeing the relativemass uptake at Fickian equilibrium, L being the half sample thickness,
and D the diffusion coefficient. At short times
(
m ≤0.5)
m t
eq and assuming
a constant D, the term of the sum can be neglected, reducing the equation to = m m Dt L 4 . t eq 2 (3)
The diffusion coefficient can be obtained from the slope to the curve
⎜ = ⎛ ⎝ f m m t L t
eq ). In the case of thin samples, non-Fickian diffusion of
ani-sole in PLA can be observed [20]. In this case, the equilibrium mass uptake was assumed to correspond to the change of slope of the
⎜ = ⎛ ⎝ f m m t L t
eq ) curve. This assumption was validated with Espino's
meth-odology [20]. Because of the high sample thicknesses of the PLA/ZnO nanocomposites, the equilibrium sorption could be not reached within the experimentally feasible time. In that case, the uncertainty on the determination of the diffusion coefficient was high. For that, the transport rate was discussed with the help of the normalized slope of the experimental curve.
3. Results and discussion 3.1. Nanoparticle dispersion
It is well-established that the macroscopic properties of nano-composites closely depend on the nanoparticle dispersion within the hosting matrix [22]. To that end, transmission electron microscopy (TEM) has been applied to both PLA/ZnO_r and PLA/ZnO_s nano-composites. TEM hasfirstly carried out with raw ZnO nanoparticles to deter, mine their size and morphology. TEM micrographs inFig. 1a for spherical nanoparticles (ZnO-s) and in Fig. 1d for rod-shaped nano-particles (ZnO-r) confirm the nanoscale nature of used fillers, which dimensions are 43 ± 24 nm in lenght and ~20 nm in width for ZnO-r and 25 nm in diameter for ZnO-s. Micrographs of nanocomposites re-veal a non-oriented isotropic distribution of both spherical and rod-shaped ZnO nanoparticles (seeFig. 1b and c andFig. 1e and f respec-tively) over the entire polymeric matrix. While nanocomposites con-taining spherical nanoparticles present entanglements between ad-jacent NPs, ZnO_r remain randomly distributed within the PLA. As observed inFig. 1b–c, when spherical nanoparticle concentration
in-creases from 1 to 10 wt% the entanglements become more evident, resulting in large aggregated structures. On the contrary, rod-shaped nanoparticles could be found over the entire composite for all the stu-died composition range (Fig. 1e–f). In the light of these results, it could be expected that, for a given concentration, barrier properties would be improved to a larger extent in PLA/ZnO_r nanocomposites because PLA/ZnO_s showed a microcomposite structure rather than nano-composite morphology, resulting less effective for the formation of a tortuous pathway [23]. More precisely, the achieved zinc oxide surface area exposed to PLA chains (and thus to the gas permeating through the material) is much larger in the case of PLA reinforced by rod-shaped ZnO.
3.2. Thermal stability of PLA/ZnO_r and PLA/ZnO_s nanocomposites Thermogravimetric analysis (TGA) has been carried out to evaluate the thermal stability of PLA/ZnO_r and PLA/ZnO_s nanocomposites (see
Table 1 for the characteristic thermodegradation temperatures and maximum degradation rates). As shown inFig. 2, where the thermo-gravimetric traces are shown in the left and weight loss rates in the right, one main loss step characterizes the thermal degradation of PLA nanocomposites. In fact, degradation of neat PLA begins at 330.8 °C (determined by thefirst 5 wt% weight loss) and reaches its maximum weight loss rate at 366.2 °C. When ZnO is added, the peak thermal degradation temperature decreases up to 276.8 °C for the PLA/ZnO_r
10 wt% composition.
The marked decrease in thermal stability upon ZnO loading arises from the fact that, as other metal such as Al, Sn and Al, ZnO catalyse PLA depolymerisation generating unzipping depolymerisation and in-termolecular transesterification reactions upon heating [24]. It should be noted that, especially for concentrations up to 0.5 wt%, the cata-lyzing effect of zinc oxide nanoparticles is much more marked in the case of nanocomposite containing rod-shaped NPs (T5%, the
tempera-ture value of thefirst 5% weight loss, decreases by 73.2 °C in compar-ison with 53.2 °C for PLA/ZnO_r and PLA/ZnO_s containing 0.2 wt% respectively). Since the catalytic reactions take place at the ZnO in-terfaces, the amount of ZnO-PLA interfaces would determine the thermal degradation behaviour of nanocomposites. Therefore, these experimentalfindings suggest that ZnO_r nanoparticles are better dis-persed through the polymer than ZnO_s and larger concentrations than 0.5 wt% yield similar dispersion degrees for both systems. Finally, the residual mass steeply increases upon loading suggesting that ZnO na-noparticles are not degraded in the studied temperature range.
3.3. UV-Vis spectroscopy
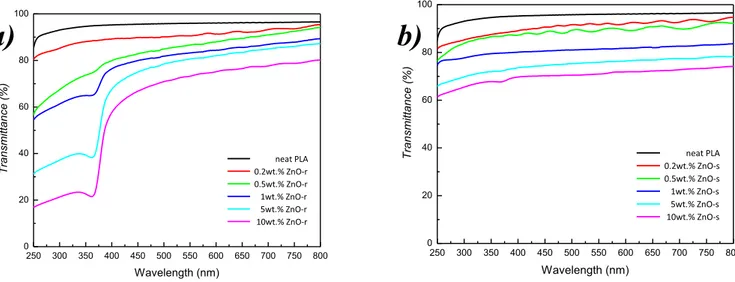
UV–Vis transmittance spectroscopy has been carried out to evaluate the UV-shielding behaviour of fabricated nanocomposites. As depicted
in Fig. 3, while neat PLA presents high transparency over the 250–800 nm region, the transmittance of nanocomposites, which ac-counts for the relative number of photons that pass through thefilm under an incident light, continuously decrease upon ZnO loading.
Table 2summarizes the transmitted light in both UV and visible regions, where remarkable differences could be observed between both types of nanoparticles, especially in the UV region. Unlike ZnO_r na-noparticles, which show a strong exciton absorption band at 363 nm, ZnO_s does not show any characteristic exciton absorption in the stu-died range. Accordingly, the addition of ZnO_r reduces the amount of transmitted ultraviolet light from 94.8% for PLA to 21.5% for its PLA/ ZnO_r 10 wt% nanocomposite. This may be ascribed to the fact that ZnO nanoparticles absorb UV light because of their electronic structure characterized by an empty conduction band and afilled valence band. It is shown that spherical zinc oxide does not substantially block UV light, which may be due to aggregation of NPs. Moreover, the transparency of nanocomposites which, according to the ASTM D1746-03 standard, is defined as the amount of transmitted light in the 540–560 nm range, drops from 96% for neat PLA to 73.3 and 70.9% for nanocomposites containing 10 wt% of ZnO_r and ZnO_s, respectively. The lower de-crease in transparency for the PLA/ZnO_r system could be explained by the fact that, according to the Rayleigh scattering, upon particle ag-gregation a transparency loss and film whitening occurs. This is in agreement with TEM micrographs shown inFig. 2, where the dispersion of ZnO_r within PLA was more homogeneous than that using ZnO_s. 3.4. Glass transition and physical aging of PLA, PLA/ZnO_r and PLA/ZnO_s nanocomposites
The impact of the two types of nanoparticles on the polymer re-laxation phenomena was probed by analysing the glass transition and the physical aging kinetics. The main results are presented inTable 3
and the DSC curves are shown in the Supporting Information (Fig. S2to
Fig. S5). The glass transition temperature (Tg) of the PLA/ZnO_r
na-nocomposites was slightly inferior to that of PLA. This can be explained by a probable degradation of the PLA chains duringfilm preparation, although the material was thoroughly dried before hot-moulding of the films. Indeed, ZnO particles are known to be able to catalyse the de-gradation reaction of PLA [24,25]. Some works have reported on the use of surface treatments such as silanization to protect the polymer during melt processing. Pantani et al. [26] and Murariu et al. [28] did not observe a shift to Tgin PLA/ZnO nanorods composites produced by
Fig. 1. Representative TEM images showing bare ZnO-s (a) and ZnO-r (d) nanoparticles and their dispersion within the PLA matrix: PLA/ZnO_s 1 wt% (b); PLA/ZnO_s 10 wt% (c); PLA/ZnO_r 1 wt% (e) and PLA/ZnO_r 10 wt% (f).
Table 1
Characteristic thermodegradation temperatures (T5%, T10% and Tpeak) and
maximum degradation rates (αmax) of neat PLA and its ZnO_r and ZnO_s
na-nocomposites. Sample ZnO (wt. %) T5%(°C) T10%(°C) Tpeak(°C) αmax(%/°C) FWHM (°C) PLA 0 330.8 340.9 366.2 −0.00632 21.8 PLA/ZnO_r 0.2 257.6 267.3 300.5 −0.00534 28.8 PLA/ZnO_r 0.5 250.9 260.9 293.5 −0.00596 24.2 PLA/ZnO_r 1 250.4 259.3 288.8 −0.00682 20.6 PLA/ZnO_r 5 242.4 252.6 281.9 −0.00618 21.6 PLA/ZnO_r 10 237.1 247.1 276.8 −0.00565 23.2 PLA/ZnO_s 0.2 277.6 287.5 335.2 −0.00346 45.1 PLA/ZnO_s 0.5 262.6 271.6 308.4 −0.00550 24.4 PLA/ZnO_s 1 254.9 264.2 297.3 −0.00573 25.3 PLA/ZnO_s 5 250.2 260.7 289.1 −0.00682 20.9 PLA/ZnO_s 10 243.3 252.8 281.7 −0.00616 20.8
melt compounding using surface compatibilisation, while Anzlovar et al. [27] reported that the average molar mass of PLA in PLA/ZnO nanocomposites obtained by melt extrusion was almost halved. They observed a Tgincrease of 36 °C upon inclusion of 1% ZnO nanoparticles
by injection moulding, which was a much larger shift than that ob-served in the present work. The inclusion of PLA/ZnO_s nanocompo-sites at low concentrations had no impact on the Tg(Table 3). Starting
with a concentration of 1 wt%, the Tgshifted to lower temperatures.
The behaviour is consistent with the data of the thermal stability of the nanocomposites.Fig. 2shows that nanocomposites of ZnO_s 0.2 and
0.5 wt% are slightly more stable than the other materials. Furthermore, the height of the heat capacity step at the glass transition of all mate-rials was constant (Table 3, column ΔCp).
The width of the glass transition is a measure of local dynamic heterogeneity in a polymer and extensive literature exists investigating the impact of nanocharges on the local mobility of macromolecules [29].Table 3shows that the width of the glass transition increased in the case of PLA/ZnO_r 5 and 10 wt%, but only in the case of PLA/ZnO_s 10 wt%. The presence of the ZnO nanoparticles in the material could therefore impact the local chain mobility. The ZnO_s particles had
100 150 200 250 300 350 400 450 500 0 20 40 60 80 100 Relative weight (% ) Temperature (ºC) neat PLA 0.2wt.% ZnO-r 0.5wt.% ZnO-r 1wt.% ZnO-r 5wt.% ZnO-r 10wt.% ZnO-r 100 150 200 250 300 350 400 450 500 0,000 -0,001 -0,002 -0,003 -0,004 -0,005 -0,006 -0,007 W
eigh loss rate
Temperature (ºC) neat PLA 0.2wt.% ZnO-r 0.5wt.% ZnO-r 1wt.% ZnO-r 5wt.% ZnO-r 10wt.% ZnO-r 100 150 200 250 300 350 400 450 500 0 20 40 60 80 100 Relative weight (% ) Temperature (ºC) neat PLA 0.2wt.% ZnO-s 0.5wt.% ZnO-s 1wt.% ZnO-s 5wt.% ZnO-s 10wt.% ZnO-s 100 150 200 250 300 350 400 450 500 0,000 -0,001 -0,002 -0,003 -0,004 -0,005 -0,006 -0,007 W
eigh loss rate
Temperature (ºC) neat PLA 0.2wt.% ZnO-s 0.5wt.% ZnO-s 1wt.% ZnO-s 5wt.% ZnO-s 10wt.% ZnO-s
a)
b)
c)
d)
Fig. 2. A) Thermogravimetric traces and b) weight lost rates of PLA/ZnO_r nanocomposites; c) thermogravimetric traces and d) weight lost rates of PLA/ZnO_s nanocomposites.
higher tendency to aggregate, which might explain that the effect is only observed at the highest concentration [30], as previously showed for the inclusion of carbon nanotubes into PLA, which resulted in an increase of dynamic heterogeneity.
In the aim to investigate further the impact of the presence of the ZnO nanoparticles on the non-equilibrium structural relaxation of PLA, a study of the physical aging was performed. The total recovery of enthalpy (ΔH∞) was estimated after the relation
= −
∞
H C T T
Δ Δ p( g a). (4)
The results are given inTable 3and show the impact of the degree of undercooling on the estimated value. At equal degree of under-cooling, the presence of ZnO particles had no impact, being a result of the absence of change inΔCp. The increase of the recovered enthalpy
with increasing aging times of the PLA/ZnO nanocomposites is shown inFig. 4. The quantity of recovered enthalpy at the longest aging times was near to the estimated total enthalpy loss, which showed that the theoretical thermodynamic equilibrium (within the measurement un-certainty) was reached within the experimental time. The HΔ values of PLA reached after 1000 min aging are comparable to already published data [31–33]. The curves in Fig. 4a–b shows hardly any difference
among the PLA/ZnO_r nanocomposites with different particle con-centrations. All nanocomposites curves are having higher recovery of enthalpy than PLA at a given aging time. Dispersion of experimental data was higher in the case of ZnO_s nanocomposites (Fig. 4b). For quantification purposes, the relaxation rate was calculated using the data inFig. 4after the following equation [34]:
= ∂ ∂
βH [ δH/ (logta)]q q T1 2, ,a, (5) whereβHis the relaxation rate in J.g−1per decade,δHthe enthalpy loss
in J.g−1, t
athe aging time, q1 the cooling rate in °C.min−1, q2 the
heating rate in °C.min−1and Tathe aging temperature. The rates q1and
q2 werefixed at 10 °C.min−1. The results are listed in Table 3. The
observed relaxation rate of the neat PLA was faster than the value published by Pan et al. [34] (1.77 J g−1 per decade) at similar
undercooling (18 °C), and slower than the results reported by Lizundia et al. [17], who observed a quite high relaxation rate (3.2 J g−1per decade) at 16 °C undercooling (in the latter a different experimental protocol for performing the sample aging ex situ in an oven was done). Average molecular mass differences and experimental uncertainty could be a reason for the observed discrepancies, while differences in the PLA stereochemistry seem to be less important [35]. For example, the relaxation rate of polystyrene decreased with increasing molecular weight [36]. Because of the differences between the degree of under-cooling and a decrease in molecular weight of PLA in the ZnO nano-composites, a comparison is not evident. The higher undercooling would cause faster relaxation rates of PLA, while higher molecular weight would slower relaxations. Slower aging kinetics of PLA/nano-clay composites were reported by Ref. [37]. On the other side, Lizundia et al. [17] showed with a different experimental protocol that the
in-clusion of up to 2 w% ZnO_r decelerated the relaxation rate (observed values between 0.9 and 1.25 J/g), and at 5 w% ZnO_r the relaxation rate was almost equal to that of neat PLA. In the present case, the initial relaxation rate of the ZnO_r nanocomposites was accelerated compared to PLA and the increase of the ZnO_r concentration decreased the re-laxation rate. The presence of small concentrations of ZnO_s in PLA had no impact on the relaxation rate, only with 5 and 10 wt% a deceleration was found (Table 3).
There is a large discussion on the impact of nanoparticles on the physical aging rates of polymers and results in the literature are con-tradictory [18]. For further insight, we investigated the recovery function, calculated from:
= ∞− ∞ φ t H H t H ( ) Δ Δ ( ) Δ a a (6) The recovery functions of the different samples are shown inFig. 5. The inspection of the curves gives supplementary information to the relaxation rate, i.e. the speed of the aging process characterized by the time to reach equilibrium.Fig. 5a–b shows that the nanocomposites
reach the equilibrium time at shorter times compared to PLA. The counterintuitive enhancement of the physical aging upon ZnO_r and ZnO_s incorporation may be explained in terms on non-attractive interactions between the hosting amorphous PLA phase and the surface of the non-compatibilized inorganic nanoparticles. A similar effect was firstly reported by Boucher et al. [13,38], who ascribed the accelerated physical aging rates in poly (methyl methacrylate)/silica nanocompo-sites to a mismatch between the hosting polymer and the reinforcing phase, facilitating the diffusion of free volume holes to the interfaces polymer/nanoparticle interfaces. This effect has been found to occur also in other polymer nanocomposite systems such as polycarbonate nanocomposites containing grafted nanosilica particles [39]. As the diffusion of the free volume is governed by the amount of available ZnO surfaces [40], the occurring nanoparticle aggregation as concentration increased lowers the effect of ZnO on the overall aging kinetics. It was
Table 2
Transmitted light (%) in the UV Region (360 nm) and visible region (540–560 nm) through nanocomposites films having ~10 μm thickness.
PLA/ZnO_r PLA/ZnO_s 360 nm 540–560 nm 360 nm 540–560 nm 0 wt.% 94.8 96.0 94.8 96.0 0.2 wt.% 88.4 90.6 87.9 91.7 0.5 wt.% 74.5 86.7 86.7 89.2 1 wt.% 64.9 83.2 79.6 81.4 5 wt.% 38.3 80.7 72.1 75.9 10 wt.% 21.5 73.3 67.7 70.9 Table 3
Summary of thermal properties of PLA and PLA/ZnO nanocomposites.
Sample ZnO (wt.%) Tg(°C) Width (°C) ΔCp(J g−1min−1) ΔH∞(J g−1) β (J g−1/lg (min))
PLA 0 56 ± 1 5.1 ± 0.5 0.554 ± 0.012 9.2 2.3 ± 0.1 PLA_ZnO_r 0.2 50 ± 2 6.4 ± 1 0.562 ± 0.005 6.2 2.8 PLA_ZnO_r 0.5 50 ± 2 5.9 ± 0.5 0.554 ± 0.009 6.2 2.6 PLA_ZnO_r 1 52 ± 1 5.5 ± 0.5 0.556 ± 0.016 7.0 2.5 PLA_ZnO_r 5 49 ± 1 6.5 ± 0.5 0.574 ± 0.039 6.0 2.1 PLA_ZnO_r 10 49 ± 1 6.7 ± 0.5 0.520 ± 0.005 5.1 2.0 PLA_ZnO_s 0.2 57 ± 1 5.4 ± 2 0.526 ± 0.005 9.3 2.4 PLA_ZnO_s 0.5 56 ± 1 4.0 ± 0.5 0.536 ± 0.005 9.2 2.3 PLA_ZnO_s 1 51 ± 1 5.0 ± 0.5 0.557 ± 0.019 6.7 2.5 PLA_ZnO_s 5 50 ± 1 5.5 ± 0.5 0.550 ± 0.008 6.2 2.0 PLA_ZnO_s 10 51 ± 1 7.2 ± 0.5 0.549 ± 0.005 6.7 2.1
Tg: Mid-point glass transition temperature; CΔ p: heat capacity step at Tgnormalized by the PLA content;ΔH∞: enthalpy of recovery for an infinitive duration of aging
Fig. 4. Increase of the enthalpy of recovery with the aging time normalized to the PLA content of the nanocomposites. A) enthalpy of recovery of PLA and PLA/ZnO_r nanocomposites, b) enthalpy of recovery of PLA and PLA/ZnO_s nanocomposites.
Fig. 5. Enthalpy of recovery functions of PLA and PLA/ZnO nanocomposites. A) PLA/ZnO_r nanocomposites at different ZnO_r concentrations, b) PLA/ZnO_s nanocomposites at different ZnO_s concentrations, c) shifted enthalpy of recovery function of PLA/ZnO_r nanocomposites to the curve of PLA, d) shifted enthalpy of recovery function of PLA/ZnO_s nanocomposites to the curve of PLA.
possible to superpose the relaxation functions of the nanocomposites and the PLA on a single master curve by a horizontal shift as proposed by Boucher et al. [13].Fig. 5c anddshow the obtained master curves. This behaviour suggested, that the underlying macromolecular relaxa-tion phenomena of PLA was not impacted by the presence of the na-noparticles notwithstanding their shape factor.
In any case, those reported results here for amorphous PLA/ZnO nanocomposites follow opposite trend reported by Lizundia et al. [22] for the crystalline PLLA/ZnO system, suggesting that the presence of crystalline phases needs to be taken into account when analysing physical aging in polymers.
3.5. Transport properties of PLA/ZnO nanocomposites
The mass transport properties of PLA/ZnO nanocomposites were investigated by the analysis of helium (P(He)) and oxygen permeability (P(O2)) (seeTable S2for the corresponding permeabilities). Helium is a
small, non-interacting molecule with polymers, sensitive on tortuosity effects and having the advantage of needing much shorter experimental times compared to oxygen. The P(He) and P(O2) of PLA amounted to
58 ± 5.10−18 (m3m m−2. s−1. Pa−1) and 2.6 ± 0.2 10−18
(m3m m−2. s−1. Pa−1), respectively. Those values were in the range of
already published data [41–43]. The low compatibility of PLA and non-modified ZnO had as a consequence that the samples were mechanically very brittle. As our group has previously shown, the elongation at break decreases from nearly 4.6% for neat PLA to 1.2% for its 5 wt%
nanocomposite [17,24]. This was expected from other reports on non-compatibilized ZnO nanocomposites done by solvent casting [25,44,45]. The P(He) could be obtained for samples up to 1 wt% ZnO (for [SI] = 10−18 (m3m m−2. s−1. Pa−1): ZnO_r 0.5 wt % 74 ± 7, ZnO_r 1 wt% 67 ± 7, ZnO_s 0.5 wt % 69 ± 7, ZnO_s 1 wt % 62 ± 7 (seeTable S2in the Supporting Information). At higher concentrations, thefilms broke in the measurement device. With regard to the experi-mental uncertainty, no significant difference among the PLA/ZnO na-nocomposites was observed. In the case of P(O2), the measurement
times were longer, typically one day compared to 1 h for P(He). Therefore, most of the samples broke during the measurement. In case of successful measurement, the P(O2) of ZnO_r 1 wt% amounted to
2.7 ± 0.2 (see Supporting Information). This confirmed the prediction of P(He) that the distribution of ZnO did not allow for increasing barrier properties. In the case of melt-extruded PLA/ZnO nanoparticles (rod shape), a decrease of about 18% in P(O2) was reported for a
nano-composite having 5 wt% nanoparticles [46]. Studies on water vapour permeability of nanocomposites of PLA and rod-shaped ZnO nano-particles showed either very small or no gains [26,44]. This result can be expected, because nanospheres or rods have a small shape factor and they do therefore not induce much tortuosity to the diffusive pathway. In the case of permeates, which interact with the polymer and can induce swelling, a decrease of the overall mass transport can be achieved by the hindering of the polymer relaxation. Espino et al. [20] showed that the anisole transport, which is an aroma compound and has high affinity to PLA, could be decreased by the inclusion of neat and surface-grafted cellulose nanocrystals. Here, the anisole mass uptake of the PLA/ZnO nanocomposites was measured with the help of a micro-balance. This method has the advantage that small samples can be used and no mechanical stress exerted. The experimental data shown in
Fig. 6a report on the mass uptake kinetics of the sample set. The spikes on the curves originate from the measurement method and can be cancelled out.Fig. 6b shows the transport data on the time scale nor-malized with the sample thickness in the aim to easier compare the mass uptake rates. Except PLA at long times, all curves linearized on the squared root of time, which indicates an essentially Fickian mass transport mechanism. Because of the sample thickness of the nano-composites, the non-Fickian transport mechanisms could not be ob-served within the experimental time scale. The curves show further-more that within the experimental time, the equilibrium mass uptake was not reached. In the case of the PLA blank, it was possible to obtain a thinner sample, which allowed to approach the mass uptake of the Fickian equilibrium (meq,app= 0,34%) and to calculate an apparent
diffusion coefficient (Dapp= 6.0.10−14m2s−1), which was consistent
Fig. 6. Anisole sorption kinetics in PLA and PLA/ZnO nanocomposites, a) experimental sorption data, b) sorption data on the square root of experimental time normalized by the sample thickness. The perturbation in the mass uptake curves correspond to the re-regulation of the anisole activity in the measurement cell to avoid balance drift.
Table 4
Transport properties of anisole mass uptake in PLA and PLA/ZnO nano-composites. Sample ZnO (wt. %) L (m) × 10−4 s (s0.5) × 10−6 s × L (s0.5.m) × 10−10 PLA 0.556 10.9 6.1 PLA/ZnO_r 0.2 1.52 3.53 5.4 PLA/ZnO_r 0.5 1.67 7.47 12 PLA/ZnO_r 1 1.98 2.44 4.8 PLA/ZnO_r 5 1.82 4.96 9.0 PLA/ZnO_r 10 2.64 5.43 14 PLA/ZnO_s 0.2 1.58 4.94 7.8 PLA/ZnO_s 0.5 1.70 5.43 9.2 PLA/ZnO_s 1 1.77 5.61 9.9 PLA/ZnO_s 5 1.71 6.11 10 PLA/ZnO_s 10 Nofilm
with Espino's work [20]. Because of the high uncertainty of the value of the equilibrium mass uptake, in the following only the kinetics of the transport obtained from the initial slopes is discussed.
The computed data are shown inTable 4. The comparison of the slopes showed faster mass transport in the nanocomposites. A similar result was obtained upon the study of water mass transport in PLA/ZnO composites [26]. Low interfacial adhesion bringing supplementary voids to the material might be a reason for this behaviour. PLA/ZnO_s nanocomposites had, at the same concentration, higher diffusion coef-ficients than PLA/ZnO_r nanocomposites. The ZnO_s particles were more aggregated compared to the ZnO_r particles which can be ob-served in the TEM micrographs (Fig. 1) and inferred from the low UV shielding effect of ZnO_s. In conclusion, the rod shape seems to be fa-vourable to obtain a more homogenous dispersion of ZnO particles in PLA. The higher dispersion quality brings about better properties. 4. Conclusions
Here we report on the structural relaxation, gas transport and ani-sole (an aroma compound) sorption kinetics of PLA/ZnO nanocompo-sites having both spherical and rod-shaped nanoparticles. Results are analyzed in terms of nanoparticle morphology, concentration and dis-persion within the amorphous hosting PLA matrix. Morphological analysis reveals a homogeneous distribution of ZnO_r within the hosting PLLA matrix, while ZnO_s nanoparticles remain highly aggregated. This better dispersion of rod-shaped nanoparticles in regard with spherical ones leads to improved UV-Vis properties, where UV light is markedly blocked while the samples remains transparent in the visible region. Higher physical aging rates were obtained upon both ZnO_r and ZnO_s incorporation as a result of the low interfacialfiller-matrix adhesion, which in turn speeds up macromolecular conformation towards the thermodynamic equilibrium. Finally, oxygen and helium permeability tests and anisole sorption tests were carried out as a model gases for the determination of the gas transport properties of developed nano-composites. These results confirmed the poor interfacial adhesion ob-served during the structural relaxation analyses, which together with a low tortuosity effect, yield increased permeability values after nano-particle addition. The results here reported may serve to raise aware-ness on the relevance of nanoparticle morphology and crystalline/ amorphous character of the hosting matrix on the resulting relaxation and transport properties of the nanocomposites.
Data availability
All the data used to support thefindings of this study are included within the article.
Acknowledgements
Technical and human support provided by SGIker (UPV/EHU, MICINN, GV/EJ, EGEF and ESF) is gratefully acknowledged. Authors thank the Basque Country Government forfinancial support (IT718-13).
Appendix A. Supplementary data
Supplementary data to this article can be found online athttps:// doi.org/10.1016/j.polymertesting.2019.02.009.
References
[1] V. Ducruet, S. Domenek, Characteristics and applications of poly(lactic acid), in: S. Kalia, L. Averous (Eds.), Biodegradable and Bio-Based Polymers: Environmental and Biomedical Applications, Scrivener Publishing LLC, Beverly, MA, 2015, pp. 171–224.
[2] E. Lizundia, E. Fortunati, F. Dominici, J.L. Vilas, L.M. Leon, I. Armentano, L. Torre, J.M. Kenny, PLLA-grafted cellulose nanocrystals: role of the CNC content and
grafting on the PLA bionanocompositefilm properties, Carbohydr. Polym. 142 (2016) 105–113.
[3] I. Armentano, N. Bitinis, E. Fortunati, S. Mattioli, N. Rescignano, R. Verdejo, M.A. Lopez-Manchado, J.M. Kenny, Multifunctional nanostructured PLA materials for packaging and tissue engineering, Prog. Polym. Sci. 38 (2013) 1720–1747. [4] D. Lee, K. Yam, L. Piergiovanni, Permeation of gas and vapor, Pack. Sci. Techol. 4
(2008) 79–80.
[5] M.A. Ortenzi, L. Basilissi, H. Farina, G. Di Silvestro, L. Piergiovanni, E. Mascheroni, Evaluation of crystallinity and gas barrier properties offilms obtained from PLA nanocomposites synthesized viaˮin situˮ polymerization of L-lactide with silane-modified nanosilica and montmorillonite, Eur. Polym. J. 66 (2015) 478–491. [6] E.M. Davis, G. Theryo, M.A. Hillmyer, R.A. Cairncross, Y.A. Elabd, Liquid water
transport in polylactide Homo and graft copolymers, ACS Appl. Mater. Interfaces 3 (2011) 3997–4006.
[7] E. Lizundia, J.L. Vilas, A. Sangroniz, A. Eticeberria, Light and gas barrier properties of PLLA/metallic nanoparticles compositefilms, Eur. Polym. J. 91 (2017) 10–20. [8] E. Lizundia, U. Goikuria, J.L. Vilas, F. Cristofaro, G. Bruni, E. Fortunati,
I. Armentano, L. Visai, L. Torre, Metal nanoparticles embedded in cellulose nano-crystal basedfilms: material properties and post-use analysis, Biomacromolecules 19 (2018) 2618–2628.
[9] S. Trujillo, E. Lizundia, J.L. Vilas, M. Salmeron-Sanchez, PLLA/ZnO nanocompo-sites: dynamic surfaces to harness cell differentiation, Colloids Surfaces B Biointerfaces 144 (2016) 152–160.
[10] W.H. Li, L. Li, Y. Cao, T.Q. Lan, H.Y. Chen, Y.Y. Qin, Effects of PLA film in-corporated with ZnO nanoparticle on the quality attributes of fresh-cut apple, Nanomaterials 7 (2017) 207.
[11] H. Zhang, M. Hortal, M. Jorda-Beneyto, E. Rosa, M. Lara-Lledo, I. Lorente, ZnO-PLA nanocomposite coated paper for antimicrobial packaging application, LWT - Food Sci. Technol. 78 (2017) 250–257.
[12] P. Rittigstein, R.D. Priestley, L.J. Broadbelt, J.M. Torkelson, Model polymer nano-composites provide an understanding of confinement effects in real nanocompo-sites, Nat. Mater. 6 (2007) 278–282.
[13] V.M. Boucher, D. Cangialosi, A. Alegria, J. Colmenero, Enthalpy recovery of PMMA/silica nanocomposites, Macromolecules 43 (2010) 7594–7603. [14] M. Pluta, M.A. Paul, M. Alexandre, P. Dubois, Plasticized polylactide/clay
nano-composites. II. The effect of aging on structure and properties in relation to the filler content and the nature of its organo-modification, J. Polym. Sci. B Polym. Phys. 44 (2006) 312–325.
[15] M. Pluta, M. Murariu, M. Alexandre, A. Galeski, P. Dubois, Polylactide composi-tions. The influence of ageing on the structure, thermal and viscoelastic properties of PLA/calcium sulfate composites, Polym. Degrad. Stabil. 93 (2008) 925–931. [16] E. Lizundia, J.L. Vilas, L.M. Leon, Crystallization, structural relaxation and thermal
degradation in Poly(L-lactide)/cellulose nanocrystal renewable nanocomposites, Carbohydr. Polym. 123 (2015) 256–265.
[17] E. Lizundia, L. Perez-Alvarez, M. Saenz-Perez, D. Patrocinio, J.L. Vilas, L.M. Leon, Physical aging and mechanical performance of poly(L-lactide)/ZnO nanocompo-sites, J. Appl. Polym. Sci. 133 (2016) 43619.
[18] D. Cangialosi, V.M. Boucher, A. Alegria, J. Colmenero, Physical aging in polymers and polymer nanocomposites: recent results and open questions, Soft. Matter 9 (2013) 8619–8630.
[19] D. Cangialosi, A. Alegria, J. Colmenero, Effect of nanostructure on the thermal glass transition and physical aging in polymer materials, Prog. Polym. Sci. 54–55 (2016) 128–147.
[20] E. Espino-Pérez, J. Bras, G. Almeida, C. Plessis, N. Belgacem, P. Perré, S. Domenek, Designed cellulose nanocrystal surface properties for improving barrier properties in polylactide nanocomposites, Carbohydr. Polym. 183 (2018) 267–277. [21] J. Crank, The Mathematics of Diffusion, second ed., Oxford University Press, 1956. [22] E. Lizundia, J.R. Sarasua, Physical aging in poly(L-lactide) and its multi-wall carbon
nanotube nanocomposites, Macromol. Symp. 321 (2012) 118–123.
[23] M. Rezakazemi, A.E. Amooghin, M.M. Montazer-Rahmati, A.F. Ismail, T. Matsuura, State-of-the-art membrane based CO2 separation using mixed matrix membranes (MMMs): an overview on current status and future directions, Prog. Polym. Sci. 39 (2014) 817–861.
[24] E. Lizundia, L. Ruiz-Rubio, J.L. Vilas, L.M. Leon, Towards the development of eco-friendly disposable polymers: ZnO-initiated thermal and hydrolytic degradation in poly(L-lactide)/ZnO nanocomposites, RSC Adv. 6 (2016) 15660–15669. [25] M. Murariu, A. Doumbia, L. Bonnaud, A.L. Dechief, Y. Paint, M. Ferreira,
C. Campagne, E. Devaux, P. Dubois, High-Performance polylactide/ZnO nano-composites designed forfilms and fibers with special end-use properties, Biomacromolecules 12 (2011) 1762–1771.
[26] R. Pantani, G. Gorrasi, G. Vigliotta, M. Murariu, P. Dubois, PLA-ZnO nanocomposite films: water vapor barrier properties and specific end-use characteristics, Eur. Polym. J. 49 (2013) 3471–3482.
[27] A. Anzlovar, A. Krzan, E. Zagar, Degradation of PLA/ZnO and PHBV/ZnO compo-sites prepared by melt processing, Arabian J. Chem. 11 (2018) 343–352. [28] M. Murariu, Y. Paint, O. Murariu, J.M. Raquez, L. Bonnaud, P. Dubois, Current
progress in the production of PLA-ZnO nanocomposites: beneficial effects of chain extender addition on key properties, J. Appl. Polym. Sci. 132 (2015) 42480. [29] J. Jancar, J.F. Douglas, F.W. Starr, S.K. Kumar, P. Cassagnau, A.J. Lesser,
S.S. Sternstein, M.J. Buehler, Current issues in research on structuproperty re-lationships in polymer nanocomposites, Polymer 51 (2010) 3321–3343. [30] O. Yousefzade, H. Garmabi, J. Puiggali, Cooperative rearranging region and
dy-namical heterogeneity of nanocomposites in poly(l-lactide) and functionalized carbon nanotubes systems, Thermochim. Acta. 667 (2018) 35–41.
[31] N. Delpouve, M. Arnoult, A. Saiter, E. Dargent, J.M. Saiter, Evidence of two mobile amorphous phases in semicrystalline polylactide observed from calorimetric
investigations, Polym. Eng. Sci. 54 (2014) 1144–1150.
[32] L. Dobircau, N. Delpouve, R. Herbinet, S. Domenek, L. Le Pluart, L. Delbreilh, V. Ducruet, E. Dargent, Molecular mobility and physical ageing of plasticized poly (lactide), Polym. Eng. Sci. 55 (2015) 858–865.
[33] X. Monnier, S.F. Nassar, S. Domenek, A. Guinault, C. Sollogoub, E. Dargent, N. Delpouve, Reduced physical aging rates of polylactide in polystyrene/polylactide multilayerfilms from fast scanning calorimetry, Polymer 150 (2018) 1–9. [34] P.J. Pan, B. Zhu, Y. Inoue, Enthalpy relaxation and embrittlement of Poly(L-lactide)
during physical aging, Macromolecules 40 (2007) 9664–9671.
[35] K. Aou, S.L. Hsu, L.W. Kleiner, F.-W. Tang, Roles of conformational and config-urational defects on the physical aging of amorphous poly(lactic acid), J. Phys. Chem. B 111 (2007) 12322–12327.
[36] J. Málek, Volume and enthalpy relaxation rate in glassy materials, Macromolecules 31 (1998) 8312–8322.
[37] M.L. Maspoch, O.O. Santana, J. Cailloux, E. Franco-Urquiza, C. Rodriguez, J. Belzunce, A.B. Martinez, Ductile-brittle transition behaviour of PLA/o-MMTfilms during the physical aging process, Express Polym. Lett. 9 (2015) 185–195. [38] V.M. Boucher, D. Cangialosi, A. Alegria, J. Colmenero, J. Gonzalez-Irun, L.M.
Liz-Marzan, Accelerated physical aging in PMMA/silica nanocomposites, Soft Matter 6 (2010) 3306–3317.
[39] V. Ramakrishnan, S. Harsiny, J.G.P. Goossens, T.L. Hoeks, G.W.M. Peters, Physical aging in polycarbonate nanocomposites containing grafted nanosilica particles: a comparison between enthalpy and yield stress evolution, J. Polym. Sci. B Polym.
Phys. 54 (2016) 2069–2081.
[40] V.M. Boucher, D. Cangialosi, A. Alegria, J. Colmenero, Time dependence of the segmental relaxation time of poly(vinyl acetate)-silica nanocomposites, Phys. Rev. 86 (2012) 041501.
[41] C. Courgneau, S. Domenek, R. Lebosse, A. Guinault, L. Averous, V. Ducruet, Effect of crystallization on barrier properties of formulated polylactide, Polym. Int. 61 (2012) 180–189.
[42] A. Guinault, C. Sollogoub, V. Ducruet, S. Domenek, Impact of crystallinity of poly (lactide) on helium and oxygen barrier properties, Eur. Polym. J. 48 (2012) 779–788.
[43] S.F. Nassar, A. Guinault, N. Delpouve, V. Divry, V. Ducruet, C. Sollogoub, S. Domenek, Multi-scale analysis of the impact of polylactide morphology on gas barrier properties, Polymer 108 (2017) 163–172.
[44] S. Shankar, L.-F. Wang, J.-W. Rhim, Incorporation of zinc oxide nanoparticles im-proved the mechanical, water vapor barrier, UV-light barrier, and antibacterial properties of PLA-based nanocompositefilms, Mater. Sci. Eng. C 93 (2018) 289–298.
[45] I. Restrepo, N. Benito, C. Medinam, R.V. Mangalaraja, P. Flores, S. Rodriguez-Llamazares, Development and characterization of polyvinyl alcohol stabilized polylactic acid/ZnO nanocomposites, Mater. Res. Express 4 (2017) 105019. [46] A. Marra, C. Silvestre, D. Duraccio, S. Cimmino, Polylactic acid/zinc oxide
bio-compositefilms for food packaging application, Int. J. Biol. Macromol. 88 (2016) 254–262.


![[PDF] Support d’introduction aux Réseaux Locaux Haut débit | Cours informatique](data:image/gif;base64,R0lGODlhAQABAIAAAP///wAAACH5BAEAAAAALAAAAAABAAEAAAICRAEAOw==)