Cavitation Dynamics at Sub-Millimeter Scale
Texte intégral
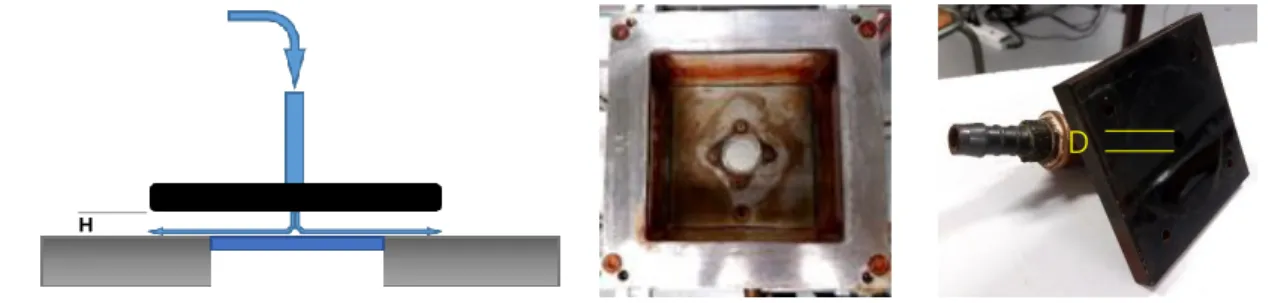
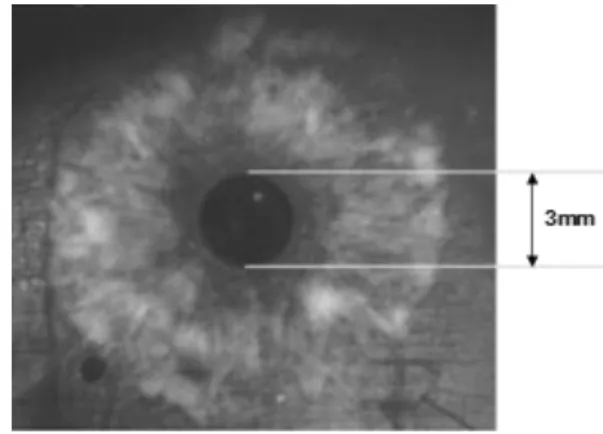
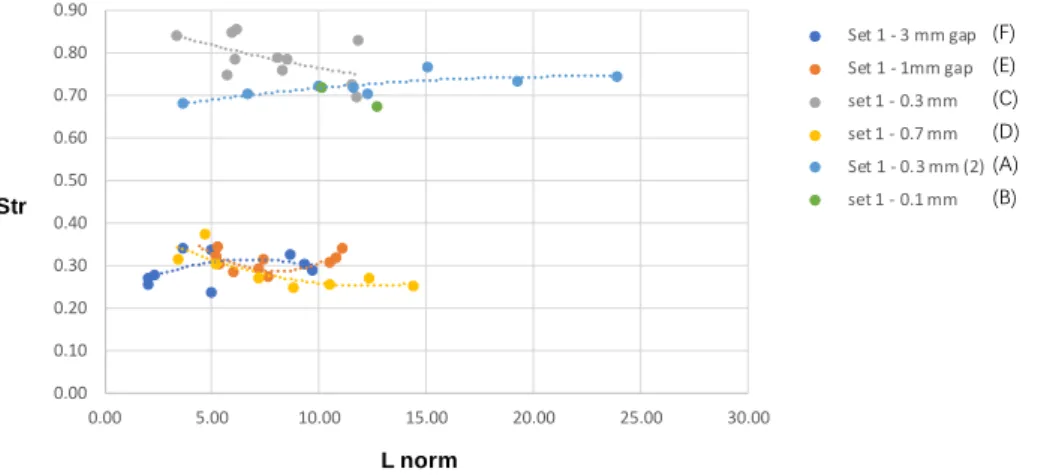
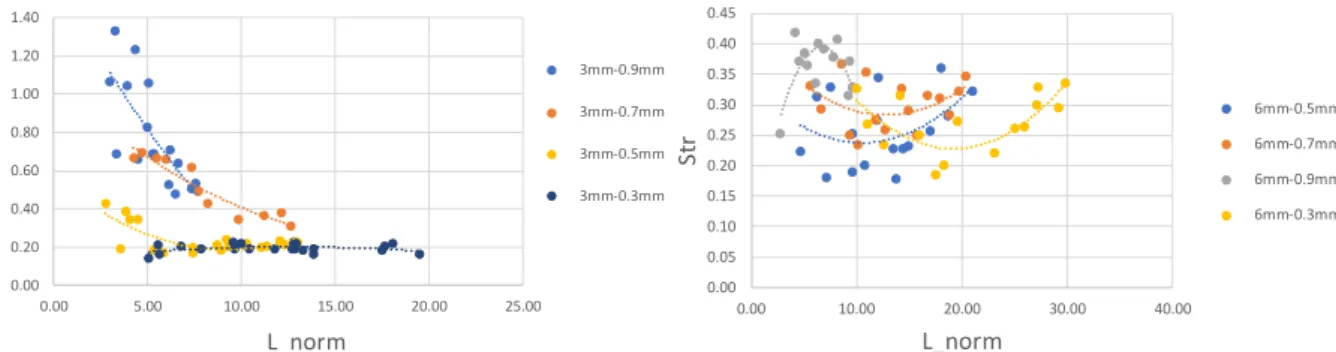
Figure
Documents relatifs
Your station score for ten-minute stations represents how many checklist items you did correctly (80 percent of the station score) and how the examiners rated your performance
Subject to the conditions of any agreement between the United Nations and the Organization, approved pursuant to Chapter XVI, States which do not become Members in
Table 1: Amino acid composition (\:) of female winter flounder vitellogenin a nd peak A.. 31 Table 2: Ultracentrifugation analysis of fema
D´ eduire (sans calcul mais en justifiant la d´ emarche) des questions pr´ ec´ edentes le tableau de variations de f sur R et l’´ equation de la tangente au point
For vibrational absorption, the situation is the opposite: absorption by the umbrella mode of individual methyl groups is substantial [33], and most of it is due to the hydrogen and
When a number is to be multiplied by itself repeatedly, the result is a power of this number.
Centre International de Mathématiques Pures et Appliquées), an interna- tional organization helping to promote the mathemati- cal sciences in developing countries supported by
Selected answers/solutions to the assignment due November 5, 2015.. (a) For x = 0, the first column is proportional to the
