HAL Id: ird-00310138
https://hal.ird.fr/ird-00310138
Submitted on 7 Aug 2008
HAL is a multi-disciplinary open access archive for the deposit and dissemination of sci-entific research documents, whether they are pub-lished or not. The documents may come from teaching and research institutions in France or abroad, or from public or private research centers.
L’archive ouverte pluridisciplinaire HAL, est destinée au dépôt et à la diffusion de documents scientifiques de niveau recherche, publiés ou non, émanant des établissements d’enseignement et de recherche français ou étrangers, des laboratoires publics ou privés.
Tree-rings and the climate of New Caledonia (SW
pacific) preliminary results from Araucariacae
Vincent Lieubeau, Pierre Genthon, M. Stievenard, R. Nasi, Valérie
Masson-Delmotte
To cite this version:
Vincent Lieubeau, Pierre Genthon, M. Stievenard, R. Nasi, Valérie Masson-Delmotte. Tree-rings and the climate of New Caledonia (SW pacific) preliminary results from Araucaria-cae. Palaeogeography, Palaeoclimatology, Palaeoecology, Elsevier, 2007, 253 (3-4), pp.477-489. �10.1016/j.palaeo.2007.06.019�. �ird-00310138�
Tree-rings and the climate of New Caledonia (SW Pacific).
1Preliminary results from Araucariacae.
23
Lieubeau Vincent
(1), Genthon Pierre
(1,*), Stievenard Michel
(3), Nasi Robert
(2), 4Masson-Delmotte, Valérie
(3)5 6
1 IRD Paléotropique Noumea BP A5 98848 Noumea New Caledonia
7
2 CIFOR/CIRAD , TA 10/D 34398 Montpellier France
8
3 Laboratoire des Sciences du Climat et de l’Environnement, IPSL/CEA-CNRS Gif/Yvette
9
France. 10
* corresponding author at genthon@msem.univ-montp2.fr, fax: 334 67 14 74 47 11 12 13 14 Abstract 15 16
The dendroclimatologic potential of some Araucariacae of New Caledonia (including Agathis, or
17
kauris, and Araucaria) is assessed using ring thickness and δ18O measurements. New Caledonia is a
18
group of islands in the SW Pacific that are currently under influence of ENSO events. Endemic to
19
New Caledonia, the long-living species of Agathis lanceolata and A. ovata, growing on poor
20
ultramafic-derived soils may provide valuable proxies for the local climate and for ENSO. These trees
21
present visible growth bands of changing thickness along their circumference. However, several bands
22
are locally absent, and the growth axis is generally offset with respect to the geometrical axis of the
23
tree. This led us to compute so-called composite ring thickness profiles, accounting for the geometry
24
of growth bands on the whole surface of a tree disk. Our computational method involves 10 optical
25 Manuscript
density profiles measured along 10 equally spaced radii drawn from the bark toward the growth axis,
26
and 10 to 20 master rings, that can be easily identified on the whole disk. Growth bands visible on less
27
than 5 radii were discarded. Our method is similar to the cross-dating method used by
28
dendrochronologists, except that it is applied here to a single tree disk. Our samples consist of three
29
disks of Agathis lanceolata, one disk of A. ovata, and one disk of Araucaria columnaris. Multiple
30
regressions have been computed between composite profiles and climatic variables i.e. monthly and
31
yearly temperatures and rainfall amounts. The best correlation is found between the width of the ring
32
growing between July (n-1) and June (n) with the rainfalls of June (n), June (n-1) and June (n-2).
33
Monthly rainfalls allow to explain between 20% to 50% of the ring thickness variance, a result similar
34
to that obtained with other studies on Agathis of New Zealand. No temperature parameter appears in
35
the most stable regressions. 30 measurements of tree ring cellulose δ18O have been conducted on one
36
single disk selected for the strong climate-ring width correlation. While earlier studies have used δ18O
37
measurements to identify seasonal cycles in tropical woods and date the rings, our data suggest that
38
the direct use of δ18O is misleading due to false rings that do not correspond to a complete growth
39
year. When these false rings are identified from the disk analysis and discarded, a fair visual
40
correlation with the total rainfall during the growth season is obtained. This requires information that
41
cannot be found in single growth band thickness profiles, for example as obtained by coring. Thus,
42
Araucariacae of New Caledonia may present a valuable potential for dendroclimatology. However,
43
reconstructing a chronology of this region will require more extensive sampling and possibly an
44
account of additional species.
45 46
Keywords : dendrochronology; kauri; ENSO; δ18O; rainfall; New Caledonia
1. Introduction 48
49
New Caledonia is an island group in the SW Pacific (figure 1) that experience currently El 50
Niño-Southern Oscillation (ENSO) climatic events. During standard conditions, the surface 51
waters of the tropical Pacific ocean are warm (28°C-29°C) in the West and cold (22°-23°C) in 52
the East. The so-called warm water pool is related to increased evaporation and precipitation. 53
During El Niño events, this warm pool is displaced toward the East on the whole equatorial 54
band and the Western Pacific experiences dryer than usual conditions. During the opposite La 55
Niña situation, the warm pool and the associated heavy precipitation zone migrate farther to 56
the West (Philander, 1990). Since ENSO phenomena are dominated by time periods spanning 57
from 3 to 9 yrs, high resolution proxies are required for their study (Rodbell et al., 1999). 58
Continental sedimentary records in New Caledonia provided a 10-100 yrs time resolution 59
(Stevenson et al., 2001; Wirmann et al., 2006). High resolution paleoclimatic studies around 60
New Caledonia mainly rely on coral sampled near the Phare Amedee islet, located 20 km 61
seaward of Noumea, slightly landward of the barrier reef. Quinn et al. (1998) provided δ18O 62
records in Porites lutea since 1657 A.D. which they use to reconstruct past ocean water 63
temperatures. They show also that ocean temperatures measured during the 20th century are 64
fairly well correlated to ENSO. Watanabe et al. (2003) ) and Ourbak et al. (2006), working on 65
shorter time series, showed that δ18O in Diploastrea corals and that Sr/Ca and Mg/Ca in
66
Porites corals were temperature-dependent and thus could potentially provide pluricentennial 67
high resolution ocean temperature reconstructions. However, the main island of New 68
Caledonia is a large landmass of nearly 170.000 km2 including a continuous central mountain
69
range of an average 1000 m altitude. Its climate should therefore not only be controlled by the 70
ocean. 71
In the temperate climatic zone, and where one climate parameter is a limiting factor 72
for growth, tree rings are widely used to build annually resolved climate reconstructions (e.g. 73
Schweingruber, 1996). In addition, there is growing evidence that tropical trees may also 74
present growth bands related to climatic parameters (Ogden, 1978; Détienne, 1989; Jacoby 75
and D'Arrigo, 1990; Worbes, 1995; Bullock, 1997). It has been demonstrated that during a 76
long dry season the growth of tropical trees stops and that this induces the formation of annual 77
rings in Indonesia (Berlage, 1931), Thailand (Buckley et al., 1995) and in Costa Rica (Enquist 78
and Leffler, 2001). An extensive bibliography of tree ring research in the tropics can be found 79
in Worbes (2002). When annual rings cannot be visually identified, high resolution stable 80
isotopic measurements of wood cellulose may provide a new dating method using the 81
seasonal cycles of cellulose δ18O produced in response to the seasonal cycles of tropical
82
precipitation δ18O (Evans and Schrag, 2004; Poussard et al., 2004; Poussard and Schrag,
83
2005). In the North Island of New Zealand, 1000 km south of New Caledonia, chronologies 84
of Agathis australis, a long-lived rainforest tree, have been established by Buckley et al. 85
(2000). 86
Araucariacae of New Caledonia include 5 species of Agathis and 8 species of 87
Araucaria, all endemic, representing 45 % of the species of the family globally (Manauté et 88
al., 2003). Some of these species are growing on poor ultramafic-derived soils, in particular, 89
Agathis lanceolata, which is present as an emergent tree in the rainforest of the south of the 90
main island. Owing to its use as construction material during the 19th century A. lanceolata
91
almost disappeared from New Caledonian forests and as a result, it presently benefits from an 92
integral protection. A. ovata, another long-living tree endemic to New Caledonia, grows also 93
on ultramafic-derived soils, generally just below mountain passes. Individuals having a trunk 94
circumference of more than 2 m are common. Cherrier and Nasi (1992) have repeated 95
circumference measurements on 146 individuals of A. ovata and A. lanceolata over a 10 years 96
interval. They deduced a circumference growth of 0.2 to 0.5 cm/yr for A. lanceolata and 0.1 97
to 0.5 cm/yr for A. ovata. The maximum growth was obtained for samples having a diameter 98
between 60 and 150 cm while some small diameter individuals had almost zero growth. 99
Moreover, it is known that Agathis growing in ornamental plantations have larger growth 100
rates than in natural forests, since they are generally planted at a comfortable distance from 101
each other, and they benefit from a soil worked down to near 1 m depth and generally 102
enriched with fertilizer (Whitmore, 1980). The demography of A. ovata has also been studied 103
by Enright et al. (2003), who concluded that individuals having a 30 cm diameter at breast 104
height (dbh) could be as old as 700 yrs, and that a dbh of 100 cm could correspond to an age 105
of 1500 yrs. However, their samples consisted mainly of individuals of less than 5 cm dbh. 106
This could explain why the growth rate reported by Enright et al. is less than half the 107
minimum growth rate found by Cherrier and Nasi. 108
During the seventies, the New Caledonian Center of Tropical Trees Studies collected 109
several samples of A. lanceolata, which had been marked yearly for 7 years. Nasi and his 110
team (Nasi, 1982) have shown that these trees were producing generally one growth band per 111
year. Some samples, having a dbh of 50 cm, were estimated to be as old as 350 yrs. As some 112
Agathis living in New Caledonia are more than 5 m in diameter, this implies that the potential 113
of availability of climatic records is more than a millennium. However, seasons are less 114
marked in New Caledonia than in New Zealand and no relationship between climatic 115
variables and the thickness of growth bands of trees has been proved there. Moreover, Nasi 116
(1982) has shown that Agathis produced anomalous growth bands, that were only present on 117
part of the tree circumference. Such anomalous bands are common on tropical trees (Stahle, 118
1999). They have been attributed by Priya and Bhat (1998) to the occurrence of dry periods 119
during rainy seasons, inducing the formation of latewood, or to rainy events during the dry 120
seasons, that promote transient growth. According to the current practice of 121
dendrochronology, growth bands will be termed either as rings, when they are assumed to 122
correspond to a full growth year, or as false rings, if otherwise. In addition, kauris commonly 123
present off-centered growth axes, especially when they grow in windy areas or on steep 124
slopes. This could hinder correct interpretation of cores, which are usually drilled toward the 125
geometrical axis of the tree. 126
The present paper aims to assess the potential for climatic studies of Agathis 127
lanceolata including comparison with the related species of A. ovata, both of which are 128
endemic to New Caledonia and growing on ultramafic soils. These species are compared with 129
Araucaria columnaris, using a sample growing on soil derived from continental rocks. In 130
order to gather bidimensional information on growth bands structure, we use whole disks 131
sawn perpendicularly to the trunk at about 1 m height. We will first describe our samples, 132
then the method used to obtain the mean geometric characteristics of rings from a disk. 133
Following this, we discuss the statistical relationship between these geometric characteristics 134
and the climate of New Caledonia. Finally we present 30 δ18O measurements made on one of 135
our samples to provide some further clues on their relationship to climatic variables. 136 137 2. Material 138 139 2.1. Field Sampling 140 141
The results presented here arise mainly from 3 disks of A. lanceolata collected in 142
December, 1981 from three individuals growing inside the Rivière Bleue Provincial Park, 30 143
km north-east of Noumea at 220 m altitude (figure 1). These trees were growing on ultramafic 144
parent soils, that are low in nitrogen, phosphorus, potassium and calcium, but high in iron, 145
magnesium, nickel, chromium, cobalt and manganese (Jaffré, 1980). However, the ultramafic 146
rocks (peridotites) in this area contain several diorite inclusions. During alteration, diorite 147
may provide locally additional nutrients to soils. The sampling area is located only a few 148
meters above a swampy zone, connected to the Yaté artificial lake. Since its construction in 149
1950, the lake flooded the area upstream from the Yaté dam. Five A. lanceolata of this area 150
have been marked yearly between 1974 and 1981, at the beginning of each cold season, by 151
opening a 5 cm × 1 cm window across the bark to the cambium. The growth was locally 152
affected by the wounding because of the development of cicatricial tissues but as the 153
wounding is very small compared to the diameter of the trees, this did not impact the overall 154
tree growth rate. Following this, these 5 trees were sawn to provide disks for analysis. As 155
each individual presented generally one growth band between two marks, Nasi (1982) has 156
interpreted these growth bands as annual tree rings. Of these five disks, only three (L1, L2, 157
and L3) are now available. The samples L1, L2, and L3, have circumferences of 155 cm, 153 158
cm, and 165 cm, respectively. From detailed ring counting, Nasi (1982) estimated the ages of 159
L1, L2 and L3 to be 29, 215, and 350 yr, respectively. L1 was an isolated tree, while L2 and 160
L3 were located inside the forest. This and a possible difference in soil composition could 161
explain the higher growth rate of L1. It should be noted that in the upper Rivière Bleue zone, 162
several A. lanceolata escaped commercial exploitation during the 19th and 20th centuries and
163
are now more than 5 m in diameter. 164
In order to compare the growth of different species, our study includes a sample of A. 165
ovata (O1) of dbh 100 cm, growing at 440 m altitude on peridotites, just below the Col du 166
Cintre (figure 1). Since this tree, in contrast to the Agathis lanceolata individuals, was 167
growing in a well drained area, perhaps it is more sensitive to drought. Unfortunately, it was 168
partly rotten so that only the external 15 cm could be interpreted. Based on extrapolation of 169
the 150 rings counted within these 15 cm, the whole individual was assumed to contain 400 to 170
500 rings. 171
We included in our study an individual of Araucaria columnaris (C1) growing at 172
Noumea (figure 1) on soils derived from a parent rock consisting of alternating silt and clay 173
layers and thus richer in nutrients than ultramafic-derived soils. Our disk was 45 cm in 174
diameter and included about 50 rings. 175
Our limited sampling was insufficient to allow the reconstruction of a chronology 176
from New Caledonian Araucariacae. Nevertheless, this preliminary study aims to assess the 177
sensitivity to climate of ring thicknesses and the variability of this sensitivity. 178 179 180 2.2. Climatic data 181 182
New Caledonia is situated at the southern limit of the tropical zone and thus benefits 183
from a semi-tropical climate (figure 2). It is exposed to trade winds blowing from the 184
southeast 300 d/yr. Thus, southern New Caledonia, including Noumea, receives a lot of rain. 185
The climate is characterized by a dry season from September to November, followed by rainy 186
and hot season extending from December to March. The climate then cools progressively 187
until June, when the cold season sets in. The optimal growth period of New Caledonian trees 188
spans therefore from December to June. During the hot season, tropical depressions form 189
north of New Caledonia and induce rainy events during their southeastward trajectory. Winter 190
depressions originate from the Coral Sea, situated between New Caledonia and Australia. 191
They consist of cold fronts propagating westward to New Caledonia and are known as "coups 192
d'ouest". Temperature and rainfall data have been recorded in Noumea since 1862. However, 193
several data are missing up to 1899. The mean total annual rainfall is 1100 mm, but large 194
variability results from droughts during El Niño events, and from rainy periods during La 195
Niña events (Morliere and Rebert, 1986) so that extreme rainfall amounts are 500 mm and 196
2000 mm. Nicet and Delcroix (2000) and Manton et al. (2001) have shown in addition that 197
climatic data averaged over the whole New Caledonia were fairly well correlated with SOI, 198
but that this correlation was poor for some individual stations and some time periods. For 199
example, a severe drought was recorded in 1969 in the absence of a El Niño phase, and 1967 200
was very wet during a weak La Niña phase. The mean maximum monthly temperature is 201
32°C in Noumea during the month of January, while the minimum one is 17°C during July, 202
with a low mean daily amplitude of 6°C. The climatic records obtained from Noumea were 203
used in our study, as they are the oldest and the most complete records. However, shorter 204
records spanning a few years to a few decades are also available from various places of south 205
New Caledonia. They show that rainfall increases with altitude and from North to South of 206
the landmass with a monthly distribution similar to that of Noumea (Jaffré, 1980). For 207
example, the station of Montagne des Sources located a few km from our sampling site of 208
Agathis lanceolata (L1 to L3) and at a 780 m altitude recorded mean monthly maximal and 209
minimal temperatures of 25°C and 12°C, respectively, and a mean rainfall of 3000 mm. 210
The Southern Oscillation Index (SOI) is widely used to measure the strength of ENSO 211
events (Philander, 1990). This index is calculated from the pressure difference between Tahiti 212
in French Polynesia and Darwin in Australia. It is available for download at 213
http://ccsm.ucar.edu/cas/catalog/climind/soi.html. As the SOI is considered as a climatic 214
index in the south Pacific, it will be included in our climatic dataset. 215
216 217
2. Analysis of growth band distribution 218
219
2.1. Determination of mean ring thickness 220
Our 3 disks of Agathis lanceolata present off-centered structures with extreme radii of 222
22 and 26 cm, 21 and 24 cm, and 16 cm and 31 cm, for L1, L2, and L3, respectively. The 223
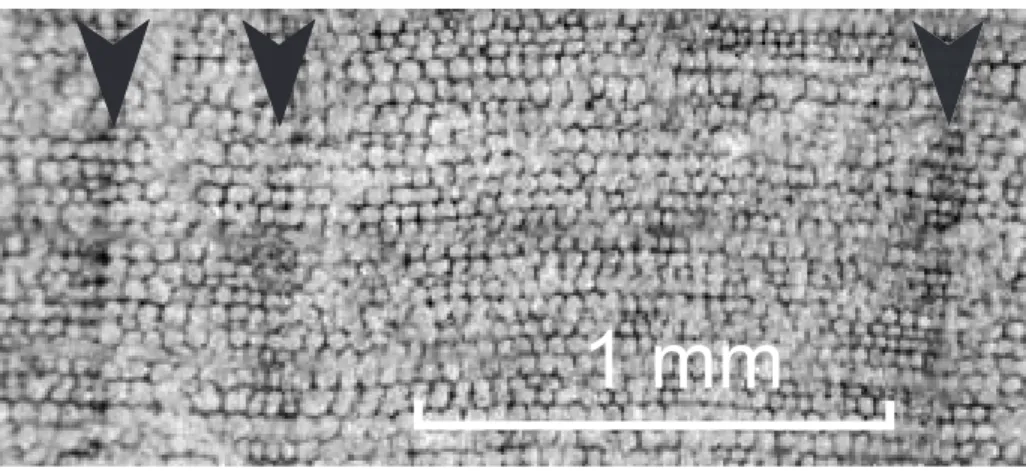
growth bands consist of pale-colored thin walled tracheid (i.e. cells of the xylem) that are 224
limited by dark-colored thick-walled tracheids (figure 3a). But, in contrast to temperate 225
climate conifers, the limits of growth bands is only a few tracheids wide and eventually is 226
discontinuous (figure 3a). Moreover, several growth bands are difficult to detect on the whole 227
circumference due to the fading of their dark limit (figure 3b), or due to wedging of rings 228
(figure 3c). Thus, the band thickness distribution depends on the radius under consideration. 229
This is demonstrated, for example, on the long radius (figure 4b) and the short radius (figure 230
4d) of our sample L3. Starting from the bark and stopping at the same ring boundary at about 231
5 cm from the growth center, we have counted 256 and 356 growth bands along these two 232
radii. 233
In order to use the information present on the whole disk, we have computed the total 234
integrated ring thickness, starting from a digitized image of the disk. First attempts to detect 235
automatically the band limits were unsuccessful due to the following reasons: (i) the optical 236
density and thickness of a given band change along its circumference, (ii) the non constant 237
number of bands along different radii, (iii) the presence of radial structures having an optical 238
density similar to that of band limits (see figure3). However, for our L1 and C1 samples, 239
growth bands were wide enough to be traced directly on a paper on which automatic detection 240
of their limits was worked out. Due to a mean band thickness below 1 mm, and due to the 241
large number of bands, this method could not be applied for our other samples. Our composite 242
method relies on information from 10 equally spaced radii of a disk and from 15-20 master 243
rings visible along the whole circumference. Master rings are commonly used in 244
dendrochronology for cross-dating several tree samples. Usually, they represent years of 245
growth that can be easily identified from several trees from a given area (Schweingruber, 246
1996). In this study, master rings have been used for cross-dating the 10 radii of a single disk. 247
Master rings were first drawn manually on the digitized disk image using the magnetic pen 248
tool of Adobe Photoshop software and were assigned a thickness that makes them easier to 249
detect. The band limits were then numerically detected within 50 pixels wide strips around the 250
10 radii, using the following iterative method: the sum of the optical densities along a series 251
of directions within less than ten degrees from the previous band limit is computed over the 252
50 pixel wide strip. The next band boundary is defined by the direction of maximum 253
cumulated optical density. This direction is then used as the central direction for computing 254
the next band boundary. The first band boundary is assumed to be perpendicular to the radius. 255
This produces a mean optical density profile where band boundaries appear as maxima and 256
the master rings are absolutely black. The detection of band boundaries involves manual 257
adjustment of some parameters for each radius (e.g. mean optical density, width and optical 258
density range for detection of a band limit). Finally, it yields a band limit detection equivalent 259
to manual measurements. 260
The last step consists of integrating the information of the 10 individual radii to 261
compute a mean ring thickness profile. A simple average of the 10 individual profiles will 262
result in a poor signal-to-noise ratio on the mean profile since growth bands from the same 263
time period do not correspond on the different profiles, due to the presence of false rings. 264
Things are not significantly improved if the time scale of each profile is deformed to allow 265
correspondence of the master rings: the different profiles can be averaged only on a narrow 266
zone around each master ring, as long as no incomplete ring is observed. This led us to 267
identify incomplete rings and to introduce a zero thickness band when they are not present on 268
a given profile. Starting from the longest radius, such a zero thickness growth band is inserted 269
in the next profiles at each place where a band disappears. It is assumed that the thinnest 270
bands are the most likely to disappear. Then growth bands present on less than 5 radii are 271
considered as false rings, and the thicknesses of true rings are averaged to produce the mean 272
profile. This arbitrary limit of 5 radii produces a composite profile with the same number of 273
rings as that of the longest radius. This implies that the number of false rings on this radius is 274
equal to the number of rings which cannot be detected on it, although they are considered as 275
true annual rings, since they are present on more than 5 other radii. The threshold of 5 radii 276
complies with the result obtained by Nasi (1982) from annual marking of 12 different trees 277
during seven successive years. Moreover, this value maximizes the correlation with climatic 278
data (see below). However, since it is established on a statistical basis, our composite profile 279
may include some false rings, while some true rings are lacking. Figure 4 represents the ring 280
thicknesses obtained for L3 along the long radius, the short radius, and the composite profile. 281
They are compared with climatic data recorded in Noumea and with the SOI. In the next 282
sections, we apply signal analysis methods to assess the climatic information included in these 283
composite profiles. 284
285
2.2. Spectral density analysis 286
287
Some of our profiles seem to present periodicities, which led us to a preliminary 288
frequency analysis. Since spectral analysis is not the main topic of the paper, a simple and 289
robust method is adopted here. As the Fourier transform of the signal is known to produce 290
noisy spectra, the Fourier transform of the autocorrelation function is used here instead (Press 291
et al., 1992). Taking the autocorrelation enhances periodic components of the signal. 292
Moreover, the larger lag components of the autocorrelation function, which are those who 293
introduce noise in the spectrum, are discarded with windowing techniques. This method is 294
easy to implement, robust (Oppenheim and Shafer, 1974) and may be applied for various 295
length data such as our three ring thickness profiles. The composite profile of L3 presents 296
only one noticeable period at 22 yrs, while the short radius does not present any clear 297
periodicity and the long one exhibits only one peak at 6.6 yrs. Our sample L2 did not produce 298
any marked periodicity, while O1 presents marked periods at 28, 17 and 8 yrs. For the 299
climatic variables, rainfall data present a smooth peak at 20 yr and a large spectral content for 300
periods longer than 4 yrs without any clear additional peak, while temperature presents two 301
marked peaks at 21 and 2.3 yrs. These results confirm the visual impression that our samples 302
present marked periodicities. The 20-22 yrs period is present in L3, in the temperature and in 303
rainfall data. This could indicate that a common process having a near 20 yr period is present 304
in our observations and that it has been undersampled in O1, probably because several annual 305
rings are absent on this profile. This period is also present in the Interdecadal Pacific 306
Oscillation which has been shown to modulate ENSO (Folland et al., 1999; Salinger et al., 307
2001). As a whole, the tree growth spectra present little power near the frequencies commonly 308
associated to ENSO, while temperature and rain present power near 2.3 yr and 4 yr, i.e. close 309
to 3.2 yr, which Quinn et al. 1998 found the most reliable period in SOI. This could result 310
from the large noise introduced up to a few years period by the imperfect false ring 311
identification. Besides, data sampled at near a one year time interval such as tree rings are not 312
perfect for the definition a signal at a few years period. The spectral approach deserves further 313
exploration using more sophisticated methods when a larger sample set becomes available. It 314
could help to select the individuals presenting the best correlation with climate. 315
316
2.3. Correlation analysis 317
318
Figure 5 represents the ring thicknesses recorded in the profiles of all our samples and 319
the climatic variables of figure 4. The relationship between tree ring thickness and climatic 320
variables is not obvious. This leads us to a statistical analysis of the correlation between tree 321
rings and climate. We used monthly temperatures and rainfalls as well as cumulated rainfall 322
on various time periods, i.e. during the wet season, the dry season and the growth season, that 323
is assumed to extend from July until June of the following year. Annual temperatures and 324
rainfall as well as the SOI have also been considered. 325
The method used is multiple regression of the Statistical Analysis Software (SAS 326
Institute, 2004). At each step, this method extracts the variable corresponding to the largest 327
explained variance, using partial least squares. This variable is added to the regression if it 328
corresponds to a Pvalue of the Fisher test of less than 5%. When a variable is added to the 329
regression, all the previous variables are considered again, and those corresponding to a 330
Pvalue less than 5% are ruled out. This method is well suited for highly correlated variables, 331
such as our climatic data (Radhakrishna and Rao, 1967; Wang and Chow, 1994). In order to 332
include non linear combinations of climatic variables, tests were also performed with their 333
logarithms, since adding logarithms results in the logarithm of the product of the variables, 334
but these tests did not allow the extraction of any significant variable. 335
The correlation results are summarized in table 1. Monthly rainfalls are denoted by P, 336
followed by the name of the month and the number of the year. so that PJune(n) is the rainfall 337
of the month of June of the growth season. Correlations have also been computed for different 338
radii numbers on which a growth band should be present to be considered as a true ring. This 339
resulted in a broad maximum for 5 radii. Therefore this value has be adopted to build the 340
composite profiles. The first observation is that temperature does not appear in this table. This 341
does not mean that temperature does not influence growth, since rainfall and temperature are 342
correlated. In fact, generally negative yet significant correlations appear with monthly 343
temperatures if rainfalls are discarded from our analysis. Such correlations have also been 344
found by Buckley et al. (2000) for kauris of Northern New Zealand. However, these 345
correlations vary largely between our individuals, even if they belong to the same species. 346
The second observation is that only low total or partial explained variance can be 347
obtained. Thus, our data have also been run with the DENDROCLIM software, which is 348
devoted to cross correlation analysis of tree rings and has been benchmarked by Biondi and 349
Waikul (2004). When using our sample L3, for which the best correlations with climate have 350
been found by SAS (see table 1), the only significant correlations given by DENDROCLIM 351
are those with the rainfall of June of the year preceding growth, and with the rainfall of June 352
of the year before, with correlations of 0.37 and 0.24. Since the correlation coefficients are the 353
square root of the explained variances, the corresponding explained variances are 0.14 and 354
0.06, respectively, which are exactly those found by SAS. The reduced number of significant 355
climatic variables found by DENDROCLIM may result from the computation of the error in 356
the correlation, based on the bootstrap method, while SAS uses the results of least squares. 357
Our correlation coefficients are similar to those found by Buckley et al. (2000) with the kauris 358
of New Zealand. We prefer however, to further use the explained variances (R2) of table 1 359
since they are additive and provide the total explained variance. Table 1 also shows that the 360
R2 coefficients vary according to the individual sampled, even for the 3 A. lanceolata 361
individuals, that were located within an area of 100 m radius. Our samples L2 and L3, 362
although presenting similar growth rates, do not exhibit the same correlations with climate. 363
Based on our correlation analysis, the sample L3, only, will be suitable for building future 364
chronologies of New Caledonia. 365
However, it is noteworthy to notice that all our samples present a statistically 366
significant correlation with the rainfall of the month of June of the growing season, of the 367
previous season, or with that of the year before. We have verified that this correlation relied 368
only on external rings. This is an indication that no systematic over-or-undersampling is 369
introduced in our ring counting process. The correlation with PJune (n-1) and PJune(n-2) may 370
be due to the accumulation of nutrients in the root of the tree, which are used during the 371
coming growing seasons extending from July to June of the following years. Accumulation in 372
the root system of carbohydrates which are further used during a growth season is common 373
for trees (see for example Jacoby and D'Arrigo, 1990). The correlation with PJune(n-1) and 374
PJune(n-2) observed for our sample L3 may be an indication either that for a poor soil and a 375
very thin organic cover, accumulation of nutriments inside the root system may be needed for 376
more than one year before growth, or that one true ring has been misinterpreted as a false ring 377
in the external part of this sample so that all inner rings are shifted one year in the past. On the 378
other hand, higher rainfall during June(n) may extend the duration of the growth season, 379
which could explain the positive correlation with PJune(n). The presence of Pjuly in two of 380
the regressions could reinforce these hypotheses. 381
For our sample L3, presenting the best correlations with climate, it appears that these 382
correlations are only obtained with the composite profile while the individual profiles present 383
much lower correlations. As a consequence, our results can not be applied to data obtained by 384
coring. As the individual radii of L3, however, present correlation with climate similar to 385
those obtained with the single profile of O1, we suspect that a whole disk of A. ovata could 386
provide a valuable climatic proxy. 387
388
3. δδδδ18O profiling 389
390
Isotopic composition of the tree cellulose is known to provide information on the 391
annual rainfall of temperate climates (Raffali-Delerce et al., 2004). Poussard et al. (2004) 392
have recently shown that δ13C and δ18O measured in cellulose of some tropical species were
393
also linked to climate. Recall that δ18O measurements are defined as the relative difference
394
between the 18O/16O ratio of the sample and that of the SMOW standard. We have measured 395
δ18O of the α-cellulose of the 30 external growth bands of the longest radius of L3. One of the
widest of these 30 bands has been divided into four parts to check the variability of the 397
oxygen isotopic composition inside a single band. A strip 2 cm wide and 0.5 cm thick has 398
been sawn along this long radius and each ring cut out, then grinded and mixed. The α-399
cellulose from two samples of 0.25 mg of each of these bands has been extracted following 400
the method discussed in Green (1963) and Leavitt and Danzer (1993) and analyzed for δ18O.
401
The precision of the measurements has been estimated to 0.25‰, which is the standard 402
deviation of repeated measurements of Raffali-Delerce et al. (2004). Thus, values from the 403
two samples were averaged if these values differed by less than 0.25‰, and if not, they were 404
discarded. Given the insufficient length of our sampling, the SAS regression procedure could 405
not be used, since it involves monthly and annual rainfall and temperature of the growth year 406
and of the two precedent years, i.e. 78 climatic data. Thus, its is likely that a reasonable fit of 407
our 30 δ18O measurements could have been found, even if they were perfectly random.
408
Our measurements have been, therefore, directly compared with the total rainfall of 409
the growing season (figure 6), which has been shown to be proportional to δ18O in both
410
temperate (Raffali et al., 2004) and tropical climates (Poussard et al., 2004; Poussard and 411
Schrag 2005). The scale δ18O scale in figure 6 has been reversed to emphasize the
412
anticorrelation with rainfall. If each ring of our radius is assumed to correspond to a growth 413
year, the correlation between δ18O and the annual rainfall is weak (figure 6), except for the
414
last 7 growth bands, for which the annual marks of Nasi (1982) demonstrate that one growth 415
band was produced per year. This led us to use the composite profile of L3 obtained in the 416
previous section to identify the false rings and possible missing rings within our sampled strip 417
of L3. Several false rings, including 2 sets of successive 3 false rings were identified within 418
these 30 sampled bands. They are marked in bold on figure 6. It is also notable that the two 419
samples presenting larger than 0.25‰ discrepancy between their two δ18O measurements also
420
corresponded to false rings (dotted bold segments in figure 6). When measurements 421
corresponding to false rings are discarded, the δ18O profile is visually similar to that of the
422
annual rainfall. We have verified that this profile was only slightly changed if measurements 423
from the false rings were averaged with that of the following or of the previous true ring. 424
However, the visual relationship between δ18O and rainfall only produces of a low correlation
425
of -0.18. Careful examination of both curves show that, although similar in shape, they 426
usually present an offset of 1 yr , and that the correlation seems to be inversed between 1965 427
and 1968. This suggests that either small random time offsets persist in our composite profile 428
or that the δ18O signature of a ring does not depend only on the rainfall during its growth year,
429
a result also indicated by the correlation of ring thickness with the years preceding the growth 430
year. Thus, our results could be improved by a better identification of the rings and a better 431
knowledge of the conditions capable of inducing the formation of multiple growth bands 432
during a single growth year. 433
Moreover, δ18
O may be not only correlated with annual rainfall but also with the 434
geographical origin of rainy events. Further discussion on the origin of δ18O signature of tree
435
rings would require δ18O data for rain, surface waters and groundwaters of New Caledonia,
436
which are for the moment not available. On the other hand, the multi-sampling of the widest 437
growth band of our strip did not indicate any relation with climatic details inside its growth 438
year, in contrast with the results of Poussard and Schrag (2005). It is concluded from our 439
results that more extensive δ18O sampling is needed in New Caledonia.
440 441
4. Summary and conclusion 442
443
Growth bands can easily be observed in New Caledonia Araucariacae. However it is 444
known that kauris may produce several bands during a single year (Boswijk et al., 2006). 445
These bands are generally present only on a part of the trunk circumference and should not be 446
considered for reconstructing a chronology. Similarly, a true annual ring may also be present 447
only on a part of the circumference. Moreover, as the growth axis of these trees is generally 448
off-centered, ring profiles obtained by coring without a previous knowledge of the growth 449
axis may be difficult to interpret as opposed to full disks sawn perpendicularly to the trunk. 450
Our 5 tree samples were gathered in the South New Caledonia, a region subjected to 451
ENSO events and characterized by poor ultramafic-derived soils. Three of them are older than 452
200 yrs. We have computed composite ring thickness profiles, integrating information from a 453
full disk, starting from automatic identification of growth band limits along 10 equally spaced 454
radii and manual drawing of 10 to 20 master rings on the whole circumference of the disk. We 455
assumed that bands present on less than half a complete circumference should be discarded. 456
This criterion complies with observations of bands produced between annual marks during the 457
seven year experiment of Nasi (1982) and also produces the best correlation between 458
composite ring profiles and climate. However, as this criterion is only valid on a statistical 459
basis, it may lead to some wrong identifications of true rings and false rings. Moreover, 460
information regarding the maximum optical density of latewood is not retained in the 461
composite profile. 462
Our study includes 10 individual profiles from 4 disks plus one radius from the fifth 463
disk, giving a total of 41 profiles, which is much lower than those used by Buckley et al. 464
(2000) to build their chronology of Northern New Zealand on kauris. Consequently, the 465
present study should only be considered as an assessment of the potential of New Caledonian 466
Araucariacae for future dendrochronology studies. 467
Climatic data of New Caledonia only explain a low part of the variance of our ring 468
profiles. Significant (i.e. Pvalue <5% in Fisher test) correlation is found with monthly 469
temperatures but the annual rainfall only appears after the multiple regression process. This 470
does not mean that the growth of our species does not depend on temperature, but that the 471
regression with the annual rainfall is more stable. This implies that information related to 472
rainfall rather than to temperature is likely to be obtained from tree ring studies in New 473
Caledonia. For our samples, interannual variability of monthly rainfall amounts allows 474
explanation of between 20% and 50% of the ring thickness variability, and less than 37% if 475
the sample is older than 100 yrs. It should be emphasized that the correlation coefficients 476
(square root of explained variance) with monthly rainfalls are similar to those obtained by 477
Buckley et al. (2000) for kauris of New Zealand. 478
A correlation with the rainfall of June (n) (i.e. following growth) or June (n-1) 479
(preceding growth) arises in almost all our samples, whatever the species, the location, 480
altitude or the soil of the sampling site. This month marks the onset of the cool season lasting 481
until September, followed by the dry season until December. Therefore, it may be considered 482
that the month of June marks the beginning of the slow growth season and that a high rainfall 483
during June may increase the duration of this growth or allow accumulation of nutrients for 484
later use. 485
30 measurements of tree ring cellulose δ18O have been conducted on one single disk
486
selected for its better climate-ring width correlation. While earlier studies have used δ18O
487
measurements to identify seasonal cycles in tropical woods and date the rings, our data 488
suggest that the direct use of δ18O is misleading due to false rings that do not correspond to a
489
complete growth year. When these false rings are identified from the disk analysis and 490
discarded, data from the external part of our sample L3 present a general pattern 491
anticorrelated with that of annual rainfall during the growth season (July(n-1) to June(n)). 492
However, a slight random offset of 1 yr between δ18O and annual rainfall and a 4 yr period
493
where the correlation is reversed yielded a correlation of only -0.18. We note that false rings 494
could not have been discarded without our composite profile, relying on the information of 495
the whole disk. Additional δ18O data on Araucariacae of New Caledonia are needed to assess
more precisely their relationship with the climate. Poussard et al. (2004) and Poussard and 497
Schrag (2005) have shown that dense sampling inside rings allows detection of the variation 498
of the climate inside a single year. This deserves a systematic study in New Caledonia to 499
assess the ability of this method to detect false rings. 500
Our results rely on a reduced sampling. They have to be confirmed by more data on 501
tree rings in New Caledonia. Moreover due to the low correlation found with climate, a large 502
number of samples and/or careful sample selection will be required to build a chronology. As 503
individuals of A. lanceolata larger than a few meters in diameter are known in New 504
Caledonia, accumulating tree ring data may lead to a chronology on a time period of 500-505 1000 yr. 506 507 Aknowledgments 508 509
Isotope analyses have been partly funded by the French CNRS/INSU ECLIPSE 510
program. The staff of the Riviére Bleue Reserve and Parc Forestier of Noumea are warmly 511
acknowledged for their help in collecting samples, and likely Meteo France for providing 512
access to their climatic database. Discussion with J. Tassin (CIRAD Forest), J.P. Ricci (DRN 513
Noumea) as well as V.D. Dang were fruitful at the onset of this project. This work benefited 514
from the help from Jocelyne Bonneau for ring counting and samplingn, from Gregory Lasne 515
for photography and from Alain Courtot for woodwork. Comments from one associate editor 516
and from two reviewers helped to improve the manuscript. 517
518
References 519
520
Atlas climatique de la Nouvelle Calédonie, 1995, Météo-France, Noumea, 103p. 521
Berlage, H.P., 1931. Over het verband tusschen de dikte der jaarringen van djatiboomen 522
(Tectona grandis L. f.) en den regenval op Java. Tectona, 24, 939-953. 523
Biondi, F., Waikul, K., 2004. DENDROCLIM2002: A C++ program for statistical calibration 524
of climate signal in tree-ring chronologies. Comp. and Geosci., 30, 303-311. 525
Boswijk, G., Fowler, A., Lorrey, A., Palmer, J., Ogden, J., 2006. Extension of the New 526
Zealand kauri (Agathis australis) chronology to 1724 AC. The Holocene, 16, 188-189. 527
Buckley, B.M., Barbetti, M., Watanasak, M., D'Arrigo, R., Boonchirdchoo, S., Sarutanon, S., 528
1995. Dendrochronological investigation in Thailand. Int. Assoc. Wood Anatomists J., 16, 529
393-409. 530
Buckley, B., Ogden, J., Palmer, J., Fowler, A., Salinger, J., 2000. Dendroclimatic 531
interpretation of tree-rings in Agathis australis (kauri). 1. Climate correlation functions 532
and master chronology. J. R. Soc. New Zealand, 20, 263-275. 533
Bullock, S.H., 1997. Effects of seasonal rainfall on radial growth in two tropical tree species. 534
Int. J. of Biometeorology, 41, 13-16. 535
Cherrier, J.F., and Nasi, R. 1992. Placettes de suivi de croissance en forêt naturelle de 536
Nouvelle Calédonie. Report CIRAD-CTFR, Noumea. 537
Détienne, P., 1989. Appearance and periodicity of growth rings in some tropical woods. Int. 538
Assoc. Wood Anatomists Bull., 10, 123-132. 539
Enquist, J.B., Leffler, A.J., 2001. Long-term tree ring chronologies from sympatric tropical 540
dry-forest trees: individual response to climatic variations. J. Tropic. Ecol., 17, 41-60. 541
Enright, N.J., Miller, B.P., Perry, G.L.W., 2003. Demography of the long-lived conifer 542
Agathis ovata in maquis and rainforest, New Caledonia. J. Veg. Sci., 14, 625-636. 543
Evans, M.N., Schrag, D., 2004. A stable isotope-based approach to tropical 544
dendroclimatology. Geochim. Cosmochim. Acta, 68, 3295-3305. 545
Folland, C.K., Parker, D.E., Colman, A.W., Washington, R., 1999. Large scale modes of 546
ocean surface temperature since the late nineteenth century. In: Beyond El Niño: decadal 547
and interdecadal variability, Navarra, A. (Ed.), Springer, Berlin, pp. 73-102. 548
Green, J.W., 1963. Wood cellulose. In: Method of Carbohydrate Chemistry, III, R.L. Whisper 549
(Eds), Academic Press, New York, pp. 9-20. 550
Jacoby, G.C., 1989. Overview of tree-ring analysis in tropical regions. Int. Assoc. Wood 551
Anatomists Bull., 10, 99-108. 552
Jacoby, G.C., D'Arrigo, R., 1990. Teak (Tectona Gandis L.F.), a tropical species of large-553
scale dendroclimatic potential. Dendrochronologia, 8, 83-98. 554
Jaffré, T., 1980. Etude écologique du peuplement végétal des sols dérivés des roches 555
ultrabasiques en Nouvelle Calédonie, Travaux et documents de l’ORSTOM No 124, 556
ORSTOM, Paris. 557
Leavitt, S.W., Danzer, S.R., 1993. Method for batch processing small wood samples to 558
holocellulose for stable carbon isotope analysis. Ann. Chem., 65, 87-89. 559
Manauté, J., Jaffré, T., Veillon, J.M., Kranitz, M.L., 2003. Revue des araucariaceae de 560
Nouvelle Calédonie. IRD/Province Sud of New Caledonia, Noumea, New Caledonia. 561
Manton, M.J., Della-Marta, P.M., Haylock, M.R., Hennesy, K.J., Nicholls, N., Chambers, 562
L.E., Collins, D.A., Daw, G., Finet, A., Gunawan, K., Inape, H., Isobe, T.S., Kestin, T.S., 563
Lefale, P., Leyu, C.H. Lwin, T., Maitrepierre, N., Ouprasitwong, N., Page, C.M., Pahalad, 564
J., Plummer, N., Salinger, M.J., Suppiah, R., Tran, V.L., Trewin, B., Tibig, I., Yee, D., 565
2001. Trends in extreme daily rainfall and temperature in Southeast Asia and the South 566
Pacific: 1961-1998. Int. J. Climatol., 21, 269-284. 567
Morliere, A., Rebert, J. P., 1986. Rainfall shortage and El Niño-Southern Oscillation in New 568
Caledonia, Southwertern Pacific. Mon. Wea. Rev., 114, 1131-1137. 569
Nasi R., 1982. Essai pour une meilleure connaissance et une meilleure compréhension des 570
araucariacées dans la végétation calédonienne. Mémoire d'Ingénieur, GERDAT-CTFT, 571
Nogent sur Marne, France. 572
Nicet, B., Delcroix, T., 2000. ENSO-related precipitation changes in New Caledonia, 573
Southwestern tropical Pacific: 1969-98. Mon. Wea. Rev., 128, 3001-3006. 574
Ogden, J., 1978. On the dendrochronological potential of Australian trees. Aust. J. Ecol., 3, 575
339-356. 576
Oppenheim, A.V., Schafer, R.W., 1974. Digital signal processing. Prentice Hall, Englewood 577
Cliffs, N.J., USA. 578
Ourbak, T., Correge, T., Malaize, B., Le Cornec F., Charlier K., Peypoupet, J. P., 2006. A 579
high-resolution investigation of temperature, salinity, and upwelling activity proxies in 580
corals. Geochem. Geophys. Geosyst., 7, Q03013, doi:10.1029/2005GC001064. 581
Philander, S.G.H., 1990. El Niño, La Niña and the Southern Oscillation. Academic Press, San 582
Diego, CA. 583
Poussard, P.F., Evans, M.N., Schrag, D.P., 2004. Resolving seasonality in tropical trees: 584
multi-decade high resolution oxygen and carbon isotope record from Indonesia and 585
Thailand. Earth Planet. Sci. Lett. 218, 301-316. 586
Poussard P.F., Schrag, D.P., 2005. Seasonally stable isotope chronologies from northern 587
Thailand decideous trees. Earth. Planet. Sci. Lett., 235, 752-765. 588
Press, W.H., Teukolsky, S.A., Vetterling, W.T., Flannery, B.P., 1992. Numerical recipes in 589
Fortran. The Art of Scientific Computing, 2nd ed. Cambridge University Press, New 590
York, NY, USA. 591
Priya, P.B., Bhat, K.M., 1998. False ring formation in teak (Tectona grandis L.f.) and the 592
influence of environmental factors. Forest Ecol. Manag., 108, 215-222. 593
Quinn, W.H., Crowley, T.J., Taylor F.W., Hénin, C., Joannot P., Join, Y., 1998. A multi-594
century stable isotope record from a New Caledonia Coral : Interannual and decadal sea 595
surface temperature variability in the souhtwest Pacific since 1657 AD. 596
Paleoceanography, 13, 412-426. 597
Radhakrishna, C., Rao, J., 1967. Linear statistical inference and its application. John Wiley 598
and Sons, New York. 599
Raffalli-Delerce G., Masson-Delmotte V., Dupouey J.L., Stievenard M., Breda N., Moisselin 600
J.M. 2004. Reconstruction of summer droughts using tree-ring cellulose isotopes: a 601
calibration study with living oaks from Brittany (western France). Tellus, 56-2, 160-174. 602
Rodbell, D. T., Seltzer G. O., Anderson, D. M., Abbott, M. B., Enfield, D. B., Newmann, J. 603
H., 1999. An~15,000-year record of El Niño-driven alluviation in southwestern Ecuador. 604
Science, 4401, 516-520. 605
Salinger, M.J., Renwik, J.A., Mullan, A.B., 2001. Interdecadal Pacific Oscillation and South 606
Pacific climate. Int. J. Climatol., 21, 1705-1721. 607
SAS Institute, 2004. SAS/STAT 9.1 user's guide, SAS Institute Inc., Cary, NC. 608
Schweingruber, F.H., 1996. Tree rings and Environment Dendroecology. Haupt, Vienna. 609
Stahle, D., 1999. Useful strategies for the development of tropical tree-ring chronologies. Int. 610
Assoc. Wood Anatomists J., 20, 249-253. 611
Stevenson, J., Dodson, J.R., Prosser, L.P., 2001. A late Quaternary record of environmental 612
change and human impact from New Caledonia. Paleogeog. Paleoclimatol. Paleoecol., 613
168, 97-123. 614
Wang, S.G., Chow, S.C., 1994. Advanced linear models : theory and applications. Marcel 615
Dekker, New York, pp. 146-223. 616
Watanabe, T., Gagan, M.K., Correge, T., Scott-Gagan, H., Cowley, J., Hantoro, W.S., 2003. 617
Oxygen isotope systematic in Diploastrea-heliopora : new coral archive of tropical 618
paleoclimate. Geochim. Cosmochim. Acta, 67, 1349-1358. 619
Whitmore T.C., 1980. A monograph on Agathis. Plants Systematics and Evolution, 135, 41-620
69. 621
Wirrmann, D., Semah, A.M., Chacornac-Rault, M. 2006. Late Holocene paleoenvironment in 622
northern New Caledonia, Southwestern Pacific, from a muliproxy analysis of lake 623
sediments. Quat. Res., 66, 213-232. 624
Worbes, M., 1995. How to measure growth dynamics in tropical trees: a review. Int. Assoc. 625
Wood Anatomists J., 16, 337-351. 626
Worbes, M., 2002. One hundred years of tree-ring research in the tropics - a brief history and 627
an outlook to future challenges. Dendrochronologia 20, 217-231. 628
Figure captions 630
631
Figure 1. Location of the sampling area, and of New Caledonia in the southwest Pacific 632
(inlet). Each sampling area is labeled by its sample reference. L1-L3 correspond to the three 633
A. lanceolata, O1 to the A. ovata, and C1 to the Araucaria columnaris. The greyed area 634
figures the extent of the southern ultramafic massif. 635
636
Figure 2. Mean climate of Noumea (1888-2004). The bar chart shows the annual rainfall and 637
the curve shows the mean monthly temperature. 638
639
Figure 3. Ring structure of A. lanceolata. a) The limits of growth bands (vertical arrows) 640
consists of a thin and discontinuous series of thick-walled dark-colored tracheids. b) Fading of 641
a ring limit (horizontal arrow) from right to left. This ring limit cannot be detected at the left 642
end of the picture. c) a series of wedging rings (horizontal arrow), where decreasing width 643
rings merge together (from right to left). Radial structures perpendicular to rings with the 644
same optical density as ring limits may be observed on these three pictures. 645
646
Figure 4. Comparison of the climatic data with the different ring thickness profiles from L3. 647
a): Climatic data: annual rainfall during the growth season, i.e. July to June (solid bars), and 648
mean annual temperature (solid line), both recorded in Noumea. The SOI index, averaged on 649
a 1 yr moving window, is represented with a dashed line (arbitrary unit). Growth band 650
thicknesses (arbitrary units) of our L3 sample along the longest radius (b), the composite 651
profile, averaged on the whole disk (c) and the short radius (d). 652
Figure 5. Comparison of thickness profiles recorded with our different samples (arbitrary 654
vertical units, vertical scale at the right). The annual temperature and rainfall of figure 1 are 655
also indicated at the top of the figure. Note that O1 corresponds to a single profile while the 656
other samples correspond to synthetic profiles averaged over the whole disk. For L3 and L2, 657
the 100 last years, only are displayed, since for older rings no correlation with climatic data is 658
possible. 659
660
Figure 6. Comparison between δ18O measured in L3 with the annual rainfall during a growth
661
year (July of a given year until June of the following year). Top: rainfall; bottom: δ18O data.
662
In order the emphasize the anticorrelation with annual rainfall, the δ18O axis has been
663
reversed. The black curve, including dotted and thick parts represents raw data. Data from 664
false rings are indicated in bold. False rings where two measurement resulted in a δ18O
665
discrepancy of more than 0.25‰ (see text) correspond to the dotted segments. In the red 666
curve, false ring data have been discarded. Both δ18O curve are identical in the external part
667
of L3, where the annual marks indicate that there is no false rings. 668
Correlation between tree ring thickness and monthly rainfalls
Variable Explained variance
(R2) Cumulated explained variance Pvalue ARAUCARIA COLUMNARIS (C1) Pjune (n) 0.18 0.18 0.0125 Pjune (n-1) 0.14 0.32 0.0161 Pmay (n) 0.08 0.41 0.036 Papril (n-1) 0.09 0.5 0.0425 AGATHIS LANCEOLATA (L1) Pdecember (n-1) 0.216 0.216 0.0192 AGATHIS LANCEOLATA (L2) Pjune (n) 0.05 0.05 0.0133 Papril (n-2) 0.05 0.10 0.0147 Pjuly (n-2) 0.06 0.16 0.0167 Pmay (n-2) 0.04 0.20 0.0328 Pjune (n-1) 0.04 0.24 0.0471 Pjuly (n-1) 0.04 0.28 0.0471 AGATHIS LANCEOLATA (L3) Pjune (n-1) 0.14 0.14 0.0001 Pjune (n-2) 0.06 0.20 0.0109 Pdecember (n-1) 0.05 0.25 0.0147 N. dry months (n) 0.05 0.30 0.0196 Pjanuary (n-1) 0.04 0.34 0.0337 Pdecember (n-2) 0.03 0.37 0.0347
AGATHIS OVATA (O1)
Pdecember (n-2) 0.06 0.06 0.0110 Pjuly (n) 0.05 0.11 0.0264 Pjune (n-1) 0.05 0.16 0.0366 Pjune (n) 0.05 0.21 0.0379
Table 1
Table 1Yaté
22 S
167 E
Nouméa
L1, L2, L3
O1
C1
Yaté Lake
150°E 160°E 170°E30°S 20°S 10°S AUSTRALIA NEW CALEDONIA
0
100 km
Figure 1 Liebeau et al.
Figure 1Figure 2 Lieubeau et al.
Jan Feb Mar Apr May Jun July Aug Sep Oct Nov Dec 0 40 80 120 160 Annual rainfall (mm) 20 22 24 26 28 Mean temperature (°C) Figure 21 mm
1 cm
1 cm
a)
b)
c)
Figure 3 Lieubeau et al.
Figure 31880 1900 1920 1940 1960 1980 L 3 composite L 3 s h o rt radius L 3 l o n g radius 0 500 1000 1500 2000 2500 P lu v io me tr y (mm/ yr) 21.5 22 22.5 23 23.5 24 24.5 Te m p e ra tu re (° C )
Figure 4 Lieubeau et al.
a)
b)
c)
d)
r
0
500 1000 1500 2000 2500
Annual rainfall (mm/yr)
22 23 24 25
e al t at
M an annu emper ure (°C)
1880 1920 1960 2000 Agathis lanceolata (L3) Agathis lanceolata (L1) Agathis lanceolata (L2) Agathis ovata (O1) Araucaria columnaris (C1)
Figure 5 Lieubeau et al.
1 cm 1 cm 1 mm 1 mm 1 mm
a)
b)
c)
d)
e)
f)
Figure 51950 1960 1970 1980 0 400 800 1200 1600 A n nu a l pl u v io m e tr y ( m m ) 32 30 28 26
δ
18O (%
0/ SMOW)
Raw dataWithout false rings
Figure 6 Lieubeau et al.
δ
18O analytical error
Annuall rainfall